• Trade
  • Markets
  • Copy
  • Contests
  • News
  • 24/7
  • Calendar
  • Q&A
  • Chats
Screeners
SYMBOL
LAST
ASK
BID
HIGH
LOW
NET CHG.
%CHG.
SPREAD
SPX
S&P 500 Index
6915.62
6915.62
6915.62
6932.95
6895.49
+2.26
+ 0.03%
--
DJI
Dow Jones Industrial Average
49098.70
49098.70
49098.70
49265.46
48963.05
-285.30
-0.58%
--
IXIC
NASDAQ Composite Index
23501.23
23501.23
23501.23
23610.74
23374.26
+65.22
+ 0.28%
--
USDX
US Dollar Index
97.230
97.310
97.230
98.250
97.200
-0.820
-0.84%
--
EURUSD
Euro / US Dollar
1.18281
1.18301
1.18281
1.18334
1.17280
+0.00736
+ 0.63%
--
GBPUSD
Pound Sterling / US Dollar
1.36430
1.36467
1.36430
1.36452
1.34817
+0.01433
+ 1.06%
--
XAUUSD
Gold / US Dollar
4986.45
4986.45
4986.45
4990.01
4899.61
+50.62
+ 1.03%
--
WTI
Light Sweet Crude Oil
61.105
61.357
61.105
61.253
59.453
+1.510
+ 2.53%
--

Community Accounts

Signal Accounts
--
Profit Accounts
--
Loss Accounts
--
View More

Become a signal provider

Sell trading signals to earn additional income

View More

Guide to Copy Trading

Get started with ease and confidence

View More

Signal Accounts for Members

All Signal Accounts

Best Return
  • Best Return
  • Best P/L
  • Best MDD
Past 1W
  • Past 1W
  • Past 1M
  • Past 1Y

All Contests

  • All
  • Trump Updates
  • Recommend
  • Stocks
  • Cryptocurrencies
  • Central Banks
  • Featured News
Top News Only
Share

Dollar/Yen Dips, Down 0.47% At 155.00 Yen

Share

[Bitcoin Dips Below $88,000, 24-Hour Change -1.47%] January 26Th, According To Htx Market Data, Bitcoin Fell Below $88,000, With A 24-Hour Decrease Of 1.47%

Share

Ukraine President Zelenskiy: Documenт Of Safety Guarantees From USA Is 100% Ready

Share

Ukraine President Zelenskiy: Russia Is Avoiding Committing To A Lasting And Just Peace And Is Not Accepting A Ceasefire As A Prelude

Share

CEO: Volkswagen Ag May Pull Plans For US Audi Plant Absent Tariff Cuts

Share

Canada Has No Intention Of Making Free Trade Deal With China- Prime Minister Mark Carney

Share

Canada Respects Our Commitments Under Usma- Prime Minister Mark Carney

Share

Trump Envoy Witkoff: USA Talks With Israeli Prime Minister Netanyahu On Peace Board Were Constructive, Positive

Share

102918 Number Of Power Outage Reported In Louisiana As Of 8:09 Am Et - Poweroutage.US Website

Share

523067 Number Of Power Outage Reported In US As Of 7:22 Am Et - Poweroutage.US Website

Share

107295 Number Of Power Outage Reported In Mississippi As Of 6:34 Am Et - Poweroutage.US Website

Share

Oil Ministry - Iraq's Total Oil Exports For December At 107.651 Million Barrels

Share

Airbus CEO Says Company Faced Significant Collateral Damage From Trade Tensions In 2025

Share

Kremlin: Russian Military Will Attentively Monitor US Plans For Golden Dome - Including In Context Of Greenland

Share

100765 Number Of Power Outages Reported In Texas As Of 6 Am Et - Poweroutage.US Website

Share

Russia Will Never Discuss Anything With EU's Kallas, Will Just Wait For Her To Leave Her Post - Interfax Cites Kremlin

Share

Statistics Bureau - Israel's Industrial Production 6.3% Seasonally Adjusted In November Versus 1.5% In October

Share

Israel Raised 207 Billion Shekels In Debt In 2025

Share

Israel Public Debt To GDP Ratio 68.6% In 2025 Versus 67.7% In 2024

Share

Around 1700 Kyiv Apartment Blocks Still Without Heating After Russian Strike

TIME
ACT
FCST
PREV
U.K. Retail Sales MoM (SA) (Dec)

A:--

F: --

P: --

France Manufacturing PMI Prelim (Jan)

A:--

F: --

P: --

France Services PMI Prelim (Jan)

A:--

F: --

P: --

France Composite PMI Prelim (SA) (Jan)

A:--

F: --

P: --

Germany Manufacturing PMI Prelim (SA) (Jan)

A:--

F: --

P: --

Germany Services PMI Prelim (SA) (Jan)

A:--

F: --

P: --

Germany Composite PMI Prelim (SA) (Jan)

A:--

F: --

P: --

Euro Zone Composite PMI Prelim (SA) (Jan)

A:--

F: --

P: --

Euro Zone Manufacturing PMI Prelim (SA) (Jan)

A:--

F: --

P: --

Euro Zone Services PMI Prelim (SA) (Jan)

A:--

F: --

P: --

U.K. Composite PMI Prelim (Jan)

A:--

F: --

P: --

U.K. Manufacturing PMI Prelim (Jan)

A:--

F: --

P: --

U.K. Services PMI Prelim (Jan)

A:--

F: --

P: --

Mexico Economic Activity Index YoY (Nov)

A:--

F: --

P: --

Russia Trade Balance (Nov)

A:--

F: --

P: --

Canada Core Retail Sales MoM (SA) (Nov)

A:--

F: --

P: --

Canada Retail Sales MoM (SA) (Nov)

A:--

F: --

P: --
U.S. IHS Markit Manufacturing PMI Prelim (SA) (Jan)

A:--

F: --

P: --

U.S. IHS Markit Services PMI Prelim (SA) (Jan)

A:--

F: --

P: --

U.S. IHS Markit Composite PMI Prelim (SA) (Jan)

A:--

F: --

P: --

U.S. UMich Consumer Sentiment Index Final (Jan)

A:--

F: --

P: --

U.S. UMich Current Economic Conditions Index Final (Jan)

A:--

F: --

P: --

U.S. UMich Consumer Expectations Index Final (Jan)

A:--

F: --

P: --

U.S. Conference Board Leading Economic Index MoM (Nov)

A:--

F: --

P: --

U.S. Conference Board Coincident Economic Index MoM (Nov)

A:--

F: --

P: --

U.S. Conference Board Lagging Economic Index MoM (Nov)

A:--

F: --

P: --

U.S. UMich 1-Year-Ahead Inflation Expectations Final (Jan)

A:--

F: --

P: --

U.S. Conference Board Leading Economic Index (Nov)

A:--

F: --

P: --

U.S. Weekly Total Rig Count

A:--

F: --

P: --

U.S. Weekly Total Oil Rig Count

A:--

F: --

P: --

Germany Ifo Business Expectations Index (SA) (Jan)

--

F: --

P: --

Germany IFO Business Climate Index (SA) (Jan)

--

F: --

P: --

Germany Ifo Current Business Situation Index (SA) (Jan)

--

F: --

P: --

U.S. Dallas Fed PCE Price Index YoY (Nov)

--

F: --

P: --

Brazil Current Account (Dec)

--

F: --

P: --

Mexico Unemployment Rate (Not SA) (Dec)

A:--

F: --

P: --

Canada National Economic Confidence Index

--

F: --

P: --

U.S. Non-Defense Capital Durable Goods Orders MoM (Excl. Aircraft) (Nov)

--

F: --

P: --

U.S. Durable Goods Orders MoM (Excl. Defense) (SA) (Nov)

--

F: --

P: --

U.S. Durable Goods Orders MoM (Excl.Transport) (Nov)

--

F: --

P: --

U.S. Durable Goods Orders MoM (Nov)

--

F: --

P: --

U.S. Chicago Fed National Activity Index (Nov)

--

F: --

P: --

U.S. Dallas Fed New Orders Index (Jan)

--

F: --

P: --

U.S. Dallas Fed General Business Activity Index (Jan)

--

F: --

P: --

U.K. BRC Shop Price Index YoY (Jan)

--

F: --

P: --

China, Mainland Industrial Profit YoY (YTD) (Dec)

--

F: --

P: --

Mexico Trade Balance (Dec)

--

F: --

P: --

U.S. S&P/CS 20-City Home Price Index YoY (Not SA) (Nov)

--

F: --

P: --

U.S. S&P/CS 20-City Home Price Index MoM (SA) (Nov)

--

F: --

P: --

U.S. FHFA House Price Index MoM (Nov)

--

F: --

P: --

U.S. FHFA House Price Index (Nov)

--

F: --

P: --

U.S. Richmond Fed Manufacturing Composite Index (Jan)

--

F: --

P: --

U.S. Conference Board Present Situation Index (Jan)

--

F: --

P: --

U.S. Conference Board Consumer Expectations Index (Jan)

--

F: --

P: --

U.S. Richmond Fed Manufacturing Shipments Index (Jan)

--

F: --

P: --

U.S. Richmond Fed Services Revenue Index (Jan)

--

F: --

P: --

U.S. Conference Board Consumer Confidence Index (Jan)

--

F: --

P: --

Australia RBA Trimmed Mean CPI YoY (Q4)

--

F: --

P: --

Australia CPI YoY (Q4)

--

F: --

P: --

Australia CPI QoQ (Q4)

--

F: --

P: --

Q&A with Experts
    • All
    • Chatrooms
    • Groups
    • Friends
    ali flag
    be careful cut all positions or put good stoploss with target
    Form Forex lk flag
    https://mlk-trading-hub.base44.app
    Form Forex lk flag
    This message has been withdrawn
    FORMFOREXL flag
    That analysis was from (MLK TRADING HUB) on BTCUSD entry : 89000 stoploss: 90000 Tp 1: 88000 Tp2: 87000
    Sanjeev Ku flag
    Sanjeev Ku
    87951 to 86377. free fall
    Jon Jony flag
    BTc is beautiful
    Brandon Ki flag
    Jon Jony
    BTc is beautiful
    @Jon Jonyperhaps it's giving a chance to buy dips
    Jon Jony flag
    It's strange that BTC is dumped on Sundays before the market opens.
    Brandon Ki flag
    Jon Jony
    It's strange that BTC is dumped on Sundays before the market opens.
    @Jon Jonylikely to continue longing Gold to new ATH, but look this crazy crash on Sunday could be a warning
    Eurusdonly flag
    Eurusdonly flag
    Eurusdonly flag
    Eurusdonly
    i have been holding Shorts on Btcusd
    Eurusdonly flag
    Eurusdonly
    who got this ?
    Jon Jony flag
    Sundays and such obemas are sold, small ones are unlikely to make such discoveries next year if the whales don't buy it, then this will be a signal
    FORMFOREXL flag
    Brandon Ki flag
    Jon Jony
    Sundays and such obemas are sold, small ones are unlikely to make such discoveries next year if the whales don't buy it, then this will be a signal
    @Jon Jonysomething crazy is cooking
    Jon Jony flag
    How I love these moments like watching a movie
    "Jon Jony" recalled a message
    "Jon Jony" recalled a message
    Type here...
    Add Symbol or Code

      No matching data

      All
      Trump Updates
      Recommend
      Stocks
      Cryptocurrencies
      Central Banks
      Featured News
      • All
      • Russia-Ukraine Conflict
      • Middle East Flashpoint
      • All
      • Russia-Ukraine Conflict
      • Middle East Flashpoint
      Search
      Products

      Charts Free Forever

      Chats Q&A with Experts
      Screeners Economic Calendar Data Tools
      Membership Features
      Data Warehouse Market Trends Institutional Data Policy Rates Macro

      Market Trends

      Market Sentiment Order Book Forex Correlations

      Top Indicators

      Charts Free Forever
      Markets

      News

      News Analysis 24/7 Columns Education
      From Institutions From Analysts
      Topics Columnists

      Latest Views

      Latest Views

      Trending Topics

      Top Columnists

      Latest Update

      Signals

      Copy Rankings Latest Signals Become a signal provider AI Rating
      Contests
      Brokers

      Overview Brokers Assessment Rankings Regulators News Claims
      Broker listing Forex Brokers Comparison Tool Live Spread Comparison Scam
      Q&A Complaint Scam Alert Videos Tips to Detect Scam
      More

      Business
      Events
      Careers About Us Advertising Help Center

      White Label

      Data API

      Web Plug-ins

      Affiliate Program

      Awards Institution Evaluation IB Seminar Salon Event Exhibition
      Vietnam Thailand Singapore Dubai
      Fans Party Investment Sharing Session
      FastBull Summit BrokersView Expo
      Recent Searches
        Top Searches
          Markets
          News
          Analysis
          User
          24/7
          Economic Calendar
          Education
          Data
          • Names
          • Latest
          • Prev

          View All

          No data

          Scan to Download

          Faster Charts, Chat Faster!

          Download App
          English
          • English
          • Español
          • العربية
          • Bahasa Indonesia
          • Bahasa Melayu
          • Tiếng Việt
          • ภาษาไทย
          • Français
          • Italiano
          • Türkçe
          • Русский язык
          • 简中
          • 繁中
          Open Account
          Search
          Products
          Charts Free Forever
          Markets
          News
          Signals

          Copy Rankings Latest Signals Become a signal provider AI Rating
          Contests
          Brokers

          Overview Brokers Assessment Rankings Regulators News Claims
          Broker listing Forex Brokers Comparison Tool Live Spread Comparison Scam
          Q&A Complaint Scam Alert Videos Tips to Detect Scam
          More

          Business
          Events
          Careers About Us Advertising Help Center

          White Label

          Data API

          Web Plug-ins

          Affiliate Program

          Awards Institution Evaluation IB Seminar Salon Event Exhibition
          Vietnam Thailand Singapore Dubai
          Fans Party Investment Sharing Session
          FastBull Summit BrokersView Expo

          BOJ Eyes Rate Hikes as Weak Yen and Politics Collide

          Kevin Morgan

          Bond

          Political

          Forex

          Remarks of Officials

          Economic

          Central Bank

          Traders' Opinions

          Summary:

          Japan's central bank signals further rate hikes, driven by a weak yen and inflation, navigating political pressure.

          The Bank of Japan is poised to signal its willingness to raise interest rates again, driven by a falling yen and the prospect of solid wage growth that could fuel inflation. While an immediate rate change is unlikely, the central bank is expected to upgrade its growth forecast at its policy meeting concluding Friday.

          All eyes will be on Governor Kazuo Ueda’s post-meeting press conference for hints about the timing of the next hike. The decision is complicated by rising bond yields and Prime Minister Sanae Takaichi’s recent call for a snap election in February, creating a delicate balancing act for policymakers. After raising interest rates to a 30-year high of 0.75% in December, the BOJ is expected to hold borrowing costs steady for now.

          The Takaichi Factor: Fiscal vs. Monetary Policy

          Prime Minister Takaichi’s political maneuvers have introduced a significant variable. On Monday, she announced proposals to cut Japan’s consumption tax and vowed to end what she called "excessively tight fiscal policy." Such expansionary fiscal measures could increase inflationary pressures, giving the BOJ another reason to tighten monetary policy.

          However, a victory for Takaichi could also empower her reflationist advisers, who favor keeping rates low to support the fragile economy. This creates a complex political backdrop for the central bank.

          "So far, the BOJ has maintained a negative stance toward consecutive rate hikes," noted Ayako Fujita, Japan chief economist at JPMorgan Securities, citing concerns over the financial system and pressure from Takaichi's administration. "Whether the recent yen depreciation will prompt a change in this stance is a key point to watch."

          Markets Under Pressure: Yen and Bonds React

          Japan’s financial markets are already feeling the strain. Concerns over the nation's finances have pushed the 10-year Japanese government bond yield to a 27-year high of 2.30% this week.

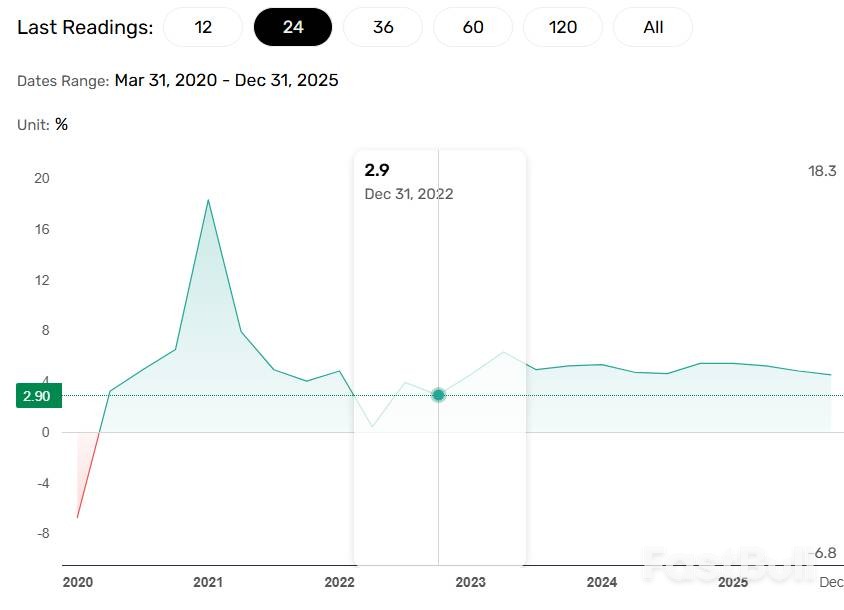
          Meanwhile, the yen has weakened considerably since Takaichi became prime minister in October, falling about 8% against the dollar. It briefly hit an 18-month low of 159.45 last week, its weakest point since Japan’s last currency intervention in July 2024. Although it has since recovered slightly to around 158.18, the downward trend is raising import costs and contributing to broader consumer price increases. This has led markets to speculate that the BOJ may need to speed up its rate hike cycle to prevent inflation from overheating.

          When Will the Next Rate Hike Happen?

          Internal discussions at the BOJ may be shifting. Sources have indicated that some policymakers see a case for raising rates sooner than markets anticipate, with April emerging as a distinct possibility. The primary driver for this view is the risk that a sliding yen will add to already broadening inflationary pressures.

          This contrasts with the broader market consensus. A Reuters poll shows most analysts expect the BOJ to wait until July before hiking rates again, with over 75% forecasting the policy rate to reach 1% or higher by September. The central bank has moved methodically since ending its massive stimulus program in 2024, most recently lifting its short-term rate to 0.75% from 0.5% last month.

          An Upgraded Economic Outlook

          The BOJ's quarterly outlook report, due on Friday, is expected to reinforce the bank's growing conviction that conditions are aligning for further rate increases. Key updates are likely to include:

          • Economic Growth: The forecast for fiscal 2026 is expected to be revised upward from the 0.7% growth projected three months ago. This reflects a boost from government stimulus and the fading impact of U.S. tariffs.

          • Inflation: The core consumer inflation forecast for fiscal 2026 may be revised slightly higher from the 1.8% projected previously, as rising goods prices and steady wage gains offset government efforts to curb utility bills.

          • 2% Target: The central bank is expected to maintain its projection that inflation will durably reach its 2% target around October, or in the latter half of the fiscal year beginning in April.

          To stay updated on all economic events of today, please check out our Economic calendar
          Risk Warnings and Disclaimers
          You understand and acknowledge that there is a high degree of risk involved in trading. Following any strategies or investment methods may lead to potential losses. The content on the site is provided by our contributors and analysts for information purposes only. You are solely responsible for determining whether any trading assets, securities, strategy, or any other product is suitable for investing based on your own investment objectives and financial situation.
          Add to Favorites
          Share

          China Hits 5% GDP Goal, But Stocks Demand New Stimulus

          Michael Ross

          Data Interpretation

          Economic

          Central Bank

          Traders' Opinions

          Technical Analysis

          Stocks

          China–U.S. Trade War

          China's economy officially hit its 5% growth target for 2025, but a closer look at the data reveals a more complex and challenging picture. While the headline number was achieved, slowing retail sales and a deepening slump in house prices are flashing warning signs for 2026 growth.

          Despite these mixed signals, mainland Chinese stocks are trading near their January highs. Investors are betting that Beijing will be forced to unleash fresh fiscal stimulus to revive domestic demand and stabilize the critical housing market. This optimism is providing a bullish medium-term tailwind for key indices like the CSI 300 and Hang Seng, both of which remain above key technical indicators.

          This analysis breaks down the key economic drivers, the market's outlook for the next 3-6 months, and the crucial chart levels that traders are watching.

          A Two-Track Economy: Strong Exports, Weak Consumers

          Official data released on January 19 confirmed that China met its 5% GDP target for 2025. However, the economy showed signs of losing momentum in the final quarter.

          Year-on-year GDP growth slowed to 4.5% in Q4, down from 4.8% in Q3, marking the weakest annual growth rate since the fourth quarter of 2022. On a quarter-on-quarter basis, the economy expanded by 1.2%, a slight acceleration from the 1.1% growth seen in Q3.

          Figure 1: China's year-on-year GDP growth slowed in the latter half of 2025, settling near 4.5% by the end of the fourth quarter.

          The economy in Q4 was propped up by a rebound in industrial production and a sharp increase in exports. Industrial output grew 5.2% year-on-year in December, up from 4.8% in November. At the same time, Chinese exports surged by 6.6% year-on-year in December, an increase from the 5.9% rise in the previous month.

          Figure 2: Chinese industrial production saw a rebound to 5.2% year-on-year growth in December 2025 after fluctuating throughout the year.

          However, this industrial strength masks significant weakness in the domestic economy. A slump in fixed asset investments hints at a potential slowdown in future production. More importantly, domestic consumption is faltering. Retail sales grew just 0.9% year-on-year in December, a notable deceleration from 1.3% in November. This continues a sharp cooling trend since the 6.4% surge seen in May.

          Figure 3: After peaking at 6.4% in May 2025, China's retail sales growth steadily declined, ending the year at just 0.9%.

          This slowdown in spending is closely linked to the deteriorating real estate market. The House Price Index fell 2.7% year-on-year in December, worsening from a 2.4% decline in November. The persistent fall in property values has damaged consumer sentiment and weighed heavily on household spending.

          Expert Analysis: Why More Stimulus Seems Inevitable

          Alicia Garcia Herrero, Chief Economist for Asia at Natixis, suggested the weak domestic figures might reflect a deliberate policy choice.

          "China's 5% GDP growth target for 2025 hits the government's target, but it reveals cracks," she stated. "With the 5% target secured, the government chose to 'save its bullets' for the coming year. This is why we saw retail sales and fixed asset investment slow... I would not interpret these numbers as overly negative, as they largely reflect a deliberate government maneuver to manage the economy."

          However, she warned that the underlying trends are concerning and will require a policy response.

          "What is most concerning is that China's domestic growth momentum is becoming increasingly autonomous and unsustainable," Garcia Herrero added. "Household income grew really little in 2025 (4.4% from 5.1% in 2024), causing household spending to decelerate... Furthermore, the deflationary environment, especially for corporates, is entrenched. More stimulus will be needed in 2026, especially if the government keeps the 5% target."

          PBoC Holds Fire, Fueling Market Speculation

          Despite the clear signs of waning domestic demand, the People's Bank of China (PBoC) has so far refrained from cutting rates. On January 20, the central bank kept its one-year and five-year loan prime rates unchanged at 3% and 3.5%, respectively.

          This decision came even as data showed credit demand plunged in December. According to CN Wire, Chinese banks issued 908 billion yuan ($130 billion) in new loans, the smallest amount since 2018. While this was above the 800 billion yuan expectation, it highlighted weak demand from both consumers and businesses.

          The PBoC's inaction initially weighed on markets, but Chinese indices quickly recovered, suggesting investors are increasingly convinced that significant stimulus is just a matter of time. Further policy support is seen as essential to affirming the market's bullish outlook.

          Headwinds and Risks to the Bullish Case

          While the base case for many investors is more stimulus, several downside risks could challenge the positive market trend:

          • A breakdown in the current trade war truce.

          • The imposition of new global tariffs on Chinese goods.

          • A significant delay by Beijing in implementing monetary easing or fiscal stimulus.

          • A sharper-than-expected slowdown in global demand for Chinese exports.

          • An intensification of the housing market crisis.

          Any of these factors could push the Hang Seng and CSI 300 below their 50-day Exponential Moving Averages (EMAs), signaling a potential near-term bearish reversal.

          CSI 300 Technical Outlook: Path to 5,000?

          The technical picture for the CSI 300 index remains bullish. The index is trading above both its 50-day and 200-day EMAs, which are key indicators of positive momentum.

          A decisive break above the January 13 high of 4,817 would clear the path for a move toward the psychological 5,000 level. If bulls can maintain control and push through that resistance, the next major target would be the 2021 all-time high of 5,931. To maintain this bullish structure, the index must avoid a sustained drop below its 50-day EMA.

          Figure 4: The daily chart for the CSI 300 shows a bullish trend, with the price holding firmly above both its 50-day (blue) and 200-day (red) EMAs.

          Hang Seng Index Analysis: Bulls Eye 28,000

          The Hang Seng Index mirrors the bullish setup of the CSI 300, trading comfortably above its 50-day and 200-day EMAs.

          The immediate resistance to watch is the January 15 high of 27,207. A break above this level would bring the October 2025 high of 27,382 into focus. Overcoming that hurdle could open the door for a test of the 28,000 mark. A sustained breakout above 28,000 would put the index on track to target 30,000 for the first time since 2021.

          Figure 5: The Hang Seng Index daily chart indicates a positive outlook, with the price currently above its key 50-day and 200-day EMAs.

          The Bottom Line: Can Stimulus Sustain the Rally?

          The short-to-medium-term outlook for Chinese equities remains constructive. The combination of Beijing's policy goals, strong external demand, and China's progress in key sectors like AI is likely to support buyer interest.

          However, the rally's sustainability hinges on effective policy action. Developments in the housing sector, global trade dynamics, and corporate profit margins will be critical. If Beijing delivers the stimulus the market expects, the CSI 300 could have a real chance of challenging its 2021 peak.

          To stay updated on all economic events of today, please check out our Economic calendar
          Risk Warnings and Disclaimers
          You understand and acknowledge that there is a high degree of risk involved in trading. Following any strategies or investment methods may lead to potential losses. The content on the site is provided by our contributors and analysts for information purposes only. You are solely responsible for determining whether any trading assets, securities, strategy, or any other product is suitable for investing based on your own investment objectives and financial situation.
          Add to Favorites
          Share

          Silver (XAGUSD) Price Forecast: Breakout Signals Strong Upside Continuation

          Winkelmann

          Commodity

          Forex

          Silver (XAGUSD) Price Forecast: Breakout Signals Strong Upside Continuation_1

          Breakout to New High Confirms Bullish Control

          Silver surged to a new all-time high of $94.68 on Monday and confirmed a breakout from a three-day consolidation range above $93.51. This shows the bulls remain in firm control with the trend set to extend to higher prices. Enthusiasm from buyers can be seen by the low of the day. It was at $91.71 and in the upper range of the prior three days of sideways trading. That showed strong demand that led to buyers eventually overcoming sellers into new highs. Additional confirmation of strength is needed since Monday's session was shortened due to the Martin Luther King Jr. holiday

          Silver (XAGUSD) Price Forecast: Breakout Signals Strong Upside Continuation_2

          Rising Support Levels Reinforce Uptrend Strength

          Although the risk of a parabolic advance that leads to a blow off top is rising, upward progress is constructive so far. Respect for key support levels will further confirm demand seen in the trend. Given today's breakout, last week's higher low of $80.31 is key lower support based on structure. For the short term, the 10-day moving average at $85.88 and rising provides significant dynamic support, along with a rising trendline. In the slightly bigger picture, the 20-day average at $79.35 is key. A failure of the 20-day average would first be needed before there were signs of a larger potential correction.

          Bull Pennant Breakout Signals Trend Continuation

          Notice that the 10-day line has been clear dynamic support since it was last reclaimed in late-November, leading to price acceleration. During the rise it was successfully tested as support several times, including recently. Prior to the decisive breakout of a bull pennant last week, silver bounced off support near the 10-day average. That was the last time it was touched as bullish momentum subsequently improved.

          Measured-Move Targets Highlight Further Upside Potential

          The bull pennant breakout provided a classic trend continuation signal that was confirmed by a new closing trend high. It began a new leg up in the trend. To get a rough estimate of where silver could be heading, a measuring objective is calculated by taking the distance from the November 28 new high breakout at $54.49 to the top of the pennant at $84.03, then adding that distance to the pennant trigger of $82.77.

          When measuring price, that calculates to around $112.32, and when looking at percentage change, the upside potential target is $127.63. The point is that there is potential upside for silver based on the trend pattern. Whether those measured moves are reach or not, they suggest continued strong demand from buyers.

          Source: FX Empire

          Risk Warnings and Disclaimers
          You understand and acknowledge that there is a high degree of risk involved in trading. Following any strategies or investment methods may lead to potential losses. The content on the site is provided by our contributors and analysts for information purposes only. You are solely responsible for determining whether any trading assets, securities, strategy, or any other product is suitable for investing based on your own investment objectives and financial situation.
          Add to Favorites
          Share

          Americans Bear Almost All The Cost Of Trump Tariffs, Study Shows

          Justin

          Forex

          Economic

          President Donald Trump's duties on imported goods are paid almost entirely by American importers, their domestic customers and ultimately US consumers, a study from a German think tank concluded.

          "Foreign exporters did not meaningfully reduce their prices in response to US tariff increases," a report released on Monday by the Kiel Institute for the World Economy said. "The US$200 billion (RM810 billion) surge in customs revenue represents US$200 billion extracted from American businesses and households."

          The study found that only about 4% of the tariff burden is shouldered by foreign firms, with a "near-complete" pass-through of 96% to US buyers that pay the levies and then must either absorb them or raise selling prices. Manufacturers and retailers are next in line in deciding whether they'll pass along their higher costs or deal with tighter margins.

          "The tariff functions not as a tax on foreign producers, but as a consumption tax on Americans," Kiel researchers Julian Hinz, Aaron Lohmann, Hendrik Mahlkow and Anna Vorwig wrote.

          The research zeroes in on Brazil and India, whose exports were targeted with steep, broad US tariffs last year. After a 50% duty took effect, Brazil's exporters "did not substantially reduce their dollar prices." A similar pattern was seen with India, which first faced a 25% that was raised weeks later to 50%.

          Several reasons exist why exporters don't foot much of the bill, including their ability to redirect sales to other markets.

          "The adjustment occurs through reduced trade volumes, not price concessions," according to the Kiel paper. "Given the choice between maintaining margins on reduced sales or slashing margins to maintain volume, most exporters apparently prefer the former.

          Based on shipment data covering 25 million transactions worth about US$4 trillion, the Kiel study runs counter to the Trump administration's argument that trading partners pay tariffs.

          "This claim has been central to the policy's justification: Tariffs are framed as a tool to extract concessions from trading partners while generating revenue for the US government — at no cost to American households" the Kiel researchers wrote. "Our research shows the opposite: American importers and consumers bear nearly all the cost."

          Source: Theedgemarkets

          To stay updated on all economic events of today, please check out our Economic calendar
          Risk Warnings and Disclaimers
          You understand and acknowledge that there is a high degree of risk involved in trading. Following any strategies or investment methods may lead to potential losses. The content on the site is provided by our contributors and analysts for information purposes only. You are solely responsible for determining whether any trading assets, securities, strategy, or any other product is suitable for investing based on your own investment objectives and financial situation.
          Add to Favorites
          Share

          China Meets 12M Ton US Soybean Purchase Goal

          King Ten

          Data Interpretation

          Political

          Commodity

          Remarks of Officials

          Economic

          Traders' Opinions

          China–U.S. Trade War

          China has purchased approximately 12 million tons of U.S. soybeans over the last three months, successfully clearing a significant trade hurdle and fulfilling a key commitment outlined by the Trump administration.

          According to traders with direct knowledge of the transactions, who requested anonymity as they are not authorized to speak to the press, the world’s top soybean consumer has now booked enough shipments to meet the target.

          This buying surge marks a notable reversal. For months, China had avoided American agricultural products as trade tariffs escalated. Purchases resumed in late October, just ahead of a high-stakes summit between U.S. President Donald Trump and Chinese leader Xi Jinping. Following the talks, the White House announced that Beijing had agreed to buy at least 12 million tons of American soybeans, with an initial 2025 deadline that was later moved up to February.

          While Beijing has not publicly confirmed the commitment, Chinese authorities have taken actions to facilitate the imports, such as reducing tariffs and lifting restrictions on three U.S. suppliers.

          State-Directed Buying and Data Lag

          The current 12-million-ton tally reflects consistent bookings by Chinese state-owned companies in recent weeks. Official export data from the U.S. Department of Agriculture, which operates on a delay, reported China's purchases at just over 8 million tons as of January 8.

          Traders indicate that the majority of these cargoes are scheduled for loading through the first quarter. A large portion of the purchases was handled by Sinograin, the state entity responsible for managing China's strategic stockpiles, with a significant amount of the soybeans expected to enter these national reserves. In a related move, Beijing has also held several soybean auctions recently, suggesting an effort to clear warehouse space for the incoming American crops.

          A Temporary Boost, Not a Fundamental Shift

          Meeting this widely anticipated target is expected to build confidence that China might also achieve a more ambitious goal outlined by the White House: purchasing at least 25 million tons of U.S. soybeans annually through 2028.

          However, this recent activity does not signal a fundamental change in China’s long-term purchasing strategy. Several key factors suggest a different picture:

          • Supplier Diversification: As part of a broader food security initiative, China has actively worked to reduce its reliance on U.S. crops since the trade war began.

          • Economic Headwinds: Economic challenges within China have also put a damper on overall demand.

          • Brazilian Competition: Brazil, the world's top soybean producer, is on track for another massive harvest, offering a powerful alternative.

          Traders report that China has already covered its import needs through March and is now booking new-crop soybeans from Brazil for delivery as far out as August. This underscores the core uncertainty facing the market.

          "That's going to be an upcoming issue: whether we can count on China to continue to buy after that 12 million or not," noted Randy Place, a senior grains analyst at the Hightower Report.

          To stay updated on all economic events of today, please check out our Economic calendar
          Risk Warnings and Disclaimers
          You understand and acknowledge that there is a high degree of risk involved in trading. Following any strategies or investment methods may lead to potential losses. The content on the site is provided by our contributors and analysts for information purposes only. You are solely responsible for determining whether any trading assets, securities, strategy, or any other product is suitable for investing based on your own investment objectives and financial situation.
          Add to Favorites
          Share

          MSCI Rule Shift May Spur $2 Billion Exit From Indonesian Stocks

          Winkelmann

          Stocks

          Global funds may withdraw more than $2 billion from Indonesian equities in coming months if MSCI Inc. proceeds with a change to its indexing methodology, underscoring concerns about the investability of Southeast Asia's biggest stock market.

          The index compiler will decide by the end of January whether to tighten its definition of free float — the number of shares available for trading and a key determinant of a stock's weighting – following industry feedback. Any approved changes would be effective in the index provider's May review.

          If MSCI finds that companies in Indonesia — which already have Asia's smallest average free float — have even less stock available for trading than reported, passive investors would be forced to sell existing positions. The decision would be among the most consequential for the nation's $971 billion equity market in years, with implications for fund flows and investor perception.

          "This exercise serves as a key test of the country's capital market reform agenda, underscoring the corporate governance improvements required to unlock greater international participation and long-term investment flows," said Gary Tan, a portfolio manager at Allspring Global Investments.

          Outflows may hit the nation's and region's biggest companies most, including PT Petrindo Jaya Kreasi, which is 84% owned by billionaire Prajogo Pangestu. There's also PT Barito Pacific — in which Pangestu owns 71%.

          In the big business of index compilations, free float is a relatively obscure but crucial metric. Benchmark providers like MSCI and FTSE Russell rely on it to measure how easily investors can buy a stock – the more shares available for trading, the higher the potential weighting in an index. When free float is low, stocks can become what Aletheia Capital Analyst Nirgunan Tiruchelvam calls "museum pieces: you can look but not buy enough."

          Low free float has already become a flash point in Indonesia, where many of the benchmark Jakarta Composite Index's biggest members are thinly traded stocks controlled by a handful of wealthy individuals. Investors argue these volatile stocks distort the index, which masks true market performance and heightens the risk of manipulation.

          More than 200 stocks on the benchmark have a free float below 15%. Across major Asia-Pacific indexes, Indonesia's benchmark has the lowest average free float, according to Bloomberg data. PT Samuel Sekuritas Indonesia is among several brokerages forecasting about $2 billion in foreign passive fund outflows if the rule is adopted.

          The dislocation was evident last year, when the JCI outperformed the MSCI Indonesia Index by the widest margin ever. With so many JCI constituents thinly traded, fund managers say the benchmark is effectively untrackable, pushing them instead toward the more stringent MSCI Indonesia Index. The gap proved costly: the JCI surged more than 22% to a record, while the MSCI Indonesia fell 3%.

          A reduction in free float numbers and a smaller weighting for Indonesia's companies will likely just accelerate the divergence instead of narrow it, investors say. Still, MSCI has said that the potential changes offer "additional transparency" that could help address "information gaps", according to an e-mailed statement.

          In theory, free float math is simple: it's the total number of shares minus those held by strategic investors like governments or founders. In practice, however, Indonesia's opaque and web-like business relationships mean it's difficult to identify strategic holders, a concern MSCI raised in its September consultation paper.

          The Indonesia Stock Exchange currently requires companies to disclose shareholders owning more than 5% of a company. MSCI said a new data provider can identify shareholder types for electronically traded stocks, including those holding under 5%, giving a clearer picture of true free float.

          One MSCI proposal would base free float on the lower figure from either public filings or the new dataset. By its own projections, that would shrink the free‑float market cap of 15 index names — resulting in outflows.

          Regulators have sought to ease concerns with plans to raise minimum float levels to 10%-15% from the current 7.5% level. The longer-term goal is 25%, though no timeline has been set. That compares to Hong Kong and India's 25% rule and Thailand's 15%.

          It's an uphill battle. A tax rule that exempts individuals and companies from income tax when they reinvest dividends for at least three years encourages more corporate shareholding — precisely the type MSCI wants to exclude from free‑float calculations because it masks how much stock is truly in public hands.

          Fear of missing out may also factor into the calculus. "Given Indonesian stocks' long term upside potential, they're too attractive for the index provider to keep reducing the weighting," said Dimas Yusuf, chief investment officer at PT Sucorinvest Asset Management.

          The financial regulator is also preparing stricter rules for small-company listings, though the bourse cautions the market will still need much more liquidity to absorb new shares when companies boost the amount available for trading.

          That liquidity may ultimately not materialize, said Christopher Andre Benas, head of research at PT BCA Sekuritas, noting that institutional investors will remain selective and retail investors lack the cash to absorb the rest.

          Source: Bloomberg Europe

          Risk Warnings and Disclaimers
          You understand and acknowledge that there is a high degree of risk involved in trading. Following any strategies or investment methods may lead to potential losses. The content on the site is provided by our contributors and analysts for information purposes only. You are solely responsible for determining whether any trading assets, securities, strategy, or any other product is suitable for investing based on your own investment objectives and financial situation.
          Add to Favorites
          Share

          Silver Hits Record High As US-EU Crisis Over Greenland Simmers

          Samantha Luan

          Forex

          Commodity

          Silver hit a record high and gold traded near an all-time peak as President Donald Trump's push to take over Greenland fueled fears of a US-Europe trade war and kept markets on edge.

          The precious metals edged lower, after rising sharply in the previous session following Trump's pledge to put tariffs on eight European nations that opposed his Greenland ambitions. Silver briefly touched a record of $94.7295 an ounce on Tuesday and gold was near $4,670.

          The US's aggression toward its NATO allies has rattled markets, buoying demand for havens and reviving the 'Sell America' trade. Investors are now waiting to see how Europe will react. French President Emmanuel Macron intends requesting activation of the European Union's anti-coercion instrument, although German Chancellor Friedrich Merz said he's trying to get him to tone down his response.

          The crisis — coming hot on the heels of the US's seizure of Venezuela's leader — has added further impetus to what was already a breakneck rally in precious metals. The Trump administration's renewed attacks on the Federal Reserve have also aided gold and silver this year, as they've revived concerns about the independence of the central bank.

          "The rally in precious metals did not begin with this dispute, and it is unlikely to end with it," Ole Hansen, a strategist at Saxo Bank A/S, said in a note. "Instead, the Greenland episode has poured fresh fuel on a rally that has been building for months, driven by a macro and geopolitical backdrop that has become increasingly uncomfortable for investors reliant on financial assets alone."

          Silver dipped 0.6% to $93.8590 an ounce as of 7:56 a.m. Singapore time, and gold declined 0.1% to $4,665.73. The Bloomberg Dollar Spot Index added 0.1% after losing 0.3% on Monday.

          Source: Bloomberg Europe

          Risk Warnings and Disclaimers
          You understand and acknowledge that there is a high degree of risk involved in trading. Following any strategies or investment methods may lead to potential losses. The content on the site is provided by our contributors and analysts for information purposes only. You are solely responsible for determining whether any trading assets, securities, strategy, or any other product is suitable for investing based on your own investment objectives and financial situation.
          Add to Favorites
          Share
          FastBull
          Copyright © 2026 FastBull Ltd

          728 RM B 7/F GEE LOK IND BLDG NO 34 HUNG TO RD KWUN TONG KLN HONG KONG

          TelegramInstagramTwitterfacebooklinkedin
          App Store Google Play Google Play
          Products
          Charts

          Chats

          Q&A with Experts
          Screeners
          Economic Calendar
          Data
          Tools
          Membership
          Features
          Function
          Markets
          Copy Trading
          Latest Signals
          Contests
          News
          Analysis
          24/7
          Columns
          Education
          Company
          Careers
          About Us
          Contact Us
          Advertising
          Help Center
          Feedback
          User Agreement
          Privacy Policy
          Personal Information Protection Statement
          Business

          White Label

          Data API

          Web Plug-ins

          Poster Maker

          Affiliate Program

          Risk Disclosure

          The risk of loss in trading financial instruments such as stocks, FX, commodities, futures, bonds, ETFs and crypto can be substantial. You may sustain a total loss of the funds that you deposit with your broker. Therefore, you should carefully consider whether such trading is suitable for you in light of your circumstances and financial resources.

          No decision to invest should be made without thoroughly conducting due diligence by yourself or consulting with your financial advisors. Our web content might not suit you since we don't know your financial conditions and investment needs. Our financial information might have latency or contain inaccuracy, so you should be fully responsible for any of your trading and investment decisions. The company will not be responsible for your capital loss.

          Without getting permission from the website, you are not allowed to copy the website's graphics, texts, or trademarks. Intellectual property rights in the content or data incorporated into this website belong to its providers and exchange merchants.

          Not Logged In

          Log in to access more features

          Connect Broker
          Become a signal provider
          Help Center
          Customer Service
          Dark Mode
          Price Up/Down Colors

          Log In

          Sign Up

          Position
          Layout
          Fullscreen
          Default to Chart
          The chart page opens by default when you visit fastbull.com