• Trade
  • Markets
  • Copy
  • Contests
  • News
  • 24/7
  • Calendar
  • Q&A
  • Chats
Screeners
SYMBOL
LAST
ASK
BID
HIGH
LOW
NET CHG.
%CHG.
SPREAD
SPX
S&P 500 Index
6917.82
6917.82
6917.82
6993.09
6862.05
-58.62
-0.84%
--
DJI
Dow Jones Industrial Average
49240.98
49240.98
49240.98
49653.13
48832.78
-166.67
-0.34%
--
IXIC
NASDAQ Composite Index
23255.18
23255.18
23255.18
23691.60
23027.21
-336.92
-1.43%
--
USDX
US Dollar Index
97.240
97.320
97.240
97.300
97.140
+0.040
+ 0.04%
--
EURUSD
Euro / US Dollar
1.18239
1.18248
1.18239
1.18377
1.18075
+0.00064
+ 0.05%
--
GBPUSD
Pound Sterling / US Dollar
1.37184
1.37196
1.37184
1.37328
1.36821
+0.00220
+ 0.16%
--
XAUUSD
Gold / US Dollar
5054.70
5055.04
5054.70
5091.84
4910.07
+108.45
+ 2.19%
--
WTI
Light Sweet Crude Oil
62.856
62.886
62.856
63.865
62.685
-0.778
-1.22%
--

Community Accounts

Signal Accounts
--
Profit Accounts
--
Loss Accounts
--
View More

Become a signal provider

Sell trading signals to earn additional income

View More

Guide to Copy Trading

Get started with ease and confidence

View More

Signal Accounts for Members

All Signal Accounts

Best Return
  • Best Return
  • Best P/L
  • Best MDD
Past 1W
  • Past 1W
  • Past 1M
  • Past 1Y

All Contests

  • All
  • Trump Updates
  • Recommend
  • Stocks
  • Cryptocurrencies
  • Central Banks
  • Featured News
Top News Only
Share

Finance Minister: Indonesia's Tax Revenues Jump In January

Share

Fitch Sees Poland's Deficit At Around 7% Of GDP In 2026

Share

Santander BP CEO Says Bank Is Reviewing Its Strategy But Does Not Expect Major Changes

Share

Venezuela Top Economic Advisor Ortega: Want Venezuela To Be Known As A Country With One Of The Highest Oil Production Levels

Share

Russian Finance Ministry To Cut Forex Sales To 11.9 Billion Roubles A Day From February 6

Share

South Korea Parliament To Finalise Bill On US Investment Fund By March 9

Share

USA S&P 500 E-Mini Futures Up 0.05%, NASDAQ 100 Futures Down 0.11%, Dow Futures Up 0.17%

Share

Palestinian Officials: Israeli Strikes Kill 18 In Gaza, Patient Crossings At Rafah Halted

Share

Cores - Spain December Crude Oil Imports Falls 4.9% Year-On-Year To 5.3 Million Tonnes

Share

Economic Affairs Secretary: India To Ensure Its Record Borrowing Plan Doesn't Disturb Markets

Share

China Finance Ministry: To Issue 14 Billion Yuan Of Treasury Bonds In Hong Kong On Feb 11

Share

Swedish Central Bank Governor Thedeen:-, My Assessment Is That The Likelihoodof Very Restrictive Trade Barriers Is Nevertheless Limited

Share

Swedish Central Bank Governor Thedeen:-The Greenland Crisis Hascreated Renewed Uncertainty Regarding The Rules That Will Apply To Our Economicexchanges With The United States

Share

Swedish Central Bank's Seim: I Assess That The Increased Uncertainty Reduces The Risk Of Demand Driven Inflation In Sweden Somewhat

Share

Swedish Central Bank's Deputy Governor Bunge: Will Probably Have To Monitor Both Whether The Strengthening Of The Krona Continues And Its Impact On Prices

Share

Iceland's Central Bank: Further Decisions To Lower Interest Rates Will Depend On Clear Evidence That Inflation Is Falling Back To Bank's 2½% Inflation Target

Share

Swedish Central Bank Governor Thedeen:-At Present I Assess That Monetarypolicy Is Following A Stable And Reasonable Course

Share

Icelandic Central Bank Key Interest Rate Unchanged At 7.25 Percent

Share

Regional Official: Regional Invitees To Istanbul Talks Were Discussed With Iran During Planning Process

Share

Regional Official: Iran Has Said From The Start That It Will Only Discuss With US Its Nuclear Programme, Americans Wanted Other Issues On Agenda

TIME
ACT
FCST
PREV
Australia Overnight (Borrowing) Key Rate

A:--

F: --

P: --

RBA Rate Statement
Japan 10-Year Note Auction Yield

A:--

F: --

P: --

The U.S. House of Representatives voted on a short-term spending bill to end the partial government shutdown.
Saudi Arabia IHS Markit Composite PMI (Jan)

A:--

F: --

P: --

RBA Press Conference
Turkey PPI YoY (Jan)

A:--

F: --

P: --

Turkey CPI YoY (Jan)

A:--

F: --

P: --

Turkey CPI YoY (Excl. Energy, Food, Beverage, Tobacco & Gold) (Jan)

A:--

F: --

P: --

U.K. 10-Year Note Auction Yield

A:--

F: --

P: --

Richmond Federal Reserve President Barkin delivered a speech.
U.S. Weekly Redbook Index YoY

A:--

F: --

P: --

Mexico Manufacturing PMI (Jan)

A:--

F: --

P: --

U.S. API Weekly Refined Oil Stocks

A:--

F: --

P: --

U.S. API Weekly Gasoline Stocks

A:--

F: --

P: --

U.S. API Weekly Cushing Crude Oil Stocks

A:--

F: --

P: --

U.S. API Weekly Crude Oil Stocks

A:--

F: --

P: --

Japan IHS Markit Services PMI (Jan)

A:--

F: --

P: --

Japan IHS Markit Composite PMI (Jan)

A:--

F: --

P: --

China, Mainland Caixin Services PMI (Jan)

A:--

F: --

P: --

China, Mainland Caixin Composite PMI (Jan)

A:--

F: --

P: --

India HSBC Services PMI Final (Jan)

A:--

F: --

P: --

India IHS Markit Composite PMI (Jan)

A:--

F: --

P: --

Russia IHS Markit Services PMI (Jan)

A:--

F: --

P: --

South Africa IHS Markit Composite PMI (SA) (Jan)

A:--

F: --

P: --

Italy Services PMI (SA) (Jan)

A:--

F: --

P: --

Italy Composite PMI (Jan)

A:--

F: --

P: --

Germany Composite PMI Final (SA) (Jan)

A:--

F: --

P: --

Euro Zone Composite PMI Final (Jan)

A:--

F: --

P: --

Euro Zone Services PMI Final (Jan)

A:--

F: --

P: --

U.K. Composite PMI Final (Jan)

--

F: --

P: --

U.K. Total Reserve Assets (Jan)

--

F: --

P: --

U.K. Services PMI Final (Jan)

--

F: --

P: --

U.K. Official Reserves Changes (Jan)

--

F: --

P: --

Euro Zone Core CPI Prelim YoY (Jan)

--

F: --

P: --

Euro Zone Core HICP Prelim YoY (Jan)

--

F: --

P: --

Euro Zone PPI MoM (Dec)

--

F: --

P: --

Euro Zone HICP Prelim YoY (Jan)

--

F: --

P: --

Euro Zone Core HICP Prelim MoM (Jan)

--

F: --

P: --

Italy HICP Prelim YoY (Jan)

--

F: --

P: --

Euro Zone Core CPI Prelim MoM (Jan)

--

F: --

P: --

Euro Zone PPI YoY (Dec)

--

F: --

P: --

U.S. MBA Mortgage Application Activity Index WoW

--

F: --

P: --

Brazil IHS Markit Composite PMI (Jan)

--

F: --

P: --

Brazil IHS Markit Services PMI (Jan)

--

F: --

P: --

U.S. ADP Employment (Jan)

--

F: --

P: --

The U.S. Treasury Department released its quarterly refinancing statement.
U.S. IHS Markit Composite PMI Final (Jan)

--

F: --

P: --

U.S. IHS Markit Services PMI Final (Jan)

--

F: --

P: --

U.S. ISM Non-Manufacturing Price Index (Jan)

--

F: --

P: --

U.S. ISM Non-Manufacturing Employment Index (Jan)

--

F: --

P: --

U.S. ISM Non-Manufacturing New Orders Index (Jan)

--

F: --

P: --

U.S. ISM Non-Manufacturing PMI (Jan)

--

F: --

P: --

U.S. ISM Non-Manufacturing Inventories Index (Jan)

--

F: --

P: --

U.S. EIA Weekly Crude Oil Imports Changes

--

F: --

P: --

U.S. EIA Weekly Crude Demand Projected by Production

--

F: --

P: --

U.S. EIA Weekly Heating Oil Stock Changes

--

F: --

P: --

U.S. EIA Weekly Gasoline Stocks Change

--

F: --

P: --

U.S. EIA Weekly Crude Stocks Change

--

F: --

P: --

U.S. EIA Weekly Cushing, Oklahoma Crude Oil Stocks Change

--

F: --

P: --

Australia Trade Balance (SA) (Dec)

--

F: --

P: --

Q&A with Experts
    • All
    • Chatrooms
    • Groups
    • Friends
    Visxa Benfica flag
    Silver just swept the old low and then pumped back up to 93.9 within a few candles man
    SlowBear ⛅ flag
    McOkanz
    @McOkanzWell you just joining silver brother?
    SlowBear ⛅ flag
    Tomasodoma
    just got stumbed out at 5600
    @Tomasodoma 5600 on gold? is it there already? or you are hoping?
    Visxa Benfica flag
    Tomasodoma
    just got stumbed out at 5600
    @Tomasodoma5600 sounds like an old target or some distant resistance level from the past
    EuroTrader flag
    7W65JD58RM
    It's so hard to break through 5100!
    @7W65JD58RMbut when it finally breaks above trust me it's headed for 5400 without stopping
    Visxa Benfica flag
    Right now, the price isn't approaching that level yet, bro
    Visxa Benfica flag
    @TomasodomaPerhaps you were holding long positions from a lower level and now see momentum slowing down, or you're trapped at the previous high?
    Tomasodoma flag
    SlowBear ⛅
    @SlowBear ⛅yeah bro
    McOkanz flag
    Visxa Benfica
    @Visxa Benfica 😂🤣😂😂 That’s why it’s 50/50
    McOkanz flag
    @Sarkar
    📈 (#XAUUSD) BUY NOW 5075/5073 First Round TAKE PROFIT 5080 TAKE PROFIT 5085 TAKE PROFIT 5090 ❌ STOP LOSS 5065 USE IT GYUS  BEST SIGNAL FOR NOW
    @@Sarkar if Gold didn’t break 5100 I refuse to take any trade My choice thou
    Size flag
    Tomasodoma
    just got stumbed out at 5600
    @TomasodomaHow do you mean exactly? Price hasn’t traded up to 5600 yet.
    SlowBear ⛅ flag
    Tomasodoma
    @TomasodomaWell i say we wait together i can see the current market price is 5091 we should first hope for 5100 violation then we look for more nuys
    Visxa Benfica flag
    McOkanz
    @McOkanzHuge volume bro
    SlowBear ⛅ flag
    McOkanz
    @McOkanz Yes my choice too, failure to break 5100 then we sit tight
    Visxa Benfica flag
    This is definitely a liquidity grab + extremely strong CHOCH on H4/D1, no joke
    Koentjoro flag
    gold ready
    SlowBear ⛅ flag
    Koentjoro
    gold ready
    @Koentjoro Gold is ready, Set and Go! Where are you looking to target?
    Tomasodoma flag
    SlowBear ⛅
    @SlowBear ⛅
    Visxa Benfica flag
    Koentjoro
    gold ready
    @Koentjoro I see many people are expecting gold to return to an upward trend
    Visxa Benfica flag
    @Koentjoro Are you following an uptrend or a downtrend?
    Type here...
    Add Symbol or Code

      No matching data

      All
      Trump Updates
      Recommend
      Stocks
      Cryptocurrencies
      Central Banks
      Featured News
      • All
      • Russia-Ukraine Conflict
      • Middle East Flashpoint
      • All
      • Russia-Ukraine Conflict
      • Middle East Flashpoint
      Search
      Products

      Charts Free Forever

      Chats Q&A with Experts
      Screeners Economic Calendar Data Tools
      Membership Features
      Data Warehouse Market Trends Institutional Data Policy Rates Macro

      Market Trends

      Market Sentiment Order Book Forex Correlations

      Top Indicators

      Charts Free Forever
      Markets

      News

      News Analysis 24/7 Columns Education
      From Institutions From Analysts
      Topics Columnists

      Latest Views

      Latest Views

      Trending Topics

      Top Columnists

      Latest Update

      Signals

      Copy Rankings Latest Signals Become a signal provider AI Rating
      Contests
      Brokers

      Overview Brokers Assessment Rankings Regulators News Claims
      Broker listing Forex Brokers Comparison Tool Live Spread Comparison Scam
      Q&A Complaint Scam Alert Videos Tips to Detect Scam
      More

      Business
      Events
      Careers About Us Advertising Help Center

      White Label

      Broker API

      Data API

      Web Plug-ins

      Affiliate Program

      Awards Institution Evaluation IB Seminar Salon Event Exhibition
      Vietnam Thailand Singapore Dubai
      Fans Party Investment Sharing Session
      FastBull Summit BrokersView Expo
      Recent Searches
        Top Searches
          Markets
          News
          Analysis
          User
          24/7
          Economic Calendar
          Education
          Data
          • Names
          • Latest
          • Prev

          View All

          No data

          Scan to Download

          Faster Charts, Chat Faster!

          Download App
          English
          • English
          • Español
          • العربية
          • Bahasa Indonesia
          • Bahasa Melayu
          • Tiếng Việt
          • ภาษาไทย
          • Français
          • Italiano
          • Türkçe
          • Русский язык
          • 简中
          • 繁中
          Open Account
          Search
          Products
          Charts Free Forever
          Markets
          News
          Signals

          Copy Rankings Latest Signals Become a signal provider AI Rating
          Contests
          Brokers

          Overview Brokers Assessment Rankings Regulators News Claims
          Broker listing Forex Brokers Comparison Tool Live Spread Comparison Scam
          Q&A Complaint Scam Alert Videos Tips to Detect Scam
          More

          Business
          Events
          Careers About Us Advertising Help Center

          White Label

          Broker API

          Data API

          Web Plug-ins

          Affiliate Program

          Awards Institution Evaluation IB Seminar Salon Event Exhibition
          Vietnam Thailand Singapore Dubai
          Fans Party Investment Sharing Session
          FastBull Summit BrokersView Expo

          Trump's US-India Trade Deal: A Global Power Shift?

          King Ten

          Russia-Ukraine Conflict

          Energy

          Remarks of Officials

          Economic

          Political

          Summary:

          Trump announced a landmark US-India trade deal, potentially reshaping India's economy and global geopolitical alignments.

          Donald Trump announced a landmark trade deal between the United States and India on Monday, outlining terms that could significantly reshape economic and geopolitical alignments. While Indian Prime Minister Narendra Modi confirmed an agreement had been reached, he stopped short of validating the specific details Trump shared.

          According to Trump’s statement, the deal involves the U.S. lowering tariffs on Indian imports to 18%, while India would eliminate its tariffs on U.S. imports entirely. He also claimed Modi agreed to cease purchasing Russian oil, replacing it with supplies from the U.S. and potentially Venezuela. Furthermore, Trump said India committed to buying $500 billion in American energy, technology, agricultural goods, and other products.

          However, this announcement warrants caution, as Trump incorrectly claimed late last year that India had already halted Russian oil purchases. If his account of the new deal is accurate this time, the agreement would be truly historic.

          Economic Shockwaves for India's Agricultural Sector

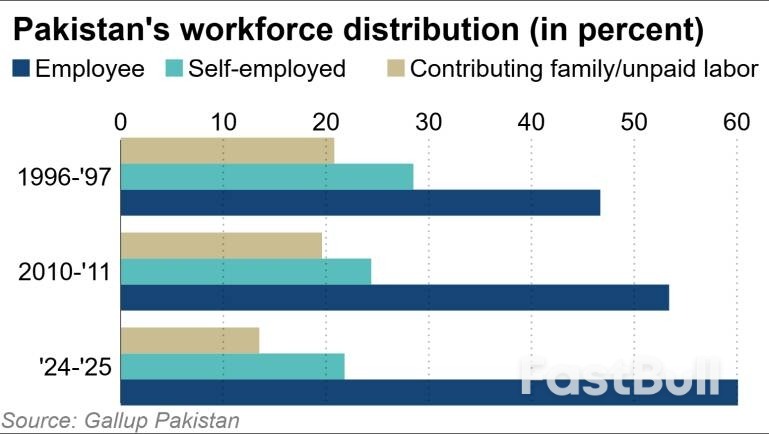
          The potential domestic impact on India could be profound. With 42% of the Indian population employed in agriculture, the arrival of tariff-free U.S. agricultural products could threaten the livelihoods of millions. Such a disruption could trigger a mass migration from rural areas to cities, potentially leading to significant socio-economic turbulence and political unrest if not managed carefully.

          Prime Minister Modi may be calculating that this risk is worth taking. Increased investment from the U.S. and the EU—which secured its own trade deal with India last month—could create new employment opportunities to offset the agricultural displacement. This high-stakes gamble appears to be driven by a combination of macroeconomic ambitions and pressing security concerns.

          Why Modi Might Accept a High-Stakes Gamble

          The motivations behind India's potential concessions seem to be threefold: accelerating economic growth, reasserting regional dominance, and responding to geo-economic pressures.

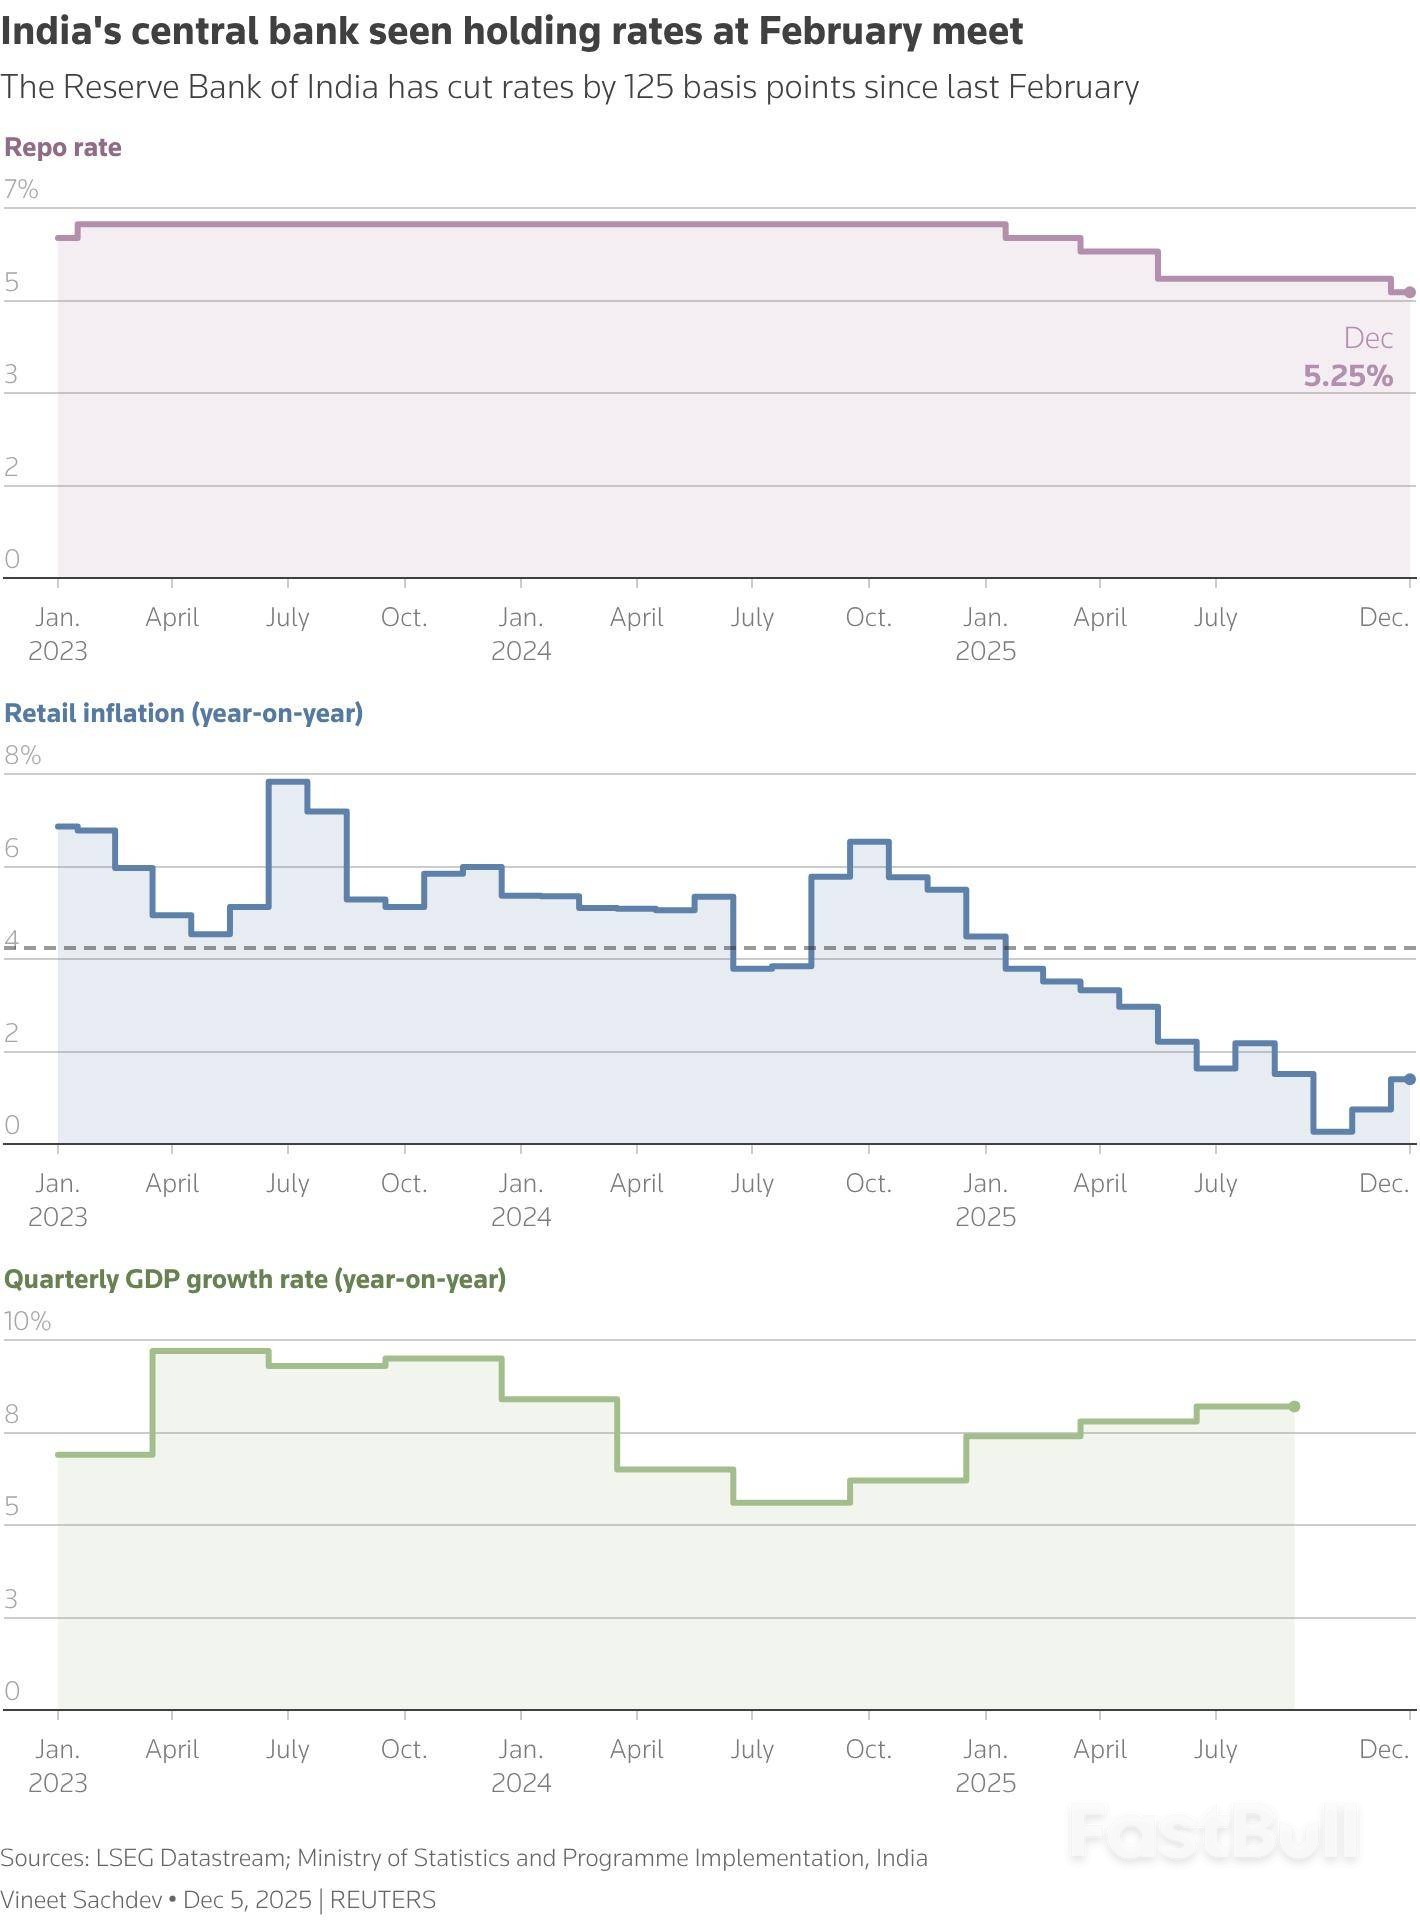
          From a macroeconomic perspective, the deal aims to supercharge India's GDP, which was already projected to grow by 7.4% this year despite existing 50% U.S. tariffs. This could help India achieve its goal of becoming the world's third-largest economy by 2030 or even sooner.

          On the regional security front, the agreement would restore India's status as the primary U.S. partner in South Asia, a position recently challenged by rival Pakistan. This move could preempt a scenario where the U.S. might use Pakistan and its partner Bangladesh to undermine India's rise.

          Geo-economically, India has been navigating a complex landscape. The punitive 25% U.S. tariffs for importing discounted Russian oil are becoming increasingly costly. With the U.S. now offering similarly priced Venezuelan oil as an alternative, the calculus may have shifted. Simultaneously, threatened U.S. sanctions related to business with Iran, coupled with concerns over that country's stability, have made the North-South Transport Corridor through Iran to Russia an unviable option for now. This economic pressure likely pushed India toward prioritizing a deal with the U.S.

          Ripple Effects for Russia, China, and BRICS

          If the details announced by Trump hold true, it signals that India is recalibrating its grand strategy toward the West, largely as a result of economic coercion. This pivot could have several major international implications:

          • A reduced strategic focus on the BRICS alliance.

          • A slowdown in efforts to diversify away from the U.S. dollar.

          • An increase in defense deals with the United States.

          • New challenges in maintaining its recent rapprochement with China.

          The most immediate strategic dilemma would fall on Russia. If India, a major customer, stops importing its discounted oil, Moscow would face a critical choice. To stabilize its budget and the ruble, Russia could either become more dependent on China to absorb its oil exports or agree to difficult compromises with the U.S. over Ukraine in exchange for phased sanctions relief.

          This decision would have the power to dramatically shift the global balance, tilting it further in favor of either China or the United States. Should this Indo-U.S. trade deal force Russia's hand, it will indeed be remembered as a historic turning point.

          To stay updated on all economic events of today, please check out our Economic calendar
          Risk Warnings and Disclaimers
          You understand and acknowledge that there is a high degree of risk involved in trading. Following any strategies or investment methods may lead to potential losses. The content on the site is provided by our contributors and analysts for information purposes only. You are solely responsible for determining whether any trading assets, securities, strategy, or any other product is suitable for investing based on your own investment objectives and financial situation.
          Add to Favorites
          Share

          Why Wall Street is Betting Big on a Stronger Yuan

          Alexander

          Traders' Opinions

          Remarks of Officials

          Economic

          Central Bank

          Forex

          Bank of America has upgraded its forecast for the Chinese yuan, joining a growing consensus among Wall Street firms that Beijing will allow its currency to strengthen further. The move signals rising confidence in the yuan's rally, which has been gaining momentum in recent weeks.

          Other major institutions, including Goldman Sachs, Morgan Stanley, and Australia & New Zealand Banking Group, have also recently revised their yuan estimates upward as the currency's advance accelerates.

          Major Banks Revise Yuan Targets Upward

          Bank of America now projects the onshore yuan will reach 6.7 per U.S. dollar by the end of the third quarter, a notable revision from its previous forecast of 6.8.

          Claudio Piron, head of Asia rates and currency strategy at BofA Global Research, cited "robust exports and firmer policy signals" as key factors behind the new forecast. "The yuan's strength is spilling into broader emerging-market FX gains," he noted.

          Goldman Sachs also sees continued strength, forecasting the yuan will hit 6.80 in six months and 6.70 in twelve months. The bank credits this outlook to greater tolerance from Chinese policymakers and record capital inflows.

          Key Drivers Behind the Currency's Rally

          The yuan's appreciation isn't happening in a vacuum. Several powerful forces are fueling its recent performance:

          • Sustained Capital Inflows: A significant surge in capital flowing into China since last year has provided a strong foundation for the currency.

          • A Weaker U.S. Dollar: Expectations that the United States may favor a weaker dollar have created a favorable environment for the yuan's rise.

          • Support from Beijing: Recent comments from President Xi Jinping, detailed in state media, expressing an ambition for a "powerful currency" have bolstered investor confidence.

          PBOC Signals Tolerance for Appreciation

          Actions from the People's Bank of China (PBOC) have reinforced the bullish sentiment. On Wednesday, the central bank set its daily reference rate for the yuan at its strongest level since May 2023. This followed a move last month where the PBOC raised the "fixing" by the largest margin in over a year.

          The policy signals have translated directly into market performance. This week, the yuan touched its strongest point in nearly three years in both onshore and overseas trading.

          Managing the Risks of a Rapid Rise

          Despite the widespread bullishness, analysts believe the PBOC will aim for a managed and orderly pace of appreciation. A currency that strengthens too quickly could pose risks to China's formidable export engine and attract speculative "hot-money" inflows.

          According to strategists at TD Securities, the central bank could adjust "structural FX parameters" if the yuan's appreciation becomes too sudden. Potential policy tools include:

          • Removing risk reserves on foreign exchange forward sales.

          • Increasing the reserve requirements on foreign exchange.

          These measures would allow the PBOC to moderate the currency's ascent without derailing its overall trajectory.

          To stay updated on all economic events of today, please check out our Economic calendar
          Risk Warnings and Disclaimers
          You understand and acknowledge that there is a high degree of risk involved in trading. Following any strategies or investment methods may lead to potential losses. The content on the site is provided by our contributors and analysts for information purposes only. You are solely responsible for determining whether any trading assets, securities, strategy, or any other product is suitable for investing based on your own investment objectives and financial situation.
          Add to Favorites
          Share

          Doing Business In Pakistan 34% More Expensive Than In Regional Peers

          Winkelmann

          Economic

          The cost of doing business in Pakistan is about one-third higher than in regional peers and the gap appears to be discouraging entrepreneurship and quietly pushing more people toward salaried employment instead of pursuing their own startups, recent private research shows.

          Last month, Pakistan Business Forum (PBF), a national organization representing trade and industry, found that operating a business in the country is 34% costlier than in neighboring South Asian countries. Ahmed Jawad, the PBF's chief organizer, shared the findings with Nikkei Asia in an interview on Friday.

          Jawad said the analysis was based on industrial data available as of December 2025 and that a mix of structural factors is driving the costs. "Fuel taxes remain high, with an additional petroleum development levy of about 80 rupees ($0.28) per liter, while interest rates are around 12.5%, nearly double the 6 to 7% seen in the region," he said.

          He added that electricity expenses average about 34 rupees per unit, compared with a regional average of 17 rupees. The sharp depreciation of Pakistan's currency -- which tumbled from 110.7 rupees per dollar in January 2018 to 280 rupees per dollar in December 2025 -- has made imports far more expensive. "In addition, the overall tax burden can reach up to 55%, significantly higher than in regional economies," he told Nikkei Asia, referring to the effective tax rate for companies.

          Bilal Ghani, executive director of research and consultancy firm Gallup Pakistan, said hat input costs have risen largely because of policy choices that restrict competition. "Trade and industrial policies have often protected domestic producers by restricting imports of cheaper foreign inputs," he told Nikkei. "Instead of allowing firms to access globally competitive inputs, businesses are forced to rely on more expensive local alternatives."

          He further added that Pakistan is perceived as a high-risk jurisdiction due to terrorism, money-laundering concerns, and geopolitical tensions. Therefore, its firms face far more licensing, certification and due diligence requirements than companies in most other developing countries. "[Those] requirements raise the fixed cost of doing business, particularly for exporters and technology firms," he said.

          The costly environment appears to be hurting Pakistan's economy, particularly exports, which have struggled to achieve sustained growth since 2021, as Jawad offering as examples the "hundreds of medium-sized businesses in the textile sector" that have shut down in recent years. "The trade agreement between the European Union and India, which is favorable to India, could further disadvantage Pakistan's textile sector," he added.

          That is Pakistan's largest exporting industry, accounting for around 60% of total overseas shipments in fiscal year 2024. In December last year, the PBF wrote a letter to Prime Minister Shehbaz Sharif, asking the government to address the cost of doing business with concrete measures, including regionally competitive electricity tariffs and more competitive corporate tax rates.

          In addition to the PBF's analysis, Gallup Pakistan released one covering household income and expenditure last month. It shows that salaried employees now account for 60.1% of the workforce, up from 53.4% in fiscal 2010-2011, while self-employment has remained low at 21.8%, down from 24.4% in 2010-2011.

          Ali, a business graduate based in Islamabad who asked that his full name not be used, said he tried to start a restaurant after completing his studies but later abandoned the plan in frustration. "I was hounded by so many government departments that I ultimately decided to give up the idea and started looking for a job," he told Nikkei.

          "The cost of doing business is high, which is pushing more people toward salaried jobs, while bureaucratic hurdles, limited access to finance and ongoing political and economic uncertainty continue to constrain small businesses," Niaz Murtaza, an independent economist based in Islamabad, told Nikkei.

          Ghani, from Gallup, points toward an educational dimension in which the number of salaried workers in Pakistan is increasing. "Entrepreneurship, risk-taking and opportunity recognition were never meaningfully integrated into higher education curricula in Pakistan. Instead, students were socialized to become efficient workers for large firms and multinationals," he added.

          Source: Asia_Nikkei

          To stay updated on all economic events of today, please check out our Economic calendar
          Risk Warnings and Disclaimers
          You understand and acknowledge that there is a high degree of risk involved in trading. Following any strategies or investment methods may lead to potential losses. The content on the site is provided by our contributors and analysts for information purposes only. You are solely responsible for determining whether any trading assets, securities, strategy, or any other product is suitable for investing based on your own investment objectives and financial situation.
          Add to Favorites
          Share

          India’s Trade Pacts With The U.S. And EU Reshape The Winners Across Key Sectors

          Gerik

          Economic

          A Rapid Shift In India’s Trade Position

          India has secured two major trade breakthroughs in quick succession, first finalizing a comprehensive free trade agreement with the European Union and then reaching a pact with the United States that lowers tariffs on Indian exports to 18% from 25%. The U.S. deal, announced by Donald Trump, also includes commitments by India to redirect crude oil purchases away from Russia toward U.S. and potentially Venezuelan supply, alongside pledges to buy up to $500 billion in American agricultural, technology, and energy products.
          While the India-U.S. agreement still lacks the detailed scope of the EU deal, analysts broadly see it as a strategic realignment that improves India’s standing in global trade. The sequencing matters. Several analysts believe the EU agreement prompted Washington to accelerate its own negotiations, bringing India closer to tariff parity with key Southeast Asian peers and improving its relative position compared with China.

          Manufacturing Emerges As The Early Beneficiary

          India’s labor-intensive manufacturing sector is widely viewed as the most immediate winner. Industries spanning textiles, apparel, leather goods, jewelry, toys, and furniture now face a more favorable tariff environment in the U.S. market. The new 18% tariff rate is lower than those applied to regional competitors such as Pakistan, Vietnam, and Bangladesh, restoring some of the cost competitiveness India had lost in recent years.
          This shift is particularly supportive for small and medium-sized manufacturers, which are more sensitive to marginal changes in tariffs. The improved outlook for exporters also supports related sectors, including banks and non-banking financial companies, through stronger credit demand and healthier balance sheets. The relationship here reflects correlation rather than direct causation, as improved trade conditions tend to coincide with stronger domestic sentiment rather than guaranteeing higher earnings in isolation.

          IT Services Gain From Improved Political Relations

          India’s information technology sector stands to benefit less from tariff mechanics and more from improved bilateral relations with the United States. Analysts note that IT services have the largest exposure to the U.S. market, and while the trade deal primarily targets manufactured goods, the broader diplomatic reset may reduce regulatory scrutiny and the risk of punitive measures such as additional taxes.
          This dynamic does not directly increase demand for IT services but lowers policy-related uncertainty, which has weighed on valuations. As a result, analysts see scope for a tactical rebound in Indian equities driven by financials, IT, and telecoms, with trade-linked stocks also recovering as confidence improves.

          Pharmaceuticals Poised For Structural Gains From The EU Deal

          The free trade agreement between India and the EU, described by European Commission President Ursula von der Leyen as “the mother of all deals,” carries particularly strong implications for India’s pharmaceutical sector. The agreement eliminates tariffs of up to 11% on EU drug imports, including cancer treatments, biologics, and GLP-1 therapies, which totaled $1.2 billion in 2024.
          Lower import costs and smoother supply chains underpin a positive long-term outlook. Research from Fitch Ratings’ BMI unit projects India’s pharmaceutical market to expand from $31.2 billion in 2025 to $45.7 billion by 2035, implying a 10-year compound annual growth rate of 5.2% in local currency terms. Beyond cost savings, the deal is expected to align regulatory processes, shorten approval timelines, and reduce administrative burdens, helping Indian drug exports recover from recent stagnation.

          Market Reaction And Investor Sentiment

          Equity markets have responded positively to the twin trade announcements. The Sensex rose 2.5% following the U.S. deal, reflecting renewed optimism that tariff uncertainty had been constraining valuations. UK-listed investment trusts with significant India exposure, such as Ashoka India Equity Investment Trust, also recorded strong gains, signaling international investor confidence.
          The rally suggests improved clarity rather than a guaranteed earnings surge. Investors are now assessing whether these agreements mark a structural turning point for India’s growth trajectory or merely trigger a short-term relief rally after prolonged trade-related headwinds.

          A Strategic Repositioning Rather Than An Overnight Shift

          Taken together, the U.S. and EU trade deals reposition India more favorably within the global trading system. Manufacturing competitiveness improves relative to regional peers, pharmaceuticals gain long-term structural support, and IT services benefit indirectly from a thaw in political relations. However, the impact will unfold over time and vary by sector, shaped by execution, regulatory follow-through, and global demand conditions.
          For now, analysts see the agreements as removing a key constraint on India’s markets rather than delivering an immediate growth windfall, creating conditions for recovery rather than guaranteeing it.

          Source: CNBC

          To stay updated on all economic events of today, please check out our Economic calendar
          Risk Warnings and Disclaimers
          You understand and acknowledge that there is a high degree of risk involved in trading. Following any strategies or investment methods may lead to potential losses. The content on the site is provided by our contributors and analysts for information purposes only. You are solely responsible for determining whether any trading assets, securities, strategy, or any other product is suitable for investing based on your own investment objectives and financial situation.
          Add to Favorites
          Share

          Gold Rebounds Sharply on Weaker Dollar, Bargain Hunting

          John Adams

          Traders' Opinions

          Remarks of Officials

          Data Interpretation

          Economic

          Central Bank

          Forex

          Commodity

          Daily News

          Gold prices surged over 2% on February 4, extending a powerful rally that began the previous day with the metal's best performance since 2008. The move was driven by a combination of bargain hunting and a softer U.S. dollar, which made bullion more attractive to international buyers.

          As of 9:12 a.m. Singapore time, spot gold was trading 2.2% higher at US$5,044.74 per ounce. This followed a massive 5.9% gain on February 3, its largest single-day jump since November 2008. The precious metal had previously hit a record high of US$5,594.82 on February 29.

          Dollar Weakness Provides Key Support

          A key factor fueling gold's recovery was the U.S. dollar, which fell against most major currencies on February 3. Traders appeared to be consolidating recent gains in the greenback, which had been powered by strong U.S. economic data and expectations of a less dovish Federal Reserve after President Donald Trump nominated Kevin Warsh as its next chair. A weaker dollar makes gold, which is priced in dollars, more affordable for investors holding other currencies.

          According to Daniel Ghali, a senior commodity strategist at TD Securities, the recent wave of forced selling in precious metals has likely concluded. However, he cautioned that the market's recent turbulence could deter retail investors.

          "The intense volatility over the last week could certainly keep retail participants on the sidelines, removing an increasingly important cohort of buyers," Ghali noted.

          Volatility Persists After Market Whiplash

          The latest price action comes after a period of extreme volatility. In January, precious metals soared on speculative momentum, geopolitical tensions, and concerns over the independence of the Federal Reserve.

          However, many market watchers warned that the rally was too large and too fast. This sentiment proved correct when the surge abruptly ended late last week. Gold experienced its most significant plunge since 2013, while silver suffered its biggest daily drop on record.

          Analysts at Bank of America expect this elevated volatility in precious metals to continue. Niklas Westermark, the bank's head of EMEA commodities trading, stated that gold possesses a stronger long-term investment case than silver. He added that while market turmoil might influence position sizing, it is unlikely to diminish overall investor appetite for gold.

          Banks Maintain Bullish Long-Term Outlook

          Despite the recent turbulence, many major financial institutions remain confident in gold's long-term prospects. On February 2, Deutsche Bank reiterated its forecast that bullion will eventually rally to US$6,000 an ounce, signaling that the fundamental drivers for the precious metal remain intact.

          To stay updated on all economic events of today, please check out our Economic calendar
          Risk Warnings and Disclaimers
          You understand and acknowledge that there is a high degree of risk involved in trading. Following any strategies or investment methods may lead to potential losses. The content on the site is provided by our contributors and analysts for information purposes only. You are solely responsible for determining whether any trading assets, securities, strategy, or any other product is suitable for investing based on your own investment objectives and financial situation.
          Add to Favorites
          Share

          India's RBI to Hold Rates, Shift Focus to Transmission

          Nathaniel Wright

          Remarks of Officials

          Data Interpretation

          Economic

          Central Bank

          Daily News

          Bond

          The Reserve Bank of India (RBI) is widely expected to hold its key interest rate steady on Friday, shifting its focus from further cuts to ensuring its previous monetary easing effectively filters through the economy. A new U.S.–India trade deal has eased immediate pressure on the central bank to provide more stimulus.

          A Reuters poll conducted before the trade deal was announced showed a strong consensus, with 59 of 70 economists anticipating no change in rates. While a minority had called for another cut due to low inflation and U.S. tariff risks, the trade agreement has reinforced the case for a policy pause.

          Dhiraj Nim, an economist at ANZ Bank, noted, "The U.S.-India trade deal further bolsters the case for the RBI keeping rates unchanged this week."

          Since last February, the RBI has already cut its policy repo rate by a total of 125 basis points, bringing it down to 5.25%.

          A "Goldilocks" Economy Supports Stability

          The decision to hold rates is supported by India's strong economic performance. RBI Governor Sanjay Malhotra described the economy as being in a "Goldilocks phase" at the last policy meeting in December.

          Official forecasts reflect this optimism:

          • GDP growth is projected to hit 7.4% in the current financial year.

          • The government's economic adviser anticipates growth between 6.8% and 7.2% for the next fiscal year.

          • The RBI’s own forecast for the fiscal year ending March 31 was 7.3% growth with CPI inflation at 2%.

          Figure 1: Projections for India's key economic indicators show a declining repo rate alongside stabilizing inflation and robust GDP growth through 2025.

          This backdrop of steady growth and controlled inflation gives the central bank room to observe the impact of its past actions.

          The Challenge of Policy Transmission

          Despite the aggressive rate cuts over the past year, the benefits have not fully reached borrowers. The primary challenge for the RBI is now "policy transmission"—ensuring its lower rates translate into lower funding costs across the financial system.

          A key indicator of this disconnect is the benchmark 10-year government bond yield, which has barely fallen. This yield serves as a reference for pricing corporate and bank loans, and its stickiness has kept borrowing costs high, limiting the economic boost from the RBI's easing.

          "The challenge now is to ensure that transmission of previous rate cuts is not hampered, while the central bank remains on an extended pause," said Kaushik Das, chief economist for India, Malaysia, and South Asia at Deutsche Bank.

          Figure 2: The spread between India's 10-year bond yield and the RBI's repo rate has widened significantly, indicating that central bank rate cuts are not being fully passed through to the broader market.

          Market Pressures and the RBI's Next Move

          The bond market has been under significant pressure from multiple fronts. To manage foreign capital outflows from equity markets prior to the trade deal, the RBI sold $30 billion from its foreign exchange reserves between September and November. This intervention drained rupee liquidity from the system, adding to the strain on bond markets already grappling with record government borrowings.

          To counter these pressures and improve policy transmission, analysts expect the RBI to increase its open market bond purchases by at least 1 trillion rupees ($10.92 billion). This move would inject liquidity into the market, ease the strain, and help bring down yields.

          The need for RBI support has grown more urgent following the announcement of a higher-than-expected government borrowing program for the upcoming fiscal year. As economists at Nomura stated, "Higher market borrowing numbers mean concerns around bond supply will remain a challenge for policy transmission."

          To stay updated on all economic events of today, please check out our Economic calendar
          Risk Warnings and Disclaimers
          You understand and acknowledge that there is a high degree of risk involved in trading. Following any strategies or investment methods may lead to potential losses. The content on the site is provided by our contributors and analysts for information purposes only. You are solely responsible for determining whether any trading assets, securities, strategy, or any other product is suitable for investing based on your own investment objectives and financial situation.
          Add to Favorites
          Share

          Gold Breaks $5,000 As Asia Equities Stumble On Tech-Led Wall Street Retreat

          Gerik

          Economic

          Stocks

          Tech Weakness In The US Sets The Tone

          Market sentiment across Asia weakened after a technology-driven sell-off on Wall Street overnight. The retreat followed a broad rotation out of high-growth tech names, pushing the Nasdaq Composite down 1.43 percent, while the S&P 500 fell 0.84 percent and the Dow Jones Industrial Average slipped 0.34 percent. Investors appeared to reallocate capital toward sectors more closely linked to near-term economic resilience, reflecting caution rather than outright risk aversion.
          The sell-off was concentrated in technology, with software stocks continuing a pronounced decline into 2026. Shares of Salesforce and ServiceNow both dropped sharply, reinforcing concerns that elevated valuations remain vulnerable as earnings momentum softens.

          Asia Markets Track The Downturn Unevenly

          In Asia, Japan bore the brunt of the negative spillover. The Nikkei 225 fell 1.2 percent, dragged lower by technology and semiconductor-related names. Losses in companies such as Lasertec, Konami Group, and Tokyo Electron underscored the sensitivity of Japan’s market to global tech cycles. The broader Topix index also declined, though to a lesser extent, suggesting the weakness was concentrated rather than systemic.
          Elsewhere, performance was more mixed. Australia’s S&P/ASX 200 reversed earlier losses to close higher, supported by gains in sectors less exposed to global tech volatility. South Korea’s KOSPI and its small-cap Kosdaq both advanced, indicating selective risk appetite in markets tied to domestic growth and manufacturing.
          In Greater China, sentiment remained cautious. The Hang Seng Index edged lower, while mainland China’s CSI 300 slipped modestly, reflecting ongoing uncertainty around global demand and capital flows rather than a clear deterioration in local fundamentals.

          Stock-Specific Pressures Add To Volatility

          Individual company moves also contributed to uneven market performance. Shares of Nintendo plunged more than 9 percent despite the firm maintaining its full-year sales forecast for the upcoming Switch 2 console. Investor concerns centered on rising memory prices, a key input cost for gaming hardware, highlighting how input inflation can outweigh stable revenue guidance in shaping equity valuations.
          This reaction illustrates a correlation between cost pressures and equity repricing rather than a direct causal link to earnings outlook alone, as markets increasingly focus on margin sustainability.

          Gold’s Breakout Signals Defensive Positioning

          While equities struggled, precious metals extended their rally. Spot gold rose more than 1 percent to around $5,002 per ounce, decisively breaking above the psychologically important $5,000 level, while silver also advanced. The move reflects growing demand for safe-haven assets as investors respond to equity volatility, softer growth expectations, and lingering geopolitical and monetary policy uncertainty.
          The surge in gold prices suggests a defensive tilt in global portfolios. Rather than indicating panic, the shift points to a gradual rebalancing away from risk-heavy assets toward stores of value, driven by correlation between market uncertainty and hedging behavior.
          Looking ahead, Asian equities are likely to remain sensitive to developments in US technology stocks and broader risk sentiment. If the tech pullback deepens, markets with heavy exposure to semiconductors and software could face further pressure. At the same time, the strength in gold highlights persistent demand for protection against volatility, suggesting that caution, rather than confidence, continues to shape global investor behavior.

          Source: CNBC

          To stay updated on all economic events of today, please check out our Economic calendar
          Risk Warnings and Disclaimers
          You understand and acknowledge that there is a high degree of risk involved in trading. Following any strategies or investment methods may lead to potential losses. The content on the site is provided by our contributors and analysts for information purposes only. You are solely responsible for determining whether any trading assets, securities, strategy, or any other product is suitable for investing based on your own investment objectives and financial situation.
          Add to Favorites
          Share
          FastBull
          Copyright © 2026 FastBull Ltd

          728 RM B 7/F GEE LOK IND BLDG NO 34 HUNG TO RD KWUN TONG KLN HONG KONG

          TelegramInstagramTwitterfacebooklinkedin
          App Store Google Play Google Play
          Products
          Charts

          Chats

          Q&A with Experts
          Screeners
          Economic Calendar
          Data
          Tools
          Membership
          Features
          Function
          Markets
          Copy Trading
          Latest Signals
          Contests
          News
          Analysis
          24/7
          Columns
          Education
          Company
          Careers
          About Us
          Contact Us
          Advertising
          Help Center
          Feedback
          User Agreement
          Privacy Policy
          Personal Information Protection Statement
          Business

          White Label

          Broker API

          Data API

          Web Plug-ins

          Poster Maker

          Affiliate Program

          Risk Disclosure

          The risk of loss in trading financial instruments such as stocks, FX, commodities, futures, bonds, ETFs and crypto can be substantial. You may sustain a total loss of the funds that you deposit with your broker. Therefore, you should carefully consider whether such trading is suitable for you in light of your circumstances and financial resources.

          No decision to invest should be made without thoroughly conducting due diligence by yourself or consulting with your financial advisors. Our web content might not suit you since we don't know your financial conditions and investment needs. Our financial information might have latency or contain inaccuracy, so you should be fully responsible for any of your trading and investment decisions. The company will not be responsible for your capital loss.

          Without getting permission from the website, you are not allowed to copy the website's graphics, texts, or trademarks. Intellectual property rights in the content or data incorporated into this website belong to its providers and exchange merchants.

          Not Logged In

          Log in to access more features

          Connect Broker
          Become a signal provider
          Help Center
          Customer Service
          Dark Mode
          Price Up/Down Colors

          Log In

          Sign Up

          Position
          Layout
          Fullscreen
          Default to Chart
          The chart page opens by default when you visit fastbull.com