- WTI
- XAUUSD
- XAGUSD
- USDX
Markets
Analysis
User
24/7
Economic Calendar
Education
Data
- Names
- Latest
- Prev


Signal Accounts for Members
All Signal Accounts
All Contests


The PTA Main Contract Fell 5.00% Intraday, Currently Trading At 6014.00 Yuan/ton. The Staple Fiber Main Contract Fell Below 7500 Yuan/ton, Down 3.80% Intraday. The Ethylene Glycol Main Contract Fell 4.00% Intraday, Currently Trading At 4459.00 Yuan/ton
The Most Active Shanghai Tin Futures Contract Surged 4.00% Intraday, Currently Trading At 422,690.00 Yuan/ton. The Most Active Container Shipping Index (Europe Route) Contract Fell 4.00% Intraday, Currently Trading At 3751.5 Points
The Methanol Futures Contract Fell 6.00% Intraday, Currently Trading At 2841.00 Yuan/ton. The Polypropylene (PP) Futures Contract Fell 4.00% Intraday, Currently Trading At 8290.00 Yuan/ton
Japanese Prime Minister Sanae Takaichi: I Hope The Memorandum Will Be Implemented Steadily, That Freedom And Safe Navigation Through The Strait Of Hormuz Will Be Effectively Guaranteed, And That A Final Agreement Will Be Reached As Soon As Possible On The Iranian Nuclear Issue And Other Outstanding Matters
The Most Active Japanese Rubber Futures Contract Rose More Than 2.00% Intraday, Currently Trading At 434.70 Yen Per Kilogram
Media: Israeli Strike On Lebanon Accelerates Trump's Agreement To Lift Maritime Blockade On Iran
[ZEC Leads Surge Again, Surpassing $470] June 15th, According To Market Data, ZEC Quickly Rebounded, Breaking Through $470 And Is Now Trading At $472.85, Representing A 24-hour Gain Of 12.4%
Commonwealth Bank Of Australia: Energy Prices Will Not Return To Pre-war Levels For A Long Time
A Spokesperson For The UN Secretary-General Issued A Statement On The 14th, Saying That Secretary-General Guterres Welcomed The Agreement Reached Between The United States And Iran On A Peace Deal

Russia Trade Balance (Apr)A:--
F: --
P: --
U.S. EIA Weekly Natural Gas Stocks ChangeA:--
F: --
P: --
Argentina CPI MoM (May)A:--
F: --
P: --
U.S. Weekly Treasuries Held by Foreign Central BanksA:--
F: --
P: --
U.K. Construction Output YoY (Apr)A:--
F: --
P: --
U.K. GDP YoY (SA) (Apr)A:--
F: --
P: --
U.K. Services Index MoMA:--
F: --
P: --
U.K. Trade Balance EU (SA) (Apr)A:--
F: --
P: --
U.K. Industrial Output MoM (Apr)A:--
F: --
P: --
U.K. Manufacturing Output MoM (Apr)A:--
F: --
P: --
U.K. Monthly GDP 3M/3M Change (Apr)A:--
F: --
P: --
U.K. Trade Balance Non-EU (SA) (Apr)A:--
F: --
P: --
U.K. Trade Balance (Apr)A:--
F: --
P: --
U.K. Construction Output MoM (SA) (Apr)A:--
F: --
P: --
U.K. Industrial Output YoY (Apr)A:--
F: --
P: --
U.K. Trade Balance (SA) (Apr)A:--
F: --
P: --
U.K. Manufacturing Output YoY (Apr)A:--
F: --
P: --
U.K. GDP MoM (Apr)A:--
F: --
P: --
France HICP Final MoM (May)A:--
F: --
P: --
U.K. Inflation Rate ExpectationsA:--
F: --
P: --
China, Mainland Outstanding Loans Growth YoY (May)A:--
F: --
P: --
China, Mainland M2 Money Supply YoY (May)A:--
F: --
P: --
China, Mainland M1 Money Supply YoY (May)A:--
F: --
P: --
China, Mainland M0 Money Supply YoY (May)A:--
F: --
P: --
India CPI YoY (May)A:--
F: --
P: --
India Deposit Gowth YoYA:--
F: --
P: --
Brazil CPI YoY (May)A:--
F: --
P: --
U.S. 5-10 Year-Ahead Inflation Expectations (Jun)A:--
F: --
P: --
U.S. Weekly Total Rig CountA:--
F: --
P: --
U.S. Weekly Total Oil Rig CountA:--
F: --
P: --
Saudi Arabia CPI YoY (May)--
F: --
P: --
ECB President Lagarde Speaks
Euro Zone Industrial Output YoY (Apr)--
F: --
P: --
Euro Zone Trade Balance (Not SA) (Apr)--
F: --
P: --
Euro Zone Trade Balance (SA) (Apr)--
F: --
P: --
Euro Zone Industrial Output MoM (Apr)--
F: --
P: --
Euro Zone Total Reserve Assets (May)--
F: --
P: --
Canada National Economic Confidence Index--
F: --
P: --
Canada New Housing Starts (May)--
F: --
P: --
Canada Manufacturing New Orders MoM (Apr)--
F: --
P: --
Canada Manufacturing Unfilled Orders MoM (Apr)--
F: --
P: --
U.S. NY Fed Manufacturing Employment Index (Jun)--
F: --
P: --
U.S. NY Fed Manufacturing New Orders Index (Jun)--
F: --
P: --
U.S. NY Fed Manufacturing Prices Received Index (Jun)--
F: --
P: --
Canada Wholesale Inventory MoM (Apr)--
F: --
P: --
Canada Wholesale Sales YoY (Apr)--
F: --
P: --
Canada Manufacturing Inventory MoM (Apr)--
F: --
P: --
Canada Wholesale Inventory YoY (Apr)--
F: --
P: --
Canada Wholesale Sales MoM (SA) (Apr)--
F: --
P: --
U.S. NY Fed Manufacturing Index (Jun)--
F: --
P: --
U.S. Industrial Output MoM (SA) (May)--
F: --
P: --
U.S. Capacity Utilization MoM (SA) (May)--
F: --
P: --
U.S. Manufacturing Output MoM (SA) (May)--
F: --
P: --
U.S. Industrial Output YoY (May)--
F: --
P: --
U.S. Manufacturing Capacity Utilization (May)--
F: --
P: --
U.S. NAHB Housing Market Index (Jun)--
F: --
P: --
U.K. Rightmove House Price Index YoY (Jun)--
F: --
P: --
China, Mainland Urban Area Unemployment Rate (May)--
F: --
P: --
China, Mainland Industrial Output YoY (YTD) (May)--
F: --
P: --
Japan Benchmark Interest Rate--
F: --
P: --
BOJ Monetary Policy Statement


No matching data
USDt added $12.4 billion in Q4 to reach a $187.3 billion market cap, increasing users and onchain activity even as rival stablecoins declined after October’s liquidation event.
Tether's dollar-pegged stablecoin USDt expanded to a record $187.3 billion market capitalization in the fourth quarter of 2025, even as the broader crypto market slid following October's liquidation cascade.
According to its latest quarterly report, the USDt (USDT) market cap grew by $12.4 billion in Q4.
Data shows that USDt has been widening its dominance while competitors retreated.
After the major liquidation event on Oct. 10, the market cap of Circle's USDC (USDC), the second-largest stablecoin, fluctuated throughout the rest of Q4 but closed the period largely unchanged. Ethena's synthetic dollar USDe, ranked third among stablecoins at CoinMarketCap, dropped by 57%.
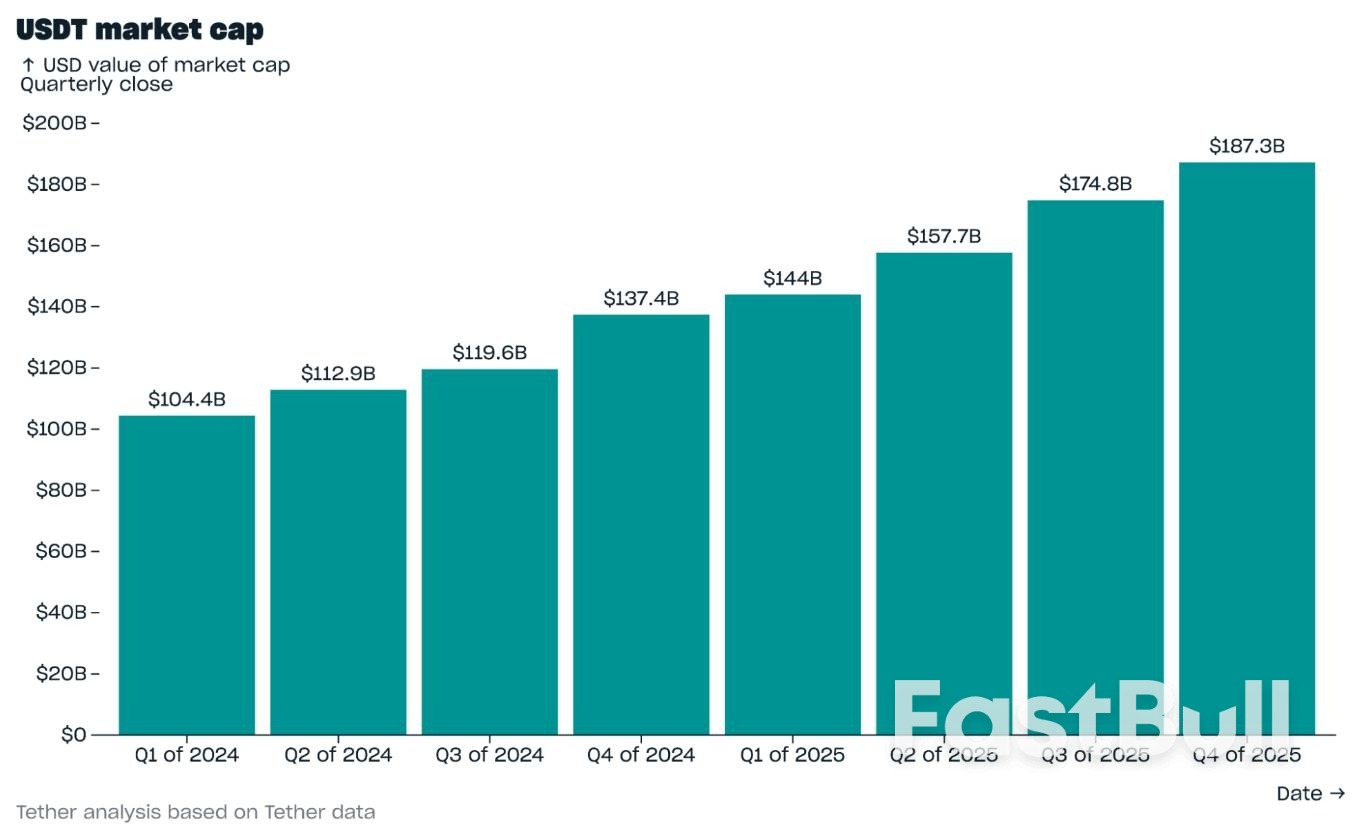
USDt market cap. Source: TetherOnchain activity also reached new highs. The average number of monthly active USDt wallets climbed to 24.8 million, representing almost 70% of all stablecoin-holding wallets. Quarterly transfer volume surged to $4.4 trillion, while the number of onchain transfers rose to 2.2 billion.
Furthermore, Tether reported total reserves of $192.9 billion at the end of Q4, up $11.7 billion from the previous quarter, leaving net equity of $6.3 billion. Its exposure to US Treasuries increased to $141.6 billion, placing it among the biggest holders globally and ahead of several sovereign nations.
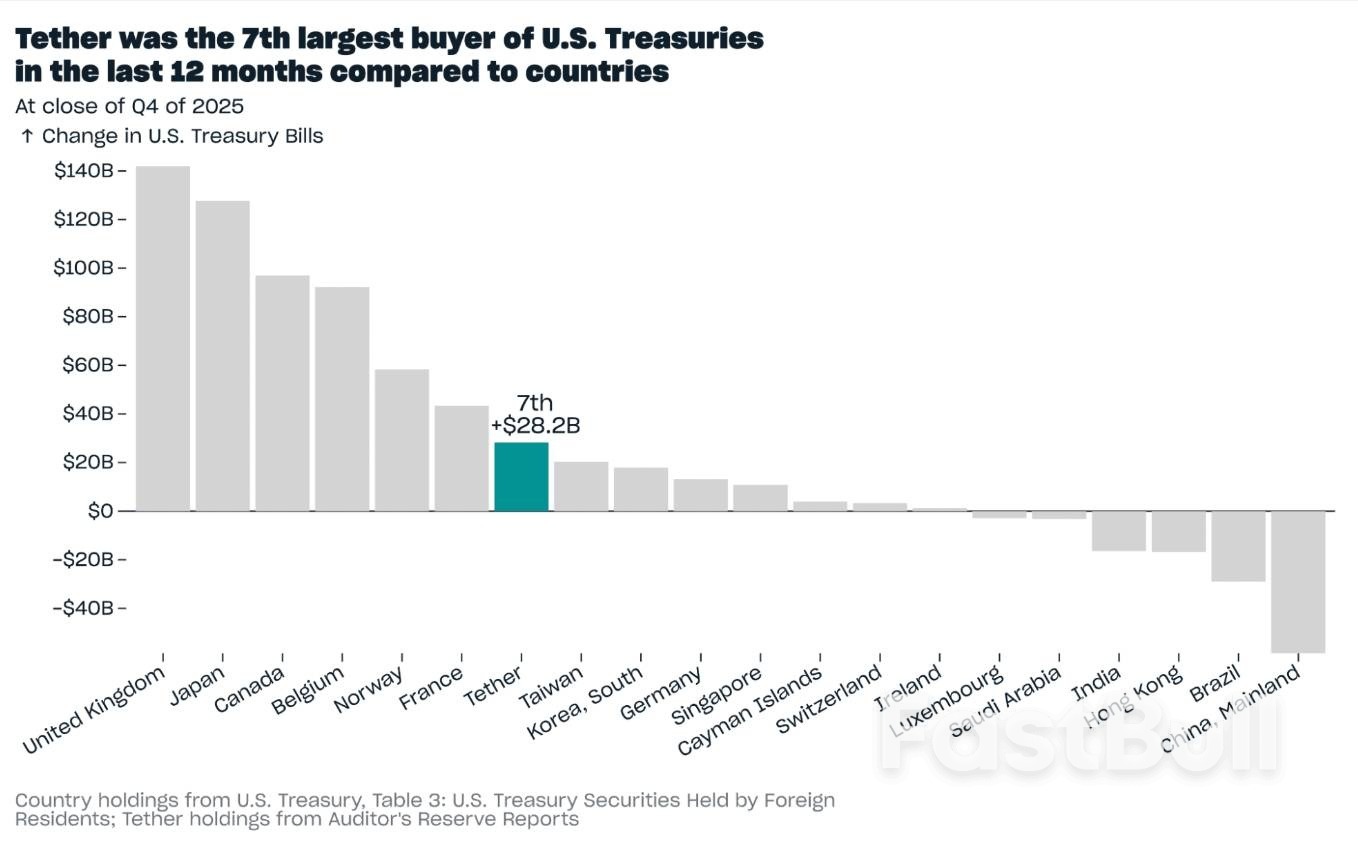
Tether buys more US Treasuries. Source: TetherThe data also points to a relatively stable user base. About two-thirds of USDt supply is held in savings wallets and centralized exchanges, while the remaining third supports activities tied to payments, remittances and decentralized finance.
USDt is also the most commonly used stablecoin in illicit transfers. Bitrace reported that $649 billion in stablecoins, or about 5.14% of total stablecoin transaction volume, flowed through high-risk blockchain addresses in 2024, with Tron-based USDt accounting for more than 70% of the activity.
Tether has stepped up efforts to curb illicit use, launching collaborative programs with TRM Labs and Tron to monitor and freeze illicit funds.
In January, Tether launched USAt, a dollar-pegged stablecoin built specifically for the US market. Issued by Anchorage Digital Bank, USAt is a stablecoin compliant with the US GENIUS Act, with $10 million initial supply on Ethereum.
On Monday, Tether and Opera partnered to broaden access to digital payments in emerging markets by integrating USDt and Tether Gold (XAUT) into Opera's MiniPay wallet.
The risk of loss in trading financial instruments such as stocks, FX, commodities, futures, bonds, ETFs and crypto can be substantial. You may sustain a total loss of the funds that you deposit with your broker. Therefore, you should carefully consider whether such trading is suitable for you in light of your circumstances and financial resources.
No decision to invest should be made without thoroughly conducting due diligence by yourself or consulting with your financial advisors. Our web content might not suit you since we don't know your financial conditions and investment needs. Our financial information might have latency or contain inaccuracy, so you should be fully responsible for any of your trading and investment decisions. The company will not be responsible for your capital loss.
Without getting permission from the website, you are not allowed to copy the website's graphics, texts, or trademarks. Intellectual property rights in the content or data incorporated into this website belong to its providers and exchange merchants.
Not Logged In
Log in to access more features
Log In
Sign Up