• Trade
  • Markets
  • Copy
  • Contests
  • News
  • 24/7
  • Calendar
  • Q&A
  • Chats
Screeners
SYMBOL
LAST
ASK
BID
HIGH
LOW
NET CHG.
%CHG.
SPREAD
SPX
S&P 500 Index
6950.22
6950.22
6950.22
6964.65
6921.61
+34.61
+ 0.50%
--
DJI
Dow Jones Industrial Average
49412.39
49412.39
49412.39
49488.81
49137.65
+313.69
+ 0.64%
--
IXIC
NASDAQ Composite Index
23601.35
23601.35
23601.35
23688.94
23486.08
+100.11
+ 0.43%
--
USDX
US Dollar Index
97.020
97.100
97.020
97.060
96.710
+0.190
+ 0.20%
--
EURUSD
Euro / US Dollar
1.18556
1.18563
1.18556
1.18991
1.18502
-0.00237
-0.20%
--
GBPUSD
Pound Sterling / US Dollar
1.36677
1.36684
1.36677
1.37003
1.36636
-0.00103
-0.08%
--
XAUUSD
Gold / US Dollar
5081.43
5081.77
5081.43
5100.65
5013.05
+71.16
+ 1.42%
--
WTI
Light Sweet Crude Oil
60.203
60.233
60.203
60.755
60.054
-0.545
-0.90%
--

Community Accounts

Signal Accounts
--
Profit Accounts
--
Loss Accounts
--
View More

Become a signal provider

Sell trading signals to earn additional income

View More

Guide to Copy Trading

Get started with ease and confidence

View More

Signal Accounts for Members

All Signal Accounts

Best Return
  • Best Return
  • Best P/L
  • Best MDD
Past 1W
  • Past 1W
  • Past 1M
  • Past 1Y

All Contests

  • All
  • Trump Updates
  • Recommend
  • Stocks
  • Cryptocurrencies
  • Central Banks
  • Featured News
Top News Only
Share

BOE Governor Bailey Sees 'Urgent Need' To Boost Resilience Of Market-Based Finance

Share

Deutsche Bank: "We Think $6000/Oz Is Achievable With A Weaker Dollar This Year"

Share

South Korea: USA Letter Not Directly Related To Trump's Announcement On Tariffs

Share

Statement: Zambia's 2025 Copper Production At 890346 Metric Tons

Share

Indian Refiners Say Offers Of Venezuelan Oil Limited, Most Going To US

Share

South Korea's Blue House: Have Received Letter From USA Asking Not To Discriminate Against USA Companies On Digital Matters

Share

Russia's Central Bank: Inflationary Expectations Among Households At 13.7% In January Versus 13.7% In December

Share

European Commission President Ursula Von Der Leyen: In A Context Of Trade Being "weaponized," The EU-India Free Trade Agreement Will Help Reduce Its Strategic Dependence

Share

Gail Cmd: More Natural Gas Availability Is Expected, Will Help India

Share

Hong Kong December Exports +26.1 Percent From A Year Earlier

Share

Hong Kong December Imports +30.6 Percent From A Year Earlier

Share

Romanian Broad Money (M3) At End-December At 795408 Million Lei, Up 7.2% Year-On-Year

Share

Russian Human Rights Commissioner: Russia And Ukraine Are Currently In Active Dialogue Regarding The Number Of Prisoners To Be Exchanged And Other Details

Share

Ukraine Grain Exports As Of January 26

Share

Indian Prime Minister Modi: We Need To Reform Global Institutions

Share

Indian Prime Minister Modi: Both India And The EU Believe In Multilateralism

Share

Indian Prime Minister Modi: Today We Discussed The Situation In Ukraine, West Asia, And The Indo-Pacific Region

Share

Spain's Quarterly Unemployment Rate Dips Below 10% For First Time In 18 Years

Share

India - EU: Costa Says Taking Partnership To Next Level

Share

India - EU: Modi Says Cooperation To Strengthen Global Order

TIME
ACT
FCST
PREV
U.S. IHS Markit Manufacturing PMI Prelim (SA) (Jan)

A:--

F: --

P: --

U.S. IHS Markit Services PMI Prelim (SA) (Jan)

A:--

F: --

P: --

U.S. IHS Markit Composite PMI Prelim (SA) (Jan)

A:--

F: --

P: --

U.S. UMich Consumer Sentiment Index Final (Jan)

A:--

F: --

P: --

U.S. UMich Current Economic Conditions Index Final (Jan)

A:--

F: --

P: --

U.S. UMich Consumer Expectations Index Final (Jan)

A:--

F: --

P: --

U.S. Conference Board Leading Economic Index MoM (Nov)

A:--

F: --

P: --

U.S. Conference Board Coincident Economic Index MoM (Nov)

A:--

F: --

P: --

U.S. Conference Board Lagging Economic Index MoM (Nov)

A:--

F: --

P: --

U.S. UMich 1-Year-Ahead Inflation Expectations Final (Jan)

A:--

F: --

P: --

U.S. Conference Board Leading Economic Index (Nov)

A:--

F: --

P: --

U.S. Weekly Total Rig Count

A:--

F: --

P: --

U.S. Weekly Total Oil Rig Count

A:--

F: --

P: --

Japanese Prime Minister Sanae Takaichi delivers a speech
Germany Ifo Business Expectations Index (SA) (Jan)

A:--

F: --

P: --

Germany IFO Business Climate Index (SA) (Jan)

A:--

F: --

P: --

Germany Ifo Current Business Situation Index (SA) (Jan)

A:--

F: --

P: --

Brazil Current Account (Dec)

A:--

F: --

P: --

Mexico Unemployment Rate (Not SA) (Dec)

A:--

F: --

P: --

Canada National Economic Confidence Index

A:--

F: --

P: --

U.S. Non-Defense Capital Durable Goods Orders MoM (Excl. Aircraft) (Nov)

A:--

F: --

P: --
U.S. Durable Goods Orders MoM (Excl. Defense) (SA) (Nov)

A:--

F: --

P: --
U.S. Durable Goods Orders MoM (Excl.Transport) (Nov)

A:--

F: --

P: --

U.S. Durable Goods Orders MoM (Nov)

A:--

F: --

P: --
U.S. Chicago Fed National Activity Index (Nov)

A:--

F: --

P: --
U.S. Dallas Fed New Orders Index (Jan)

A:--

F: --

P: --

U.S. Dallas Fed General Business Activity Index (Jan)

A:--

F: --

P: --
U.S. 2-Year Note Auction Avg. Yield

A:--

F: --

P: --

U.K. BRC Shop Price Index YoY (Jan)

A:--

F: --

P: --

China, Mainland Industrial Profit YoY (YTD) (Dec)

A:--

F: --

P: --

Germany 2-Year Schatz Auction Avg. Yield

--

F: --

P: --

Mexico Trade Balance (Dec)

--

F: --

P: --

U.S. Weekly Redbook Index YoY

--

F: --

P: --

U.S. S&P/CS 20-City Home Price Index YoY (Not SA) (Nov)

--

F: --

P: --

U.S. S&P/CS 20-City Home Price Index MoM (SA) (Nov)

--

F: --

P: --

U.S. FHFA House Price Index MoM (Nov)

--

F: --

P: --

U.S. FHFA House Price Index (Nov)

--

F: --

P: --

U.S. FHFA House Price Index YoY (Nov)

--

F: --

P: --

U.S. S&P/CS 10-City Home Price Index YoY (Nov)

--

F: --

P: --

U.S. S&P/CS 10-City Home Price Index MoM (Not SA) (Nov)

--

F: --

P: --

U.S. S&P/CS 20-City Home Price Index (Not SA) (Nov)

--

F: --

P: --

U.S. S&P/CS 20-City Home Price Index MoM (Not SA) (Nov)

--

F: --

P: --

U.S. Richmond Fed Manufacturing Composite Index (Jan)

--

F: --

P: --

U.S. Conference Board Present Situation Index (Jan)

--

F: --

P: --

U.S. Conference Board Consumer Expectations Index (Jan)

--

F: --

P: --

U.S. Richmond Fed Manufacturing Shipments Index (Jan)

--

F: --

P: --

U.S. Richmond Fed Services Revenue Index (Jan)

--

F: --

P: --

U.S. Conference Board Consumer Confidence Index (Jan)

--

F: --

P: --

U.S. 5-Year Note Auction Avg. Yield

--

F: --

P: --

U.S. API Weekly Refined Oil Stocks

--

F: --

P: --

U.S. API Weekly Crude Oil Stocks

--

F: --

P: --

U.S. API Weekly Gasoline Stocks

--

F: --

P: --

U.S. API Weekly Cushing Crude Oil Stocks

--

F: --

P: --

Australia RBA Trimmed Mean CPI YoY (Q4)

--

F: --

P: --

Australia CPI YoY (Q4)

--

F: --

P: --

Australia CPI QoQ (Q4)

--

F: --

P: --

Germany GfK Consumer Confidence Index (SA) (Feb)

--

F: --

P: --

Germany 10-Year Bund Auction Avg. Yield

--

F: --

P: --

India Industrial Production Index YoY (Dec)

--

F: --

P: --

India Manufacturing Output MoM (Dec)

--

F: --

P: --

Q&A with Experts
    • All
    • Chatrooms
    • Groups
    • Friends
    @Sarkar flag
    SlowBear ⛅
    @SlowBear ⛅GOOD 👍
    marsgents flag
    john
    @johni see it can go to 100 or 94 zone,from where it drop is mystery
    john flag
    marsgents
    @marsgentsso what is your current move on gold at the moment
    rawa ronte flag
    hello.. hello
    john flag
    marsgents
    @marsgentsdo you have active trade at the moment
    marsgents flag
    john
    @johnnow none,managing my long from below,already long 2 short 1 on early asia
    @Sarkar flag
    SlowBear ⛅
    @SlowBear ⛅I think
    Mohamed Ja flag
    What are the nzduss predictions?
    marsgents flag
    john
    @johnim watching 4985 or below,or atleast asia low before going long
    SlowBear ⛅ flag
    @Sarkar
    @@Sarkar So do you trade another instrument or you only trade Gold?
    SlowBear ⛅ flag
    rawa ronte
    hello.. hello
    @rawa ronteHi mate how are you doing today?
    marsgents flag
    john
    @john4 long on gold collecting long from last 2 friday
    3444482 flag
    What factors are currently affecting gold? If not, I'll be scalping and making money during the fluctuations.
    SlowBear ⛅ flag
    @Sarkar
    @@SarkarWell the clarity will come soon enough so lets just wait for it
    @Sarkar flag
    SlowBear ⛅
    I think the gold market is going to go down a lot in ten minutes.@SlowBear ⛅
    SlowBear ⛅ flag
    @Sarkar
    @@Sarkar wow in just 10min Gold will go down a lot? that is something i would love to see happen though
    @Sarkar flag
    SlowBear ⛅
    @SlowBear ⛅ONLY GOLD 🪙
    Khawatir_ flag
    From Fib Levels To Fireworks: Natural Gas Explodes 146% In 12 Days
    Natural Gas has once again reminded traders of its explosive potential. After finding buyers at a key Fibonacci extension area, prices catapulted 146% in just 12 trading days—an extraordinary rally that left skeptics behind and rewarded those who trusted the technical confluence.
    News
    SlowBear ⛅ flag
    @Sarkar
    @@SarkarWow, only Gold? that is something i have heard many times here
    @Sarkar flag
    SlowBear ⛅
    @SlowBear ⛅Yes Bro
    Type here...
    Add Symbol or Code

      No matching data

      All
      Trump Updates
      Recommend
      Stocks
      Cryptocurrencies
      Central Banks
      Featured News
      • All
      • Russia-Ukraine Conflict
      • Middle East Flashpoint
      • All
      • Russia-Ukraine Conflict
      • Middle East Flashpoint
      Search
      Products

      Charts Free Forever

      Chats Q&A with Experts
      Screeners Economic Calendar Data Tools
      Membership Features
      Data Warehouse Market Trends Institutional Data Policy Rates Macro

      Market Trends

      Market Sentiment Order Book Forex Correlations

      Top Indicators

      Charts Free Forever
      Markets

      News

      News Analysis 24/7 Columns Education
      From Institutions From Analysts
      Topics Columnists

      Latest Views

      Latest Views

      Trending Topics

      Top Columnists

      Latest Update

      Signals

      Copy Rankings Latest Signals Become a signal provider AI Rating
      Contests
      Brokers

      Overview Brokers Assessment Rankings Regulators News Claims
      Broker listing Forex Brokers Comparison Tool Live Spread Comparison Scam
      Q&A Complaint Scam Alert Videos Tips to Detect Scam
      More

      Business
      Events
      Careers About Us Advertising Help Center

      White Label

      Data API

      Web Plug-ins

      Affiliate Program

      Awards Institution Evaluation IB Seminar Salon Event Exhibition
      Vietnam Thailand Singapore Dubai
      Fans Party Investment Sharing Session
      FastBull Summit BrokersView Expo
      Recent Searches
        Top Searches
          Markets
          News
          Analysis
          User
          24/7
          Economic Calendar
          Education
          Data
          • Names
          • Latest
          • Prev

          View All

          No data

          Scan to Download

          Faster Charts, Chat Faster!

          Download App
          English
          • English
          • Español
          • العربية
          • Bahasa Indonesia
          • Bahasa Melayu
          • Tiếng Việt
          • ภาษาไทย
          • Français
          • Italiano
          • Türkçe
          • Русский язык
          • 简中
          • 繁中
          Open Account
          Search
          Products
          Charts Free Forever
          Markets
          News
          Signals

          Copy Rankings Latest Signals Become a signal provider AI Rating
          Contests
          Brokers

          Overview Brokers Assessment Rankings Regulators News Claims
          Broker listing Forex Brokers Comparison Tool Live Spread Comparison Scam
          Q&A Complaint Scam Alert Videos Tips to Detect Scam
          More

          Business
          Events
          Careers About Us Advertising Help Center

          White Label

          Data API

          Web Plug-ins

          Affiliate Program

          Awards Institution Evaluation IB Seminar Salon Event Exhibition
          Vietnam Thailand Singapore Dubai
          Fans Party Investment Sharing Session
          FastBull Summit BrokersView Expo

          Seoul Rushes Bill as Trump Warns of 25% Auto Tariffs

          James Riley

          Remarks of Officials

          Stocks

          Daily News

          Political

          Economic

          Summary:

          South Korea pushes a $350B US investment bill to counter Trump's tariff threats over a stalled trade deal.

          South Korea’s Finance Minister, Koo Yun-cheol, is set to urge lawmakers to fast-track a $350 billion U.S. investment bill following a threat from President Donald Trump to increase tariffs on South Korean automobiles.

          The move comes just hours after Trump announced potential tariff hikes not only on cars but also on South Korean lumber and pharmaceuticals, citing the country's failure to ratify a trade agreement with Washington.

          Trump Signals Higher Tariffs on Korean Imports

          In a social media post, President Trump declared his intention to raise tariffs on a range of South Korean goods. He specifically flagged an increase on auto tariffs from 15% to 25%.

          "South Korea's Legislature is not living up to its Deal with the United States," Trump wrote. He stated that because the legislature had not enacted their "Historic Trade Agreement," he was increasing tariffs on autos, lumber, and pharmaceuticals to 25%.

          South Korea's Plan to Address US Concerns

          In response, South Korea's Finance Ministry announced that Minister Koo Yun-cheol will meet with Lim Lee-ja, the head of the National Assembly's finance committee, to push for the bill's passage. The proposed legislation has been stalled in the committee since its submission in December.

          "We are currently assessing the U.S. side's intentions," the finance ministry said in a statement. "We will communicate with the U.S. government, including by explaining the status of the bill's discussion in the National Assembly."

          The ministry added that it would continue to actively consult with the National Assembly on the matter.

          Automakers Tumble on Tariff News

          The threat from Washington sent immediate ripples through South Korea's stock market. In morning trading, shares of Hyundai Motor fell by more than 2%, while Kia's stock price dropped by over 3%.

          To stay updated on all economic events of today, please check out our Economic calendar
          Risk Warnings and Disclaimers
          You understand and acknowledge that there is a high degree of risk involved in trading. Following any strategies or investment methods may lead to potential losses. The content on the site is provided by our contributors and analysts for information purposes only. You are solely responsible for determining whether any trading assets, securities, strategy, or any other product is suitable for investing based on your own investment objectives and financial situation.
          Add to Favorites
          Share

          Advanced Micro Devices (AMD) Price Forecast: Bullish Structure Holds Near Record Highs

          Samantha Luan

          Stocks

          Key Points:

          · AMD remains near record highs following a strong multi-month rally
          · Weekly structure shows bullish continuation despite recent hesitation
          · Rising moving averages support the broader uptrend
          · Key support zones defined by Fibonacci and prior consolidation
          · Breakout above $267 could open the door to new highs

          AMD Maintains Strength Near Record Highs

          The stock of Advanced Micro Devices (AMD) has been a market leader and remains strong. It is hovering near prior highs around $267. AMD is a leading semiconductor firm specializing in high-performance CPUs, GPUs, and adaptive computer solutions for data centers and gaming. The company competes with Intel (INTC) and Nvidia (NVDA) with innovations like MI300 AI accelerators. In 2025, AMD stock advanced by 77%, and as of Monday's closing price, it was up by 17.3% year-to-date. Earnings are reported next week.

          Weekly Chart Shows Bullish Structure After Breakout

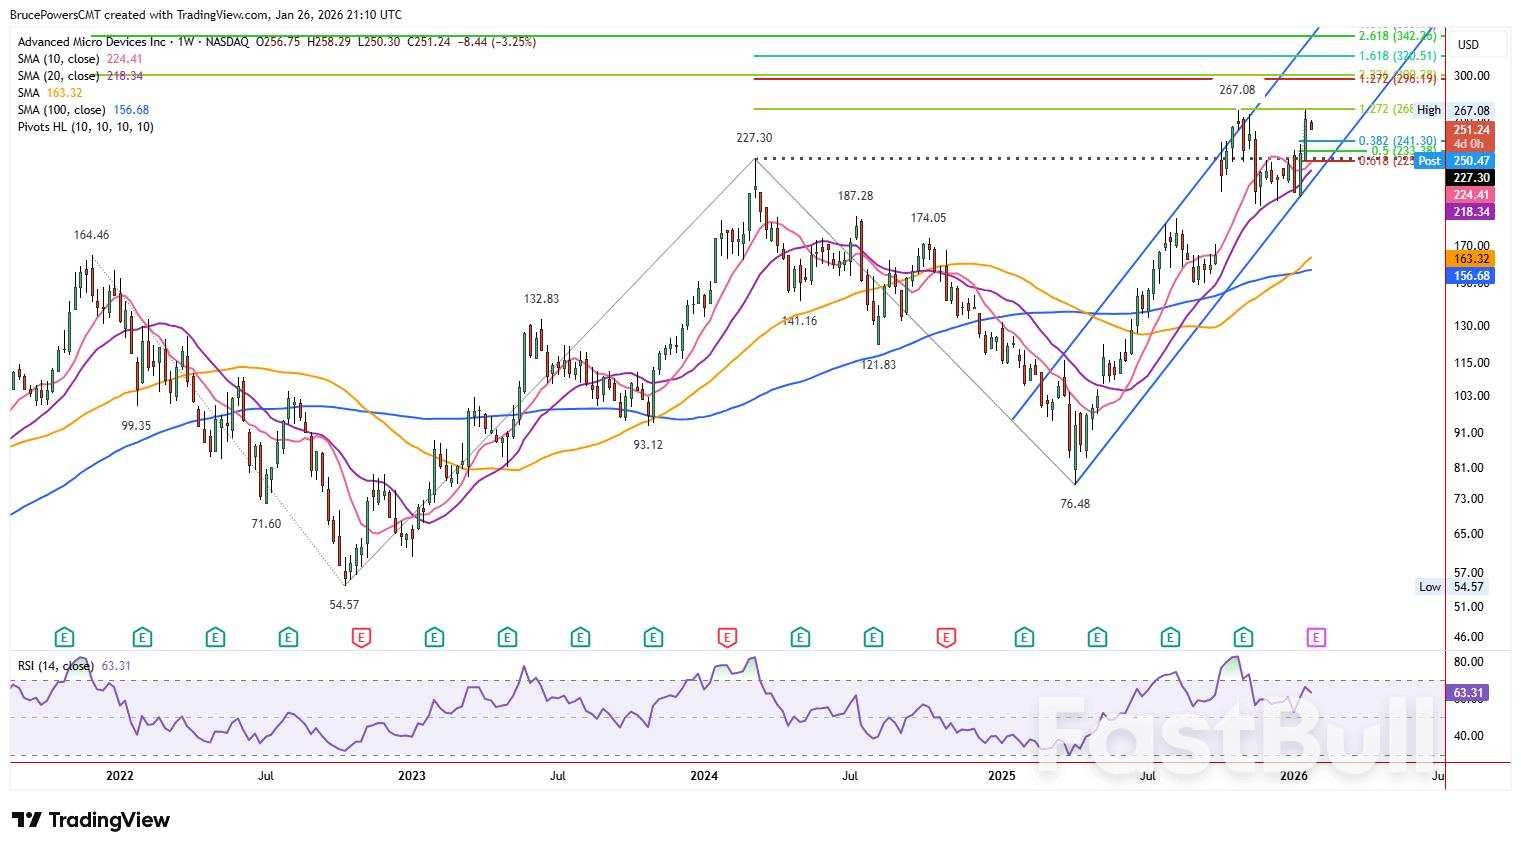
          AMD weekly chart showing that a long term base breakout attempt remains in progress. Source: TradingView as of Jan 26, 2026.

          An attempt to further the advance in AMD stock has been underway following a new record high breakout to $267.08 in October. The first pullback culminated with a higher swing low of $194.28 and a seven-month consolidation bottom phase. During the related consolidation period trend support was recognized near the 20-week average. Last week's the bulls failed to breakout to a new record high as a top was hit at $266.96, very close to the prior high, before weakening on Monday.

          Daily Chart Confirms Trend Strength and Channel Support

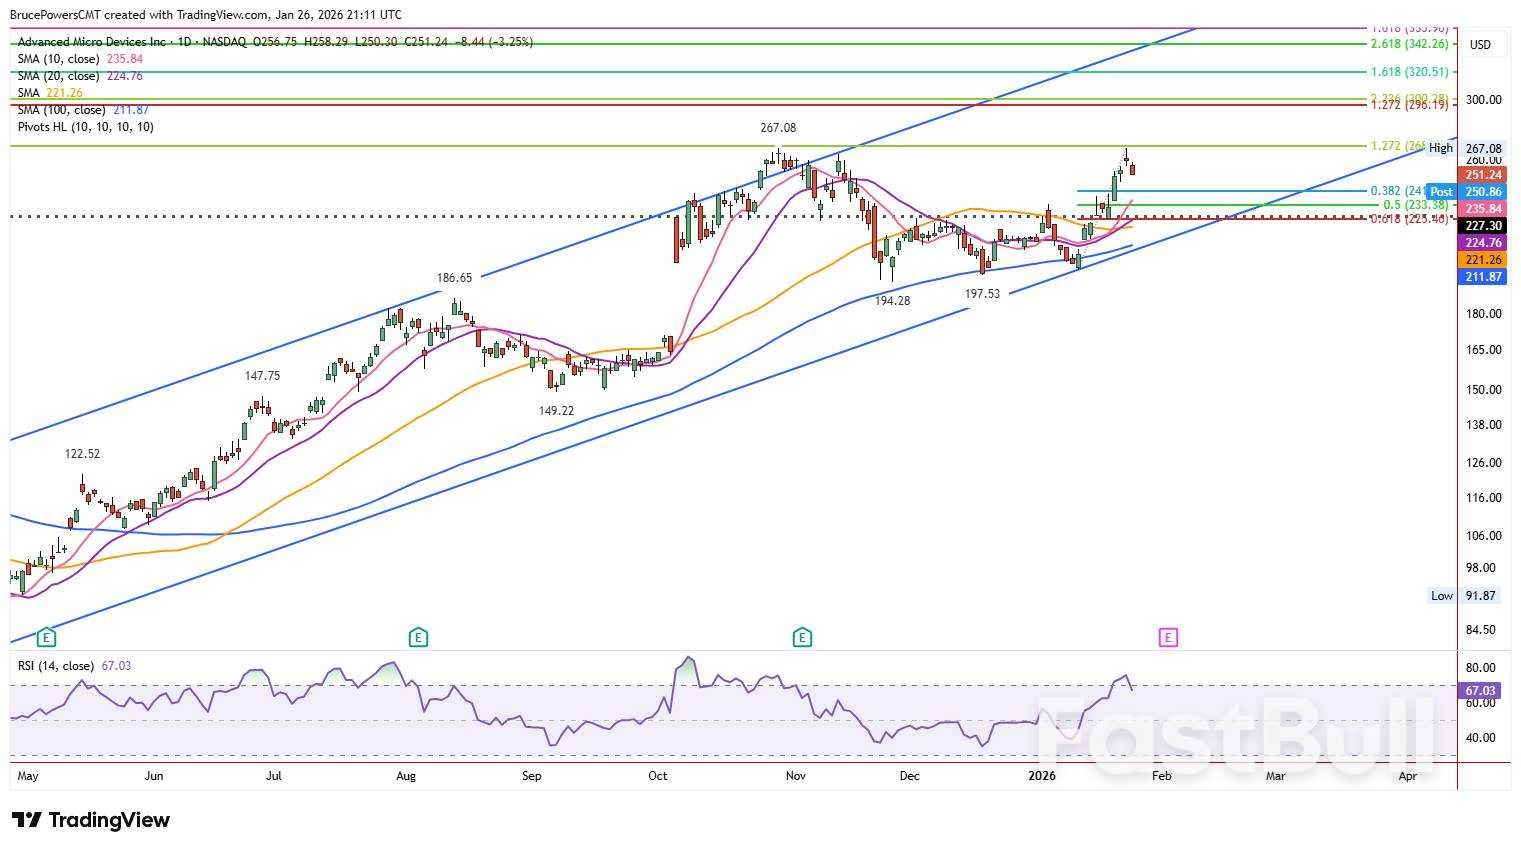
          AMD daily chart showing a bounce off solid dynamic support. Source: TradingView as of Jan 26, 2026.

          Following a pullback from last week's high, the bull structure in AMD shows a likely continuation into new highs. The daily chart confirms underlying strength with faster moving averages rising above the 50-day average recently. Support for the recent pullback was confirmed near the long-term 200-day average. Moreover, a rising channel outlines the price movement within the uptrend, showing the potential for higher prices as the top of the channel is a potential target. A bounce from the lower boundary of the channel improves the possibility of AMD eventually approaching the top boundary line.

          Key Support Levels Define Near-Term Risk

          Last week's low of $225.41 is considered the maximum downside for support to hold while maintaining a short-term bullish structure. It remains possible that AMD trades range-bound for a period before another breakout attempt. However, signs of strength following tests of key support levels may signal the potential for a renewed advance toward the $267.08 high.

          Fibonacci Levels Highlight Deeper Support Zone

          The 38.2% Fibonacci retracement of the prior advance is located at $241.30, while the rising 10-day average is currently near $236. A deeper pullback would bring the 50% retracement into focus at $233.48, which closely aligns with the top of a seven-week consolidation range near $234.02, reinforcing that zone as an important area of technical support.

          Source: FX Empire

          Risk Warnings and Disclaimers
          You understand and acknowledge that there is a high degree of risk involved in trading. Following any strategies or investment methods may lead to potential losses. The content on the site is provided by our contributors and analysts for information purposes only. You are solely responsible for determining whether any trading assets, securities, strategy, or any other product is suitable for investing based on your own investment objectives and financial situation.
          Add to Favorites
          Share

          China's Industrial Profits Rebound After Three-Month Slump

          Michelle

          Data Interpretation

          Economic

          China's industrial sector posted its first profit increase in three months, offering a sign of stability as persistent factory-gate deflation shows signs of letting up.

          According to data from the National Bureau of Statistics, industrial profits climbed 5.3% in December from a year earlier. This marks a significant turnaround from the more than 13% plunge recorded in November and soundly beats Bloomberg Economics' forecast of an 11% drop.

          A Modest Gain for the Full Year

          For the full year, industrial earnings rose 0.6%, the first annual gain since 2021. This metric is a key indicator of the financial health of China's factories, mines, and utilities, and it often influences their investment decisions in the quarters ahead.

          Despite the year-end recovery, profit margins have been consistently squeezed by weak domestic demand. Government efforts to manage excess competition and reduce overcapacity have yet to fully resolve these pressures. While the broader economy lost momentum in the last quarter, industrial production remained resilient, largely supported by strong export performance.

          The Lingering Shadow of Deflation

          The core challenge for China's manufacturing-dominated industry has been domestic deflation, which erodes both revenue and profits. Producer prices have been falling for over three years, but December saw the smallest year-on-year decrease in over twelve months, providing some relief to companies.

          These deflationary pressures emerged after the pandemic, driven by a prolonged slump in the housing market and sluggish consumer spending. At the same time, a glut of production capacity in certain industries has created an oversupply, forcing firms to slash prices to stay competitive.

          To stay updated on all economic events of today, please check out our Economic calendar
          Risk Warnings and Disclaimers
          You understand and acknowledge that there is a high degree of risk involved in trading. Following any strategies or investment methods may lead to potential losses. The content on the site is provided by our contributors and analysts for information purposes only. You are solely responsible for determining whether any trading assets, securities, strategy, or any other product is suitable for investing based on your own investment objectives and financial situation.
          Add to Favorites
          Share

          The Commodities Feed: Have US Natural Gas Prices Peaked?

          ING

          Forex

          Commodity

          Energy – US LNG plants reduce gas intake

          US natural gas prices continued their rally yesterday, with front-month Henry Hub settling almost 29% at $6.80/MMBtu. This takes the total gains since 19 January to almost 120%. Yet the move in US natural gas is even more astonishing when looking at the spot Henry Hub price, which briefly broke above $30/MMBtu in recent days. It's been driven by a severe winter storm across the US. This is impacting natural gas production and boosting heating demand. The storm is estimated to have hit around 11% of US natural gas production. The key question for the outlook, obviously, is how long this disruption lasts. There are some signs that production is already recovering, with gas output from the Permian estimated to be up 11% day-on-day yesterday. If this trend continues, it suggests prices have likely peaked.

          Developments in the US natural gas market remain a concern for the European market, as supply disruptions could weigh on US LNG exports to Europe. In recent days, US LNG plants have significantly reduced their gas intake, estimated at around 48%, which will translate into reduced LNG exports from these plants. TTF continues to trade at a healthy premium to Asian LNG to ensure LNG cargoes move into Europe, where storage has now fallen below 45% full. It's looking increasingly likely that storage will end the 25/26 heating season at below 25% full. This would also be below the levels seen in 2022. The difference between 2022 and 2026 is that we are currently seeing significant LNG supply ramp-ups, which should help soothe supply concerns to some extent.

          Oil prices settled lower yesterday, with ICE Brent closing down more than 0.4%. The US winter storm should also support demand for heating fuels, as reflected in the heating oil crack. Freezing conditions will disrupt US oil output. The weather has also affected refinery operations. So, refinery run rates have fallen in recent days.

          There are also signs that the honeymoon phase between the US and the new Venezuelan leader may be coming to an end, with President Delcy Rodriguez saying Venezuela has had enough of US interference. While these comments may be more for internal consumption, they are certainly worth keeping an eye on, as they could alter the outlook for Venezuelan oil supply.

          Kazakhstan's oil output is set to recover, with Tengizchevroil restoring power to its Tengiz field. Operations at the Tengiz and Korolev fields, which produced around 890k b/d over the first three quarters of 2025, were halted last week due to power issues. Meanwhile, the completion of repair work at the CPC terminal should also support a recovery in export flows. A recovery in these flows should improve availability in the prompt market, putting some pressure on the Brent prompt spread, which has strengthened significantly through January. The strength in timespreads has been at odds with estimates for a large oil surplus.

          Metals - Silver smashes another record above $110/oz

          Silver surged more than 12% in its biggest one-day jump since 2008, hitting a new record above $110/oz, before giving back some of these gains. The rally reflects both its precious metal appeal and tightening physical conditions: inventories remain low, lease rates are elevated, and the market has entered yet another year of supply deficits. Prices are now up around 60% year‑to‑date after a nearly 150% surge in 2025. Yet risks remain, with high prices potentially triggering industrial demand destruction and silver's tendency to overshoot, keeping volatility high. The gold–silver ratio has now slipped below 50, its lowest level since 2011, underscoring silver's dramatic outperformance.

          Gold also extended its rally above $5,100/oz at one stage yesterday. It was supported by Federal Reserve rate cut expectations, a weaker dollar and persistent geopolitical risks. With the central bank buying holding strong and real rates likely heading lower, the medium-term outlook remains favourable. As political uncertainty elevated, from President Trump‑driven policy surprises to a new Fed chair to the US midterm elections later this year, gold should continue to find investor support.

          Source: ING

          Risk Warnings and Disclaimers
          You understand and acknowledge that there is a high degree of risk involved in trading. Following any strategies or investment methods may lead to potential losses. The content on the site is provided by our contributors and analysts for information purposes only. You are solely responsible for determining whether any trading assets, securities, strategy, or any other product is suitable for investing based on your own investment objectives and financial situation.
          Add to Favorites
          Share

          Trump Threatens 25% Tariffs on South Korean Imports

          James Riley

          Daily News

          Political

          Economic

          Remarks of Officials

          Former US President Donald Trump has signaled a potential tariff hike to 25% on goods imported from South Korea. He cited the Korean legislature's alleged failure to finalize a trade agreement concluded with the United States last year as the primary reason for the move.

          The current tariff rate on South Korean exports under the existing agreement is 15%. In a social media post on Monday, January 26, Trump stated the increased tariff would apply to sectors including cars, lumber, and pharmaceuticals, among other "Reciprocal TARIFFS."

          Trump's Rationale and Market Impact

          Trump claimed that South Korea's legislature is not honoring its side of the trade deal. "In each of these Deals, we have acted quickly to lower our TARIFFS as agreed," he stated. "We expect our Trading Partners to do the same."

          Analysts immediately weighed in, warning that such a tariff increase could severely impact major South Korean companies. Hyundai Motor Co., for example, shipped 1.1 million cars to the U.S. in 2024 and would be significantly affected by the change.

          It is important to note, however, that the administration has not issued any official notice authorizing the execution of these suggested tariff amendments.

          A Pattern of Global Trade Pressure

          Reports suggest this move is part of a broader strategy by Trump to escalate trade tensions with key U.S. allies. His statements targeting South Korea are consistent with other recent threats made against major trading partners.

          Canada and Europe Targeted

          Trump has also signaled plans to impose 100% tariffs on Canadian products if the country finalizes a trade agreement with China.

          Furthermore, he has indicated that he is considering new tariffs on goods from Europe. This consideration is reportedly in line with his strategic focus on Greenland, the world's largest island and a territory within the Kingdom of Denmark.

          Sanctions Pressure via Iran

          To intensify pressure on Tehran amid anti-government protests, Trump also announced his intention to impose tariffs on exports from any nation that trades with Iran. This tactic uses secondary sanctions to isolate the Iranian government.

          Domestic Political Headwinds

          While Trump’s trade policies create global market uncertainty, their long-term viability faces significant challenges within the United States.

          Supreme Court Scrutiny

          Analysts note that an upcoming Supreme Court decision could render these latest tariff threats insignificant. If the court rules against him, Trump's ability to unilaterally adjust import taxes could be restricted. A hearing on the matter is scheduled for February 20 of this year.

          Public and Party Concerns

          Recent polls suggest that many Americans are frustrated with Trump's leadership approach, a sentiment observed ahead of the midterm elections scheduled for Tuesday, November 3, 2026.

          Even the former president's allies have reportedly raised concerns about his high-pressure tactics. They have pointed to his interest in Greenland, a fatal shooting by federal agents during an immigration crackdown in Minneapolis, and a US military operation that resulted in the arrest of Venezuelan President Nicolás Maduro. Some allies have argued that Trump should soften his hardline stance, particularly on deportation.

          To stay updated on all economic events of today, please check out our Economic calendar
          Risk Warnings and Disclaimers
          You understand and acknowledge that there is a high degree of risk involved in trading. Following any strategies or investment methods may lead to potential losses. The content on the site is provided by our contributors and analysts for information purposes only. You are solely responsible for determining whether any trading assets, securities, strategy, or any other product is suitable for investing based on your own investment objectives and financial situation.
          Add to Favorites
          Share

          China's Anta Sports Snares 29% Puma Stake For $1.8 Billion

          Justin

          Stocks

          China's Anta Sports Snares 29% Puma Stake For $1.8 Billion_1

          China's Anta Sports Snares 29% Puma Stake For $1.8 Billion_2China's Anta Sports Snares 29% Puma Stake For $1.8 Billion_3

          China's Anta Sports Products (2020.HK) said on Tuesday it would buy a 29.06% stake in Puma (PUMG.DE) from the Pinault family for 1.51 billion euros ($1.79 billion), making it the biggest shareholder in the German sportswear maker.

          The Hong Kong-listed company will pay 35 euros per share in cash for 43 million Puma shares, Anta said in a stock exchange filing. The price is a 62% premium to Puma's 21.63 euros closing share price on Monday, up nearly 17% in the session.

          Reuters was the first to report the deal earlier this month.

          Anta said it believed Puma could increase its international competitiveness and build its brand recognition with the Chinese company as its largest investor.

          It said Anta would seek Puma board seats once the deal was finalised.

          "Its (Puma) global business footprint and focused positioning in sports categories are highly complementary to the group's existing multi-brand and specialised business," Anta said in a statement.

          Anta has a track record of acquiring and revamping Western sports and lifestyle brands, and in 2019, it led a consortium to buy Amer Sports, owner of racquet maker Wilson and mountain sports specialist Salomon.

          Reuters reported in early January Anta had offered to buy about 29% of Puma from the Pinault family and had secured financing for the acquisition, although talks had at the time stalled over valuation.

          The transaction comes as the German sportswear group struggles to revive sales and investor confidence under its new CEO, Arthur Hoeld.

          Artemis, run by Francois-Henri Pinault, chairman of luxury group Kering (PRTP.PA), had previously described its Puma stake as non-strategic. The Pinault family acquired the holding from Kering in 2018, when the group repositioned itself as a pure luxury player.

          Puma has been under pressure as demand weakened, and recent sneaker launches, including the Speedcat, failed to generate the momentum executives had hoped for. Hoeld, who took over last year, has outlined a turnaround focused on brand heat, performance products, and cost discipline.

          The deal is subject to antitrust clearances, shareholder approval at Anta, and regulatory approvals in China and other jurisdictions. Anta said it expects to convene an extraordinary general meeting, with closing targeted after conditions are met.

          ($1 = 0.8421 euros)

          Source: Reuters

          Risk Warnings and Disclaimers
          You understand and acknowledge that there is a high degree of risk involved in trading. Following any strategies or investment methods may lead to potential losses. The content on the site is provided by our contributors and analysts for information purposes only. You are solely responsible for determining whether any trading assets, securities, strategy, or any other product is suitable for investing based on your own investment objectives and financial situation.
          Add to Favorites
          Share

          Why India Can't Quit Discounted Russian Crude

          George Anderson

          Remarks of Officials

          Commodity

          Traders' Opinions

          Political

          Russia-Ukraine Conflict

          Economic

          Energy

          Despite persistent US pressure and sanctions, India's appetite for discounted Russian oil has proven remarkably resilient. While market watchers once predicted a sharp drop-off, a new status quo suggests these significant crude flows could continue well into 2026, driven by compelling economics for New Delhi.

          Indian Oil Minister Hardeep Puri recently highlighted the complex global energy landscape, noting that despite an abundance of supply, the world has "become more challenging." Speaking ahead of a major energy summit in Goa, Puri emphasized that market dynamics ultimately determine India's purchasing decisions—a clear signal that price remains a top priority.

          This places the dilemma over Russian crude at the center of upcoming discussions, alongside topics like the global gas supply surge and a renewed interest in nuclear energy.

          Navigating Sanctions and Market Realities

          Washington's efforts to curb Moscow's oil revenue have certainly had an impact. Before Russia's 2022 invasion of Ukraine, India sourced most of its crude from the Middle East. In recent months, there has been a partial return to these traditional suppliers as a way to rebalance its import portfolio.

          State-owned Bharat Petroleum Corp. (BPCL), for instance, has issued tenders for long-term supplies of Abu Dhabi's Murban, Iraqi Basrah, and Omani crude. Meanwhile, Indian Oil Corp. (IOC) has increased its purchases on the spot market.

          However, the allure of cheap Russian oil is difficult to ignore. As US sanctions on major Russian producers cause the price of benchmark Urals crude to fall, Indian refiners are finding the discounts irresistible. Even the typically conservative Reliance Industries Ltd. has placed new orders for non-sanctioned Russian cargoes, joining IOC, BPCL, and the sanctioned refiner Nayara Energy Ltd. in continuing these purchases.

          Analyst View: Russian Imports Are Here to Stay

          Market experts believe that while the volume of Russian oil heading to India may have dipped from its peak, it is unlikely to disappear.

          "We know that oil will always find a way," said Arne Lohmann Rasmussen, chief analyst at A/S Global Risk Management. He noted that while US sanctions and EU bans are affecting the market, he "strongly doubt[s] that India will give up importing Russian oil."

          At its highest point, India imported over 2 million barrels of Russian crude per day. That figure fell to around 1.3 million barrels per day in December and is expected to hold steady this month. This is a far cry from the near-zero levels some analysts predicted in October after the US blacklisted Russian energy giants Rosneft PJSC and Lukoil PJSC.

          Naveen Das, a senior crude oil analyst at Kpler Ltd., predicts India will "maintain a healthy baseload of Russian crude." He expects this to be part of a broader strategy that includes expanding deals with Middle Eastern suppliers and exploring new opportunities, such as non-sanctioned Venezuelan oil.

          "India will continue to look out for the best prices and best margins for its refiners, strategically changing its buying slate," Das added.

          What Could Change India's Strategy?

          Beyond direct disruptions to Russia's export capabilities, such as Ukrainian attacks, only a few key factors could significantly alter India's current approach:

          • A US-India Trade Deal: If a comprehensive trade agreement is signed, New Delhi might adopt a more cautious stance on Russian imports to align with its strategic partner. Former US President Donald Trump recently mentioned a "good trade deal" was forthcoming, but offered no specifics.

          • Geopolitical Diversification: India is keen to cultivate trade and political ties beyond its long-standing relationship with Russia. As its refining capacity is forecast to grow from 258 million to 309.5 million tons a year by 2030, diversifying its energy sources is a strategic imperative. Puri noted that India now has 41 supply sources, up from 27 just a few years ago.

          • A Global Oil Glut: The current oversupply in the global oil market gives India substantial leverage. Even without Russian discounts, India has plenty of other options available.

          As one of the world's most important demand hubs, India is in a powerful negotiating position. "What is key to remember is that in a world of oversupplied oil currently... India is still one of the key demand hubs," explained Kpler's Das. This gives the country a "fair amount of optionality," meaning it won't be punished for adjusting its purchasing strategy as it sees fit.

          These dynamics will be a central theme at India Energy Week, which runs from January 27 to January 30.

          To stay updated on all economic events of today, please check out our Economic calendar
          Risk Warnings and Disclaimers
          You understand and acknowledge that there is a high degree of risk involved in trading. Following any strategies or investment methods may lead to potential losses. The content on the site is provided by our contributors and analysts for information purposes only. You are solely responsible for determining whether any trading assets, securities, strategy, or any other product is suitable for investing based on your own investment objectives and financial situation.
          Add to Favorites
          Share
          FastBull
          Copyright © 2026 FastBull Ltd

          728 RM B 7/F GEE LOK IND BLDG NO 34 HUNG TO RD KWUN TONG KLN HONG KONG

          TelegramInstagramTwitterfacebooklinkedin
          App Store Google Play Google Play
          Products
          Charts

          Chats

          Q&A with Experts
          Screeners
          Economic Calendar
          Data
          Tools
          Membership
          Features
          Function
          Markets
          Copy Trading
          Latest Signals
          Contests
          News
          Analysis
          24/7
          Columns
          Education
          Company
          Careers
          About Us
          Contact Us
          Advertising
          Help Center
          Feedback
          User Agreement
          Privacy Policy
          Personal Information Protection Statement
          Business

          White Label

          Data API

          Web Plug-ins

          Poster Maker

          Affiliate Program

          Risk Disclosure

          The risk of loss in trading financial instruments such as stocks, FX, commodities, futures, bonds, ETFs and crypto can be substantial. You may sustain a total loss of the funds that you deposit with your broker. Therefore, you should carefully consider whether such trading is suitable for you in light of your circumstances and financial resources.

          No decision to invest should be made without thoroughly conducting due diligence by yourself or consulting with your financial advisors. Our web content might not suit you since we don't know your financial conditions and investment needs. Our financial information might have latency or contain inaccuracy, so you should be fully responsible for any of your trading and investment decisions. The company will not be responsible for your capital loss.

          Without getting permission from the website, you are not allowed to copy the website's graphics, texts, or trademarks. Intellectual property rights in the content or data incorporated into this website belong to its providers and exchange merchants.

          Not Logged In

          Log in to access more features

          Connect Broker
          Become a signal provider
          Help Center
          Customer Service
          Dark Mode
          Price Up/Down Colors

          Log In

          Sign Up

          Position
          Layout
          Fullscreen
          Default to Chart
          The chart page opens by default when you visit fastbull.com