Markets
News
Analysis
User
24/7
Economic Calendar
Education
Data
- Names
- Latest
- Prev


Signal Accounts for Members
All Signal Accounts
All Contests


U.S. IHS Markit Manufacturing PMI Prelim (SA) (Jan)A:--
F: --
P: --
U.S. IHS Markit Services PMI Prelim (SA) (Jan)A:--
F: --
P: --
U.S. IHS Markit Composite PMI Prelim (SA) (Jan)A:--
F: --
P: --
U.S. UMich Consumer Sentiment Index Final (Jan)A:--
F: --
P: --
U.S. UMich Current Economic Conditions Index Final (Jan)A:--
F: --
P: --
U.S. UMich Consumer Expectations Index Final (Jan)A:--
F: --
P: --
U.S. Conference Board Leading Economic Index MoM (Nov)A:--
F: --
P: --
U.S. Conference Board Coincident Economic Index MoM (Nov)A:--
F: --
P: --
U.S. Conference Board Lagging Economic Index MoM (Nov)A:--
F: --
P: --
U.S. UMich 1-Year-Ahead Inflation Expectations Final (Jan)A:--
F: --
P: --
U.S. Conference Board Leading Economic Index (Nov)A:--
F: --
P: --
U.S. Weekly Total Rig CountA:--
F: --
P: --
U.S. Weekly Total Oil Rig CountA:--
F: --
P: --
Japanese Prime Minister Sanae Takaichi delivers a speech
Germany Ifo Business Expectations Index (SA) (Jan)A:--
F: --
P: --
Germany IFO Business Climate Index (SA) (Jan)A:--
F: --
P: --
Germany Ifo Current Business Situation Index (SA) (Jan)A:--
F: --
P: --
Brazil Current Account (Dec)A:--
F: --
P: --
Mexico Unemployment Rate (Not SA) (Dec)A:--
F: --
P: --
Canada National Economic Confidence IndexA:--
F: --
P: --
U.S. Non-Defense Capital Durable Goods Orders MoM (Excl. Aircraft) (Nov)A:--
F: --
U.S. Durable Goods Orders MoM (Excl. Defense) (SA) (Nov)A:--
F: --
U.S. Durable Goods Orders MoM (Excl.Transport) (Nov)A:--
F: --
P: --
U.S. Durable Goods Orders MoM (Nov)A:--
F: --
U.S. Chicago Fed National Activity Index (Nov)A:--
F: --
U.S. Dallas Fed New Orders Index (Jan)A:--
F: --
P: --
U.S. Dallas Fed General Business Activity Index (Jan)A:--
F: --
U.S. 2-Year Note Auction Avg. YieldA:--
F: --
P: --
U.K. BRC Shop Price Index YoY (Jan)A:--
F: --
P: --
China, Mainland Industrial Profit YoY (YTD) (Dec)A:--
F: --
P: --
Germany 2-Year Schatz Auction Avg. Yield--
F: --
P: --
Mexico Trade Balance (Dec)--
F: --
P: --
U.S. Weekly Redbook Index YoY--
F: --
P: --
U.S. S&P/CS 20-City Home Price Index YoY (Not SA) (Nov)--
F: --
P: --
U.S. S&P/CS 20-City Home Price Index MoM (SA) (Nov)--
F: --
P: --
U.S. FHFA House Price Index MoM (Nov)--
F: --
P: --
U.S. FHFA House Price Index (Nov)--
F: --
P: --
U.S. FHFA House Price Index YoY (Nov)--
F: --
P: --
U.S. S&P/CS 10-City Home Price Index YoY (Nov)--
F: --
P: --
U.S. S&P/CS 10-City Home Price Index MoM (Not SA) (Nov)--
F: --
P: --
U.S. S&P/CS 20-City Home Price Index (Not SA) (Nov)--
F: --
P: --
U.S. S&P/CS 20-City Home Price Index MoM (Not SA) (Nov)--
F: --
P: --
U.S. Richmond Fed Manufacturing Composite Index (Jan)--
F: --
P: --
U.S. Conference Board Present Situation Index (Jan)--
F: --
P: --
U.S. Conference Board Consumer Expectations Index (Jan)--
F: --
P: --
U.S. Richmond Fed Manufacturing Shipments Index (Jan)--
F: --
P: --
U.S. Richmond Fed Services Revenue Index (Jan)--
F: --
P: --
U.S. Conference Board Consumer Confidence Index (Jan)--
F: --
P: --
U.S. 5-Year Note Auction Avg. Yield--
F: --
P: --
U.S. API Weekly Refined Oil Stocks--
F: --
P: --
U.S. API Weekly Crude Oil Stocks--
F: --
P: --
U.S. API Weekly Gasoline Stocks--
F: --
P: --
U.S. API Weekly Cushing Crude Oil Stocks--
F: --
P: --
Australia RBA Trimmed Mean CPI YoY (Q4)--
F: --
P: --
Australia CPI YoY (Q4)--
F: --
P: --
Australia CPI QoQ (Q4)--
F: --
P: --
Germany GfK Consumer Confidence Index (SA) (Feb)--
F: --
P: --
Germany 10-Year Bund Auction Avg. Yield--
F: --
P: --
India Industrial Production Index YoY (Dec)--
F: --
P: --
India Manufacturing Output MoM (Dec)--
F: --
P: --


SURYAVANSHI
ID: 5249090


No matching data
Latest Views
Latest Views
Trending Topics
Top Columnists
Latest Update
White Label
Data API
Web Plug-ins
Affiliate Program
View All

No data

Central Bank

Bond

Commodity

Remarks of Officials

Political

Technical Analysis

Traders' Opinions

Economic

Daily News

Forex
Gold hits record highs, fueled by geopolitical turmoil and currency fears, prompting a flight to safety.
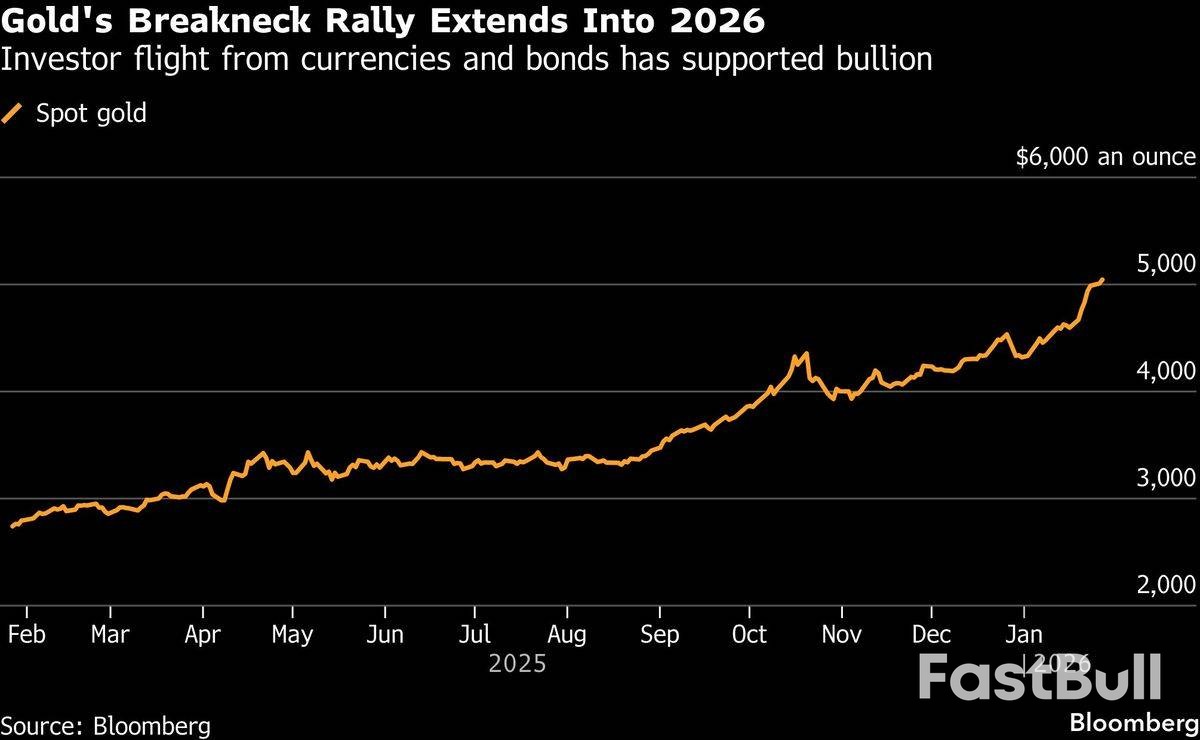
Gold prices pushed above the key US$5,000 per ounce mark for a second consecutive day, extending a powerful rally driven by a weakening U.S. dollar and mounting geopolitical risk. The precious metal is capitalizing on a flight from sovereign bonds and traditional currencies as investors seek safe-haven assets.
On Tuesday, bullion climbed as much as 1.4%, marking its seventh straight day of gains. The rally gained momentum after U.S. President Donald Trump threatened to raise tariffs on South Korean goods. A key dollar index also fell on Monday amid speculation that the U.S. might assist Japan in supporting the yen, a move that makes dollar-priced gold cheaper for international buyers. Silver also saw significant gains, climbing over 7%.
Gold's recent performance underscores its traditional role as a barometer of market fear. The metal, which has more than doubled in value over the last two years, is building on its best annual performance since 1979 with a further 17% gain so far this year.
This surge is largely attributed to the "debasement trade," a strategy where investors move away from government-backed currencies and bonds over concerns about fiscal policy and currency devaluation. A recent large-scale sell-off in the Japanese bond market is a prime example of investors pushing back against heavy government spending.

Recent actions by the Trump administration have further unsettled investors. Market confidence has been shaken by threats of military intervention in Venezuela, proposals to annex Greenland, and renewed attacks on the independence of the U.S. Federal Reserve.
The warning to South Korea came shortly after a weekend threat to impose 100% tariffs on Canada if it finalizes a trade agreement with China. According to Europe's largest money manager, Amundi SA, America's growing isolation is prompting many investors to reduce their holdings of dollar-denominated assets in favor of gold.
"Gold in the long term is a very good protection against debasement and a good way to maintain some purchasing power," said Vincent Mortier, Amundi's chief investment officer, in a Bloomberg Television interview.
The bullish sentiment for gold is reflected across derivatives markets, where traders are positioning for further price increases.
• Implied Volatility: Volatility on Comex gold futures has climbed to its highest level since the peak of the Covid-19 pandemic in March 2020.
• ETF Activity: The world's largest gold-backed exchange-traded fund, State Street's SPDR Gold Shares, has also seen a significant breakout in volatility.
"Traders are buying pullbacks rather than fading rallies," noted Fawad Razaqzada, an analyst at City Index Ltd. "As long as that mindset persists, it is difficult to argue against higher prices in the near term, even if there is a short-term disconnect between fundamentals and reality."
Investors are closely watching for President Trump's nomination for the next Federal Reserve chair. The president has confirmed he has interviewed candidates and has a specific individual in mind. A more dovish appointment could fuel bets on further interest rate cuts this year—a positive catalyst for non-yielding gold—following three consecutive reductions.
In the more immediate term, however, the U.S. central bank is widely expected to pause its rate-cutting cycle on Wednesday. A stabilizing jobs market appears to have restored some consensus among policymakers after months of division.
As of 1 p.m. in Singapore, gold was trading 1.2% higher at US$5,067.84 an ounce. Silver advanced 4.3% to US$108.25 an ounce, after hitting an all-time high above US$117.71 in the previous session. Platinum and palladium also posted gains, while the Bloomberg Dollar Spot Index edged up 0.1% after falling 0.4% in the prior session.
This is precisely what happens when technicals align with changing fundamentals. As noted in our pre-Greenland chaos Analysis, the Dollar Index was already showing signs of imminent technical weakness.
So when Donald Trump decided not only to launch an investigation into Jerome Powell but also to threaten his historic allies, what was seen as a slow, progressive dedollarization quickly became a catastrophe for the US Dollar.
Some European funds are selling their Dollar-denominated debt assets in concern over new, aggressive policies from the current administration and, by actively seeking alternatives, reducing dollar demand – this is leading, in part, to the current decline.
Combined with a seasonal tendency for the US Dollar to drop ahead of interest rate decisions during cutting cycles, the weekly drop is getting extreme – fewer participants can absorb sudden outflows ahead of FOMC Meetings for risk-management reasons, amplifying such moves.
This dedollarization explains the ongoing run in Gold (which just hit $5,000 today) and other metals – The Debasement Trade for those unfamiliar with the trending financial term.

Looking back at the September cut, for example, the Dollar Index had reached 2025 yearly lows, a fast-paced selloff just two days ahead of the Rate Decision.
The current situation shows similar conditions, despite no rate cuts anticipated – What interests traders is whether the selloff will continue after the FOMC.
For additional foundational context, I strongly encourage you to explore our FOMC Preview.
With the Fed Funds rate expected to be kept unchanged, investors and institutions will be listening closely to Powell's speech.
A bit less than two rate cuts are currently priced for 2026. With labor conditions seemingly worsening only slightly and inflation remaining closer to 3% than 2% (despite some improvements), the Fed Chair doesn't have many reasons to turn dovish, but the current pricing is still reasonable.
Essentially, the more resilient US economy supports the Dollar and could lead to sudden inflows back into the Greenback after the meeting.
The difference maker will be found in unpredictable events:
While we're here, let's see what the charts say in our multi-timeframe analysis of the US Dollar Index (DXY) to see if there is still much left in the ongoing down move.
Daily Chart

The Technical picture changed suddenly over the past week.
Bulls were taking the Index back towards the 99.50 level but with some short-timeframe resistances, bear divergences combined with Trump actually pushing the Greenland theme, the fused technicals and fundamentals had an immediate effect on the DXY, down 2.50% until today.
Last week led to a huge gap lower today, with the pre-FOMC position closing effect pushing the Index to test the 96.50 to 97.00 Support.
Whether it holds or breaks in the next 1.5 sessions doesn't matter much; the most important will be to see if the Dollar remains above or below after the FOMC.
4H Chart and Technical Levels

Looking closer, the question remains whether the gap is an exhaustion/low volume gap (implying that an extreme is reached) or whether this is an actual runaway gap (meaning further downside).
To help tilt the scales, it is essential to track the path of least resistance.
With the 4H RSI in extreme oversold territory and a key support coming into effect, a rebound makes sense. The question is when.
Keep in mind that the buying could still not be so sudden as traders remain on the sidelines ahead of the key risk-events coming – Think of how such views could be expressed in different FX pairs.
Levels to place on your DXY charts:
Resistance Levels
Support Levels
1H Chart

Looking closer, one things looks clear – The downside is stalling after a brutal descent.
But a slowdown in a downtrend doesn't imply an imminent rebound, buyers will first have to show up.
With the selloff stalling at the descending channel lows, imminent downside keeps a lower probability setup.
Hence from here, a consolidation range until the FOMC between 96.80 and 97.30 is highly probable.
After the FOMC however, the rest will be to see if bulls show up for an upside breakout (to a least test the upper bound of the channel ~98.20).
In case they don't, the selloff may continue.
North Korea launched an unidentified projectile from its east coast on Tuesday, according to South Korea's military. The launch comes just days after the United States unveiled a new defense strategy that shifts more responsibility for deterrence onto its allies.
South Korea's Joint Chiefs of Staff confirmed at least one projectile was fired into the waters off the peninsula. In Japan, the Coast Guard reported that an object, likely a ballistic missile, had probably already fallen into the sea. Officials have not yet released further details.
This marks Pyongyang's second ballistic missile launch in 2022. Following its first test in early January, North Korea claimed it had successfully fired a hypersonic missile.
The latest launch also follows recent accusations from the North that South Korea violated its airspace with drones. The South Korean government has denied any involvement, suggesting the unmanned vehicle may have been sent by civilians and has opened an investigation.
The timing of the test is significant, as it occurred while Undersecretary of Defense for Policy Elbridge Colby was visiting Seoul. During his visit, Colby lauded South Korea as a model ally prepared to assume a greater role in its own defense.
His trip followed the public release of the US National Defense Strategy. The new doctrine urges South Korea to take the lead in deterring North Korean aggression, reflecting the Trump administration's strategic pivot to prioritize the defense of the US homeland.
This move signals a potential reduction in direct American military support for deterring the North's nuclear ambitions, placing more of the burden on regional partners.
The military and strategic developments are unfolding alongside economic friction between the two allies. President Donald Trump recently threatened to impose a 25% tariff on goods imported from South Korea. He cited the country's legislature's failure to codify a trade agreement the two nations had reached the previous year.
In December, the Federal Reserve cut its official interest rate to a range of 3.5% to 3.75%, the lowest since 2022. This move came despite persistent inflation and lingering uncertainty about the impact of tariffs and trade conflicts on prices.
Simultaneously, the U.S. central bank paused its quantitative tightening program, which was designed to shrink its balance sheet. It has since launched Treasury bill purchases under a program called Reserve Management Purchases (RMP)—a move widely seen as a form of disguised quantitative easing. Further plans are in motion to have Freddie Mac and Fannie Mae acquire $200 billion in mortgage-backed securities, a strategy intended to lower home loan rates before the mid-term elections.
Growing political influence over the Fed suggests that a period of sustained monetary laxity is likely. More aggressive rate cuts are on the table, with President Donald Trump advocating for rates as low as 1%. Other potential tools include yield curve control to suppress long-term rates and the continued weakening of banking regulations, especially minimum capital requirements.
The primary goal of these policies is to stimulate economic activity, with President Trump even suggesting growth could reach 20% or 25%. Lower interest rates serve another critical function: reducing the federal government's interest payments, now the second-largest budget item after Social Security.
This strategy is also designed to achieve several related objectives:
• Funding Deficits: Looser bank rules and the RMP program help finance large, ongoing government budget deficits.
• Devaluing the Dollar: A weaker currency is intended to boost the competitiveness of American exports.
• Inflating Away Debt: The combination of strong nominal growth, higher prices, and negative real interest rates is a classic strategy to reduce the burden of the nation's high public debt.
As former U.S. President Herbert Hoover once noted, "The first panacea of a mismanaged nation is inflation of the currency; the second is war. Both bring a temporary prosperity; both bring a permanent ruin."
The "America First" strategy, combining tariffs, sanctions, and aggressive monetary policy, directly threatens the economic sovereignty of other nations, with Asian economies being particularly vulnerable. Their heavy reliance on the U.S. dollar and export-driven growth models makes them susceptible to shocks.
U.S. policies are set to destabilize currency markets and fuel volatility. A forced revaluation of Asian currencies would undermine their exports and reduce local currency revenues from trade denominated in U.S. dollars. This could also import deflationary pressures into their economies.
Furthermore, Asian nations face a structural problem: their individual and state savings often exceed available local investment opportunities due to limited domestic capital markets. This has led to an oversized exposure to the U.S. dollar and American markets. A dollar devaluation would translate directly into significant losses on these investments. Asian central banks and sovereign wealth funds are among the largest holders of U.S. government debt, a problem compounded by recent agreements from Japan and South Korea to invest an additional $550 billion and $350 billion, respectively, in the U.S. to avoid tariffs.
Capital flows present another threat. Money is already moving out of the U.S. and into Asian, South American, and African assets, often through carry trades funded by cheap borrowing. This influx distorts local asset prices and forces central banks to manage currency appreciation rather than focusing on domestic economic priorities.
Domestically, America's loose monetary conditions are inflating already over-stretched valuations in its equity and property markets, bringing a major financial crisis closer. Given the deep institutional linkages, a crash in U.S. markets would inevitably transmit financial instability directly into Asia.
To mitigate these growing risks, Asian economies must take decisive action.
1. Reduce Reliance on the U.S. Dollar
The first step is to redenominate trade away from the U.S. dollar and reduce dependence on America as a buyer of last resort. This requires structural reforms, such as enhancing welfare safety nets to boost domestic consumption and reduce savings rates. Accelerating bilateral and regional trade agreements is also crucial to diversify trading partners.
2. Diversify Financial Investments
Second, Asian nations must decrease their holdings of dollar-denominated assets. In the short term, this involves hedging currency risk and controlling unhedged retail and institutional investments in U.S. markets. The long-term goal is a strategic shift toward non-U.S. investments. This also means avoiding financial "round-tripping," where Asian capital is routed through U.S.-based asset managers only to be reinvested in non-American ventures. Building up regional money markets and financial institutions is key to keeping funds within the region.
3. Forge a United Economic Bloc
Most importantly, Asia must unite to leverage its combined economic and geopolitical power. Progress toward a functional regional bloc has been hindered by nationalism, ethnic diversity, mutual suspicion, and a reluctance to change. The U.S. has successfully used a "divide and conquer" strategy, but a collective, coordinated approach could shift the balance of power.
America will continue to pursue radical economic policies to manage its relative decline and protect its global standing. These strategies will likely outlast the current administration, just as many of President Trump's first-term policies were continued by his successor, Joe Biden.
For Asia, the message is clear: act decisively and urgently. The ongoing realignment of global power presents an opportunity to decouple from America's economic trajectory. Failure to do so will mean the region will be forced to bear a disproportionate share of the costs of America's inevitable adjustment.
Natural Gas has once again reminded traders of its explosive potential. After finding buyers at a key Fibonacci extension area, prices catapulted 146% in just 12 trading days—an extraordinary rally that left skeptics behind and rewarded those who trusted the technical confluence. This surge wasn't just about numbers on a chart; it was a vivid demonstration of how market psychology, technical precision, and momentum can align to produce breathtaking moves. For traders and analysts alike, the rally offers a textbook case study in how Fibonacci levels can act as springboards for powerful trends. Charts often speak louder than words, so let's turn to the charts to see how this remarkable move unfolded…
Natural Gas 11 Jan Daily Elliott Wave ChartOn the daily chart from January 11, Natural Gas was approaching the 3.022 – 1.965 blue box zone—a critical Fibonacci extension area we had been watching closely. This region carried the potential to attract buyers and set the stage for the next leg of the rally. Going to a smaller time frame, within wave (( C )), we saw wave (3) unfolded shorter than wave (1). This gave us a precise invalidation level for wave (5) of ((C)) at 3.008. A break below that level would have opened the door for a deeper pullback toward the 2.620 – 1.965 area. However, buyers stepped in just before this threshold was tested, defending the structure and reigniting the rally.

"Daily chart from January 26 above captures the explosive rally that followed. After price respected the Blue box zone, buyers stepped in with conviction, driving Natural Gas sharply higher reaching a high of $7.439. The move unfolded with textbook momentum, surging 146% in less than two weeks and confirming the strength of the technical setup. The Natural Gas rally underscores a simple truth: Blue box zones mark decisive turning points. Recognizing these areas early can sharpen your edge, helping you anticipate momentum shifts and position yourselves in the market with confidence.

White Label
Data API
Web Plug-ins
Poster Maker
Affiliate Program
The risk of loss in trading financial instruments such as stocks, FX, commodities, futures, bonds, ETFs and crypto can be substantial. You may sustain a total loss of the funds that you deposit with your broker. Therefore, you should carefully consider whether such trading is suitable for you in light of your circumstances and financial resources.
No decision to invest should be made without thoroughly conducting due diligence by yourself or consulting with your financial advisors. Our web content might not suit you since we don't know your financial conditions and investment needs. Our financial information might have latency or contain inaccuracy, so you should be fully responsible for any of your trading and investment decisions. The company will not be responsible for your capital loss.
Without getting permission from the website, you are not allowed to copy the website's graphics, texts, or trademarks. Intellectual property rights in the content or data incorporated into this website belong to its providers and exchange merchants.
Not Logged In
Log in to access more features
Log In
Sign Up