

Markets
News
Analysis
User
24/7
Economic Calendar
Education
Data
- Names
- Latest
- Prev


Signal Accounts for Members
All Signal Accounts
All Contests
 U.S. IHS Markit Manufacturing PMI Prelim (SA) (Jan)
A:--
F: --
P: --
U.S. IHS Markit Services PMI Prelim (SA) (Jan)A:--
F: --
P: --
U.S. IHS Markit Composite PMI Prelim (SA) (Jan)A:--
F: --
P: --
U.S. UMich Consumer Sentiment Index Final (Jan)A:--
F: --
P: --
U.S. UMich Current Economic Conditions Index Final (Jan)A:--
F: --
P: --
U.S. UMich Consumer Expectations Index Final (Jan)A:--
F: --
P: --
U.S. Conference Board Leading Economic Index MoM (Nov)A:--
F: --
P: --
U.S. Conference Board Coincident Economic Index MoM (Nov)A:--
F: --
P: --
U.S. Conference Board Lagging Economic Index MoM (Nov)A:--
F: --
P: --
U.S. UMich 1-Year-Ahead Inflation Expectations Final (Jan)A:--
F: --
P: --
U.S. Conference Board Leading Economic Index (Nov)A:--
F: --
P: --
U.S. Weekly Total Rig CountA:--
F: --
P: --
U.S. Weekly Total Oil Rig CountA:--
F: --
P: --
 Japanese Prime Minister Sanae Takaichi delivers a speech
 Germany Ifo Business Expectations Index (SA) (Jan)
A:--
F: --
P: --
Germany IFO Business Climate Index (SA) (Jan)A:--
F: --
P: --
Germany Ifo Current Business Situation Index (SA) (Jan)A:--
F: --
P: --
 Brazil Current Account (Dec)
A:--
F: --
P: --
 Mexico Unemployment Rate (Not SA) (Dec)
A:--
F: --
P: --
 Canada National Economic Confidence Index
A:--
F: --
P: --
U.S. Non-Defense Capital Durable Goods Orders MoM (Excl. Aircraft) (Nov)A:--
F: --
U.S. Durable Goods Orders MoM (Excl. Defense) (SA) (Nov)A:--
F: --
U.S. Durable Goods Orders MoM (Excl.Transport) (Nov)A:--
F: --
P: --
U.S. Durable Goods Orders MoM (Nov)A:--
F: --
U.S. Chicago Fed National Activity Index (Nov)A:--
F: --
U.S. Dallas Fed New Orders Index (Jan)A:--
F: --
P: --
U.S. Dallas Fed General Business Activity Index (Jan)A:--
F: --
U.S. 2-Year Note Auction Avg. YieldA:--
F: --
P: --
 U.K. BRC Shop Price Index YoY (Jan)
A:--
F: --
P: --
 China, Mainland Industrial Profit YoY (YTD) (Dec)
A:--
F: --
P: --
Germany 2-Year Schatz Auction Avg. Yield--
F: --
P: --
Mexico Trade Balance (Dec)--
F: --
P: --
U.S. Weekly Redbook Index YoY--
F: --
P: --
U.S. S&P/CS 20-City Home Price Index YoY (Not SA) (Nov)--
F: --
P: --
U.S. S&P/CS 20-City Home Price Index MoM (SA) (Nov)--
F: --
P: --
U.S. FHFA House Price Index MoM (Nov)--
F: --
P: --
U.S. FHFA House Price Index (Nov)--
F: --
P: --
U.S. FHFA House Price Index YoY (Nov)--
F: --
P: --
U.S. S&P/CS 10-City Home Price Index YoY (Nov)--
F: --
P: --
U.S. S&P/CS 10-City Home Price Index MoM (Not SA) (Nov)--
F: --
P: --
U.S. S&P/CS 20-City Home Price Index (Not SA) (Nov)--
F: --
P: --
U.S. S&P/CS 20-City Home Price Index MoM (Not SA) (Nov)--
F: --
P: --
U.S. Richmond Fed Manufacturing Composite Index (Jan)--
F: --
P: --
U.S. Conference Board Present Situation Index (Jan)--
F: --
P: --
U.S. Conference Board Consumer Expectations Index (Jan)--
F: --
P: --
U.S. Richmond Fed Manufacturing Shipments Index (Jan)--
F: --
P: --
U.S. Richmond Fed Services Revenue Index (Jan)--
F: --
P: --
U.S. Conference Board Consumer Confidence Index (Jan)--
F: --
P: --
U.S. 5-Year Note Auction Avg. Yield--
F: --
P: --
U.S. API Weekly Refined Oil Stocks--
F: --
P: --
U.S. API Weekly Crude Oil Stocks--
F: --
P: --
U.S. API Weekly Gasoline Stocks--
F: --
P: --
U.S. API Weekly Cushing Crude Oil Stocks--
F: --
P: --
 Australia RBA Trimmed Mean CPI YoY (Q4)
--
F: --
P: --
Australia CPI YoY (Q4)--
F: --
P: --
Australia CPI QoQ (Q4)--
F: --
P: --
Germany GfK Consumer Confidence Index (SA) (Feb)--
F: --
P: --
Germany 10-Year Bund Auction Avg. Yield--
F: --
P: --
 India Industrial Production Index YoY (Dec)
--
F: --
P: --
India Manufacturing Output MoM (Dec)--
F: --
P: --


SURYAVANSHI
ID: 5249090


No matching data
Latest Views
Latest Views
Trending Topics
Top Columnists
Latest Update
White Label
Data API
Web Plug-ins
Affiliate Program
View All
No data
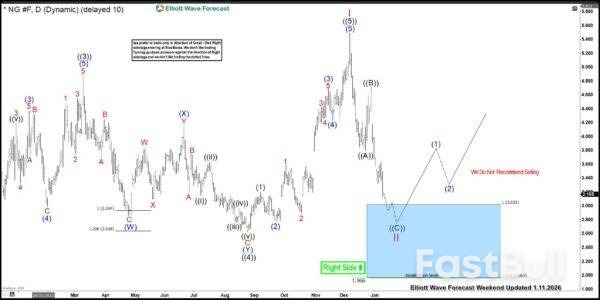
Natural Gas has once again reminded traders of its explosive potential. After finding buyers at a key Fibonacci extension area, prices catapulted 146% in just 12 trading days—an extraordinary rally that left skeptics behind and rewarded those who trusted the technical confluence.
Natural Gas has once again reminded traders of its explosive potential. After finding buyers at a key Fibonacci extension area, prices catapulted 146% in just 12 trading days—an extraordinary rally that left skeptics behind and rewarded those who trusted the technical confluence. This surge wasn't just about numbers on a chart; it was a vivid demonstration of how market psychology, technical precision, and momentum can align to produce breathtaking moves. For traders and analysts alike, the rally offers a textbook case study in how Fibonacci levels can act as springboards for powerful trends. Charts often speak louder than words, so let's turn to the charts to see how this remarkable move unfolded…
Natural Gas 11 Jan Daily Elliott Wave ChartOn the daily chart from January 11, Natural Gas was approaching the 3.022 – 1.965 blue box zone—a critical Fibonacci extension area we had been watching closely. This region carried the potential to attract buyers and set the stage for the next leg of the rally. Going to a smaller time frame, within wave (( C )), we saw wave (3) unfolded shorter than wave (1). This gave us a precise invalidation level for wave (5) of ((C)) at 3.008. A break below that level would have opened the door for a deeper pullback toward the 2.620 – 1.965 area. However, buyers stepped in just before this threshold was tested, defending the structure and reigniting the rally.
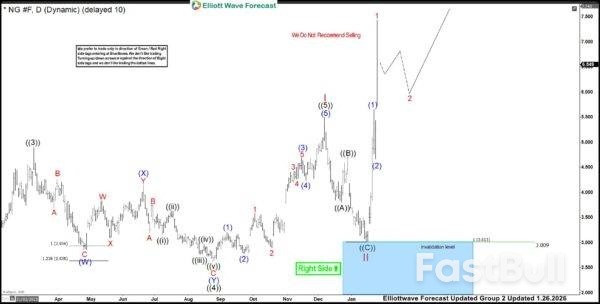
"Daily chart from January 26 above captures the explosive rally that followed. After price respected the Blue box zone, buyers stepped in with conviction, driving Natural Gas sharply higher reaching a high of $7.439. The move unfolded with textbook momentum, surging 146% in less than two weeks and confirming the strength of the technical setup. The Natural Gas rally underscores a simple truth: Blue box zones mark decisive turning points. Recognizing these areas early can sharpen your edge, helping you anticipate momentum shifts and position yourselves in the market with confidence.
India and the European Union announced on Tuesday they have concluded negotiations on an ambitious trade pact, a move celebrated by both sides as the "mother of all deals" in a global economy shaken by U.S. President Donald Trump's tariff policies.
The agreement solidifies a powerful economic bloc. According to the European Commission, trade in goods and services between the EU and India already exceeds €180 billion ($213 billion) annually and supports nearly 800,000 jobs in the EU.
This new deal is projected to double the EU's goods exports to the nation of 1.4 billion people by 2032. The core mechanism is the elimination or reduction of tariffs on 96.6% of the value of EU shipments to India.
Prime Minister Narendra Modi, in a video message, emphasized that the agreement unlocks "big opportunities" for both economies. He noted that the partnership represents a combined 25% of global GDP and one-third of all international trade. "Along with trade, this agreement strengthens our shared commitment toward democracy and rule of law," Modi stated.
The Prime Minister highlighted the strategic value of the pact, framing it as a complement to India's existing agreements with Britain and the European Free Trade Association. "This will strengthen both trade and the global supply chain," he said.
Modi also pointed to specific domestic benefits, congratulating key Indian industries. "I congratulate all those attached with sectors such as textiles, gems and jewelry and leather and shoes as this pact will be very helpful to all of you," he remarked. "This trade deal will not only empower manufacturing in India but will also further expand sectors linked to services."
The agreement outlines significant reductions in Indian tariffs on key European products. Specific changes include:
• European Wines: Tariffs will be slashed from 150% to 75% initially, with a further reduction to as low as 20% over time.
• Olive Oil: The current 45% tariff will be phased out completely, dropping to 0% over a five-year period.
The summit in New Delhi, attended by European Commission President Ursula von der Leyen and European Council President Antonio Costa, also produced a Security and Defense Partnership. This complementary agreement aims to enhance cooperation beyond economics.
According to an EU handout, the partnership will focus on critical areas including:
• Maritime security
• The defense industry
• Cyber and hybrid threats
• Space
• Counter-terrorism
The historic India-EU deal was finalized against a backdrop of friction with the Trump administration. In August, President Trump imposed steep 50% tariffs on Indian goods, which included a 25% penalty targeting New Delhi’s purchases of Russian oil.
The U.S. administration has openly criticized the EU for pursuing the trade pact. In an interview with ABC News on Sunday, U.S. Treasury Secretary Scott Bessent directly challenged the European position.
"We have put 25% tariffs on India for buying Russian oil. Guess what happened last week? The Europeans signed a trade deal with India," Bessent said.
He argued that the EU's actions indirectly undermine sanctions against Russia. "And just to be clear again, the Russian oil goes into India. The refined products come out, and the Europeans buy the refined products. They are financing the war against themselves," Bessent explained. "So, [under] President Trump's leadership, we will eventually end this Ukraine-Russia war."
Canada and India are set to reboot their relationship with a renewed focus on energy, pledging to expand two-way trade in oil and gas after a period of diplomatic tension. The move signals a major strategic reset for both nations.
Under the revived partnership, Ottawa will commit to increasing shipments of crude oil, liquefied natural gas (LNG), and liquefied petroleum gas (LPG) to India. In return, New Delhi will boost its exports of refined petroleum products to Canada.
The agreement is expected to be formalized following a meeting between Canadian Energy Minister Tim Hodgson and Indian Petroleum and Natural Gas Minister Hardeep Singh Puri at India Energy Week in Goa on Tuesday.
This meeting serves to relaunch the "ministerial energy dialogue," a key channel for cooperation that had become inactive during a dispute over the killing of a Canadian Sikh activist.
The renewed dialogue extends beyond traditional fossil fuels. According to a joint statement, Hodgson and Puri will also commit to:
• Facilitating greater reciprocal investment in their respective energy sectors.
• Exploring collaboration on hydrogen, biofuels, and battery storage.
• Cooperating on critical minerals and modernizing electricity systems.
• Investigating the use of artificial intelligence in the energy industry.
This initiative is a key part of Prime Minister Mark Carney's effort to diversify Canada's export markets, particularly as trade tensions with the United States escalate. It reflects a shift toward a more pragmatic, economy-focused diplomacy with major Asian partners.
The relaunch signals that both governments recognize significant untapped potential in their energy relationship. Prime Minister Carney is expected to visit India in the coming weeks to solidify this reset, building on talks he and Prime Minister Narendra Modi restarted in November for a comprehensive economic partnership agreement.
In 2024, two-way goods trade between the two countries reached C$13.3 billion ($9.7 billion), and Ottawa sees substantial room for growth. Energy is a primary focus, with India currently accounting for just 1% of Canada's critical minerals exports.
New infrastructure, including the expansion of the Trans Mountain pipeline, creates a more direct path for Canadian crude to reach India, though most shipments still transit through the U.S. Gulf Coast. Canada's west coast LPG terminals also offer relatively short shipping routes to the Indian market, and the country began exporting LNG to Asia in June 2025.
Carney's push to strengthen ties with India follows a recent trip to Beijing, where an agreement to reduce tariff barriers prompted U.S. President Donald Trump to threaten 100% tariffs on Canadian goods. Carney has maintained that Canada is not pursuing a free trade agreement with China.
1315 – US Weekly ADP Employment Change (4 weeks ending Jan 3)1400 – US Nov. Home Price Index1500 – US Jan Conference Board Consumer Confidence1800 – US Treasury to auction 5-year notes0030 – Australia Dec. and Q4 CPI data
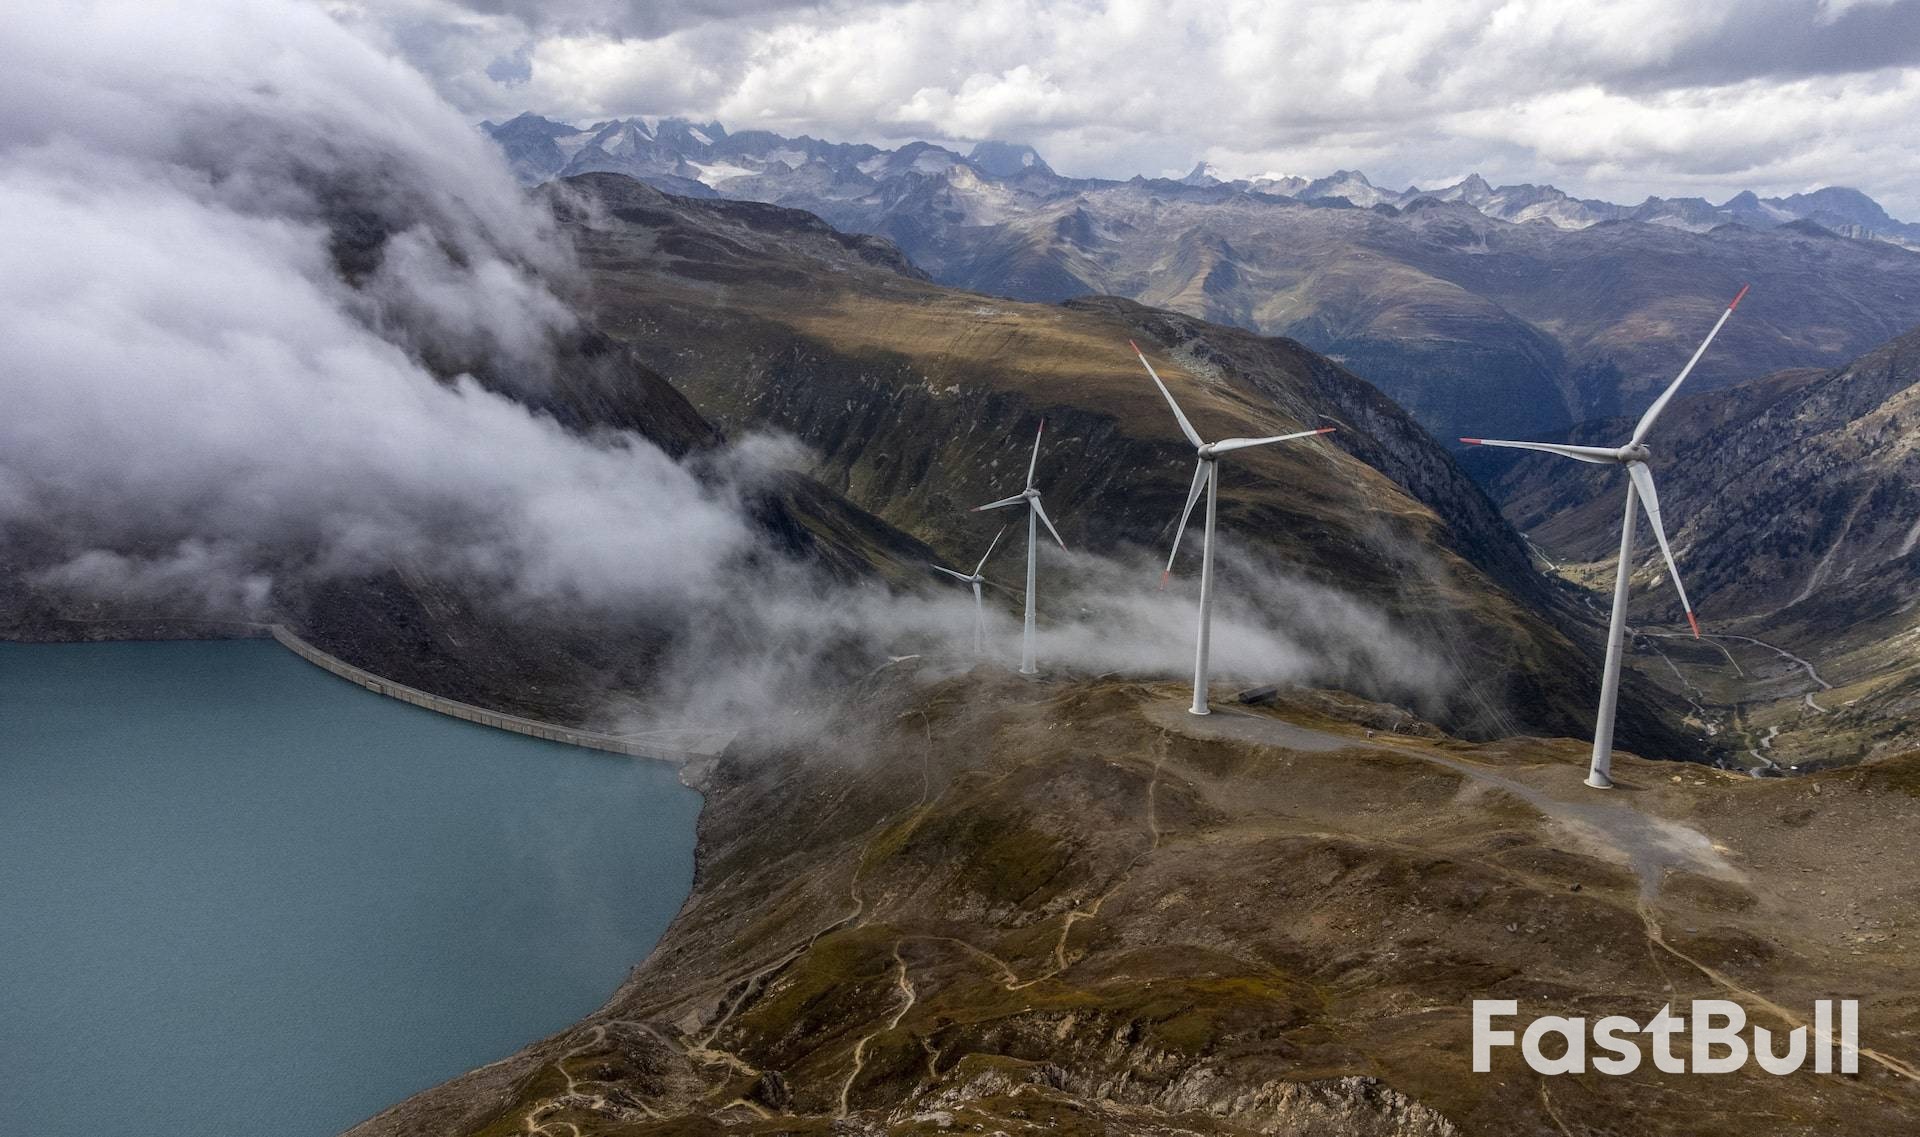
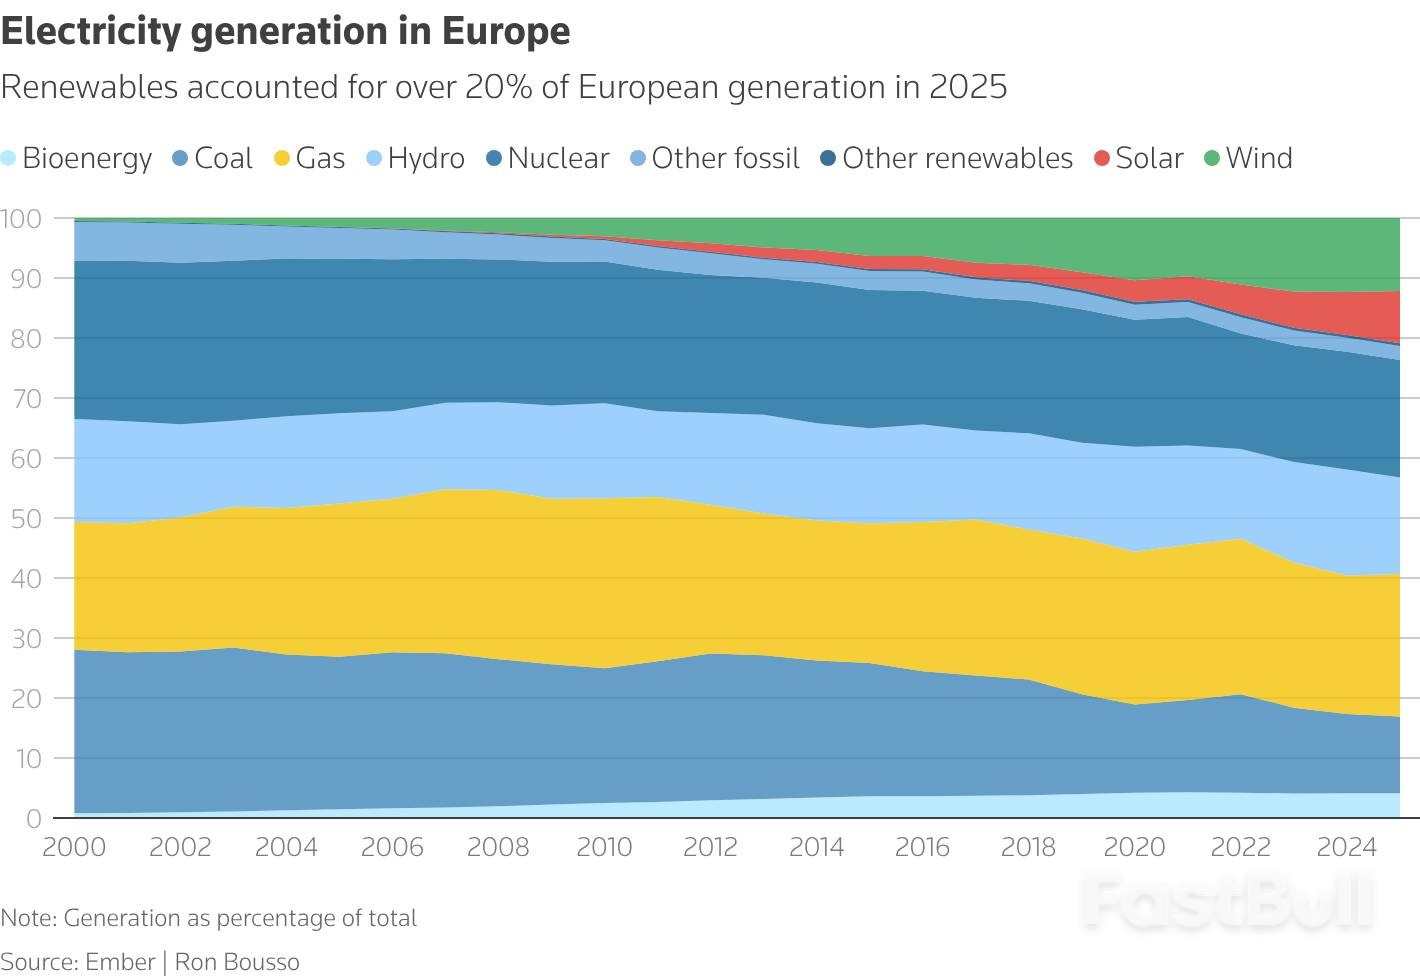
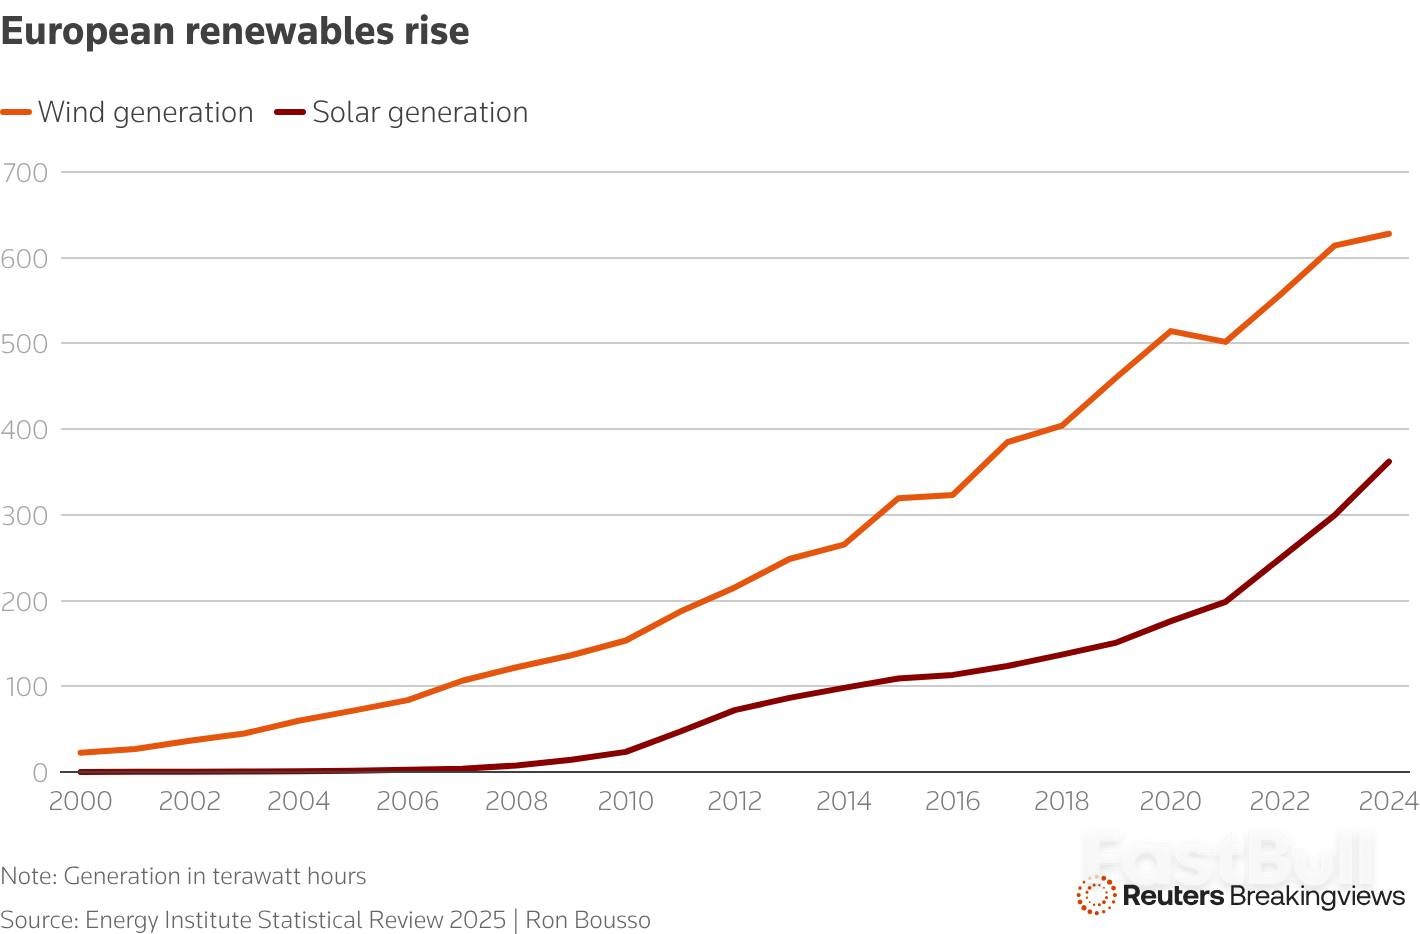
Ten European nations have agreed to jointly develop a massive offshore wind network, a landmark move designed to secure the region's energy supply, reduce dependence on U.S. natural gas, and manage the rising cost of renewables.
At the North Sea Summit, ministers from Britain, Belgium, Denmark, France, Germany, Iceland, Ireland, Luxembourg, the Netherlands, and Norway signed a pact to build 100 gigawatts (GW) of offshore wind capacity. This ambitious project aims to power over 50 million households and builds on a 2023 commitment to install 300 GW of offshore wind by 2050—a strategy initially driven by the energy crisis following Russia's 2022 invasion of Ukraine.
The agreement comes at a critical juncture in Europe's relationship with the United States. Following the disruption of Russian gas flows, Europe has become heavily reliant on U.S. liquefied natural gas (LNG). In 2025, U.S. gas made up 57% of all LNG imports into the EU and Britain, accounting for roughly a quarter of the region's total gas supply.
Concerns over this dependency have been amplified by President Donald Trump's "energy dominance" agenda and transactional approach to diplomacy, highlighted by a recent dispute over Greenland. This new wind power initiative is a clear effort to build a more independent and homegrown energy system.
While wind power is central to Northern Europe's energy strategy—generating 19% of EU electricity in 2025—the industry faces significant headwinds. The region currently operates just 37 GW of offshore wind capacity, making the planned 100 GW expansion a profound transformation of its power market.
Globally, investor confidence in clean energy has cooled due to rising capital costs, supply chain bottlenecks, and concerns over China's dominance in renewables manufacturing. In the U.S., the Trump administration's open hostility toward green energy, especially wind power, has led to the cancellation of multiple projects and further weakened market sentiment.
At the same time, Europe's cost-of-living crisis, exacerbated by high energy prices, has made climate policies a political battleground, creating public resistance to net-zero initiatives.
The multi-nation offshore wind pact is designed to address cost concerns as much as energy security. It includes several features aimed at lowering development expenses and, eventually, consumer electricity bills.
Leveraging Economies of Scale
The sheer scale of the 100 GW commitment is its most powerful feature. By providing the offshore wind supply chain with greater demand certainty, the plan is expected to spur investment in European manufacturing. Industry group WindEurope projects the initiative will:
• Cut costs by 30% between 2025 and 2040.
• Create 91,000 jobs.
• Generate 1 trillion euros ($1.19 trillion) in economic activity.
Building an Integrated Power Network
A core element of the agreement is a plan to connect wind farms to multiple countries through a network of bidirectional cables and interconnectors. This integrated grid will allow electricity to flow where it is most needed, improving efficiency and giving operators the flexibility to respond to shifting supply and demand across different markets.
This cross-border "arbitrage" should also minimize "negative pricing" events, where excess wind generation forces operators to shut down turbines and receive compensation. "When it is windy in Germany, it may not be windy in the UK, so if Germany can't use all of the power, the UK can take some instead of wasting it," explained Jordan May, a senior analyst at consultancy TGS 4C.
Furthermore, because the network will span multiple time zones, peak demand hours will vary by country. This diversity should make it easier to match supply with demand, reducing the need for gas-fired backup power.
An Unexpected Boost from US Policy
Europe may also benefit indirectly from President Trump's stance on wind energy. The U.S. offshore wind sector has seen a sharp downturn, with the International Energy Agency slashing its 2030 forecast for the country by over 50%. Reduced American demand for vessels, components, and services could lead to lower prices for European operators.
Despite the plan's potential, the path forward is complex. European governments must develop intricate new regulations to align different national subsidy programs and power market rules—a process that could take years and face political opposition.
The cost of transitioning to renewables remains a contentious issue in Europe. However, forecasting these costs is difficult, and the same uncertainty applies to fossil fuels, which are subject to volatile global prices. While offshore wind requires significant upfront investment, its long-term operating costs are generally lower. In contrast, gas-fired plants are cheaper to build but remain exposed to price shocks.
Critically, debates over the cost of renewables often overlook the cost of inaction. Europe's power demand is projected to nearly double by 2050, requiring massive investment to upgrade and expand aging grids regardless of the energy source. Delaying this work will only make it more expensive.
Ultimately, this joint offshore wind plan provides a clear path toward greater energy independence and industrial strength. Its success, however, will be measured by its ability to deliver lower, more stable electricity prices for European consumers.
728 RM B 7/F GEE LOK IND BLDG NO 34 HUNG TO RD KWUN TONG KLN HONG KONG


White Label
Data API
Web Plug-ins
Poster Maker
Affiliate Program
The risk of loss in trading financial instruments such as stocks, FX, commodities, futures, bonds, ETFs and crypto can be substantial. You may sustain a total loss of the funds that you deposit with your broker. Therefore, you should carefully consider whether such trading is suitable for you in light of your circumstances and financial resources.
No decision to invest should be made without thoroughly conducting due diligence by yourself or consulting with your financial advisors. Our web content might not suit you since we don't know your financial conditions and investment needs. Our financial information might have latency or contain inaccuracy, so you should be fully responsible for any of your trading and investment decisions. The company will not be responsible for your capital loss.
Without getting permission from the website, you are not allowed to copy the website's graphics, texts, or trademarks. Intellectual property rights in the content or data incorporated into this website belong to its providers and exchange merchants.
Not Logged In
Log in to access more features


Log In
Sign Up


