• Trade
  • Markets
  • Copy
  • Contests
  • News
  • 24/7
  • Calendar
  • Q&A
  • Chats
Screeners
SYMBOL
LAST
ASK
BID
HIGH
LOW
NET CHG.
%CHG.
SPREAD
SPX
S&P 500 Index
6985.39
6985.39
6985.39
6988.81
6958.82
+35.16
+ 0.51%
--
DJI
Dow Jones Industrial Average
49087.45
49087.45
49087.45
49157.80
48894.61
-324.94
-0.66%
--
IXIC
NASDAQ Composite Index
23840.04
23840.04
23840.04
23850.55
23694.38
+238.69
+ 1.01%
--
USDX
US Dollar Index
96.050
96.130
96.050
97.060
95.950
-0.780
-0.81%
--
EURUSD
Euro / US Dollar
1.19760
1.19768
1.19760
1.19898
1.18502
+0.00967
+ 0.81%
--
GBPUSD
Pound Sterling / US Dollar
1.37778
1.37789
1.37778
1.37907
1.36636
+0.00998
+ 0.73%
--
XAUUSD
Gold / US Dollar
5088.98
5089.32
5088.98
5102.90
5013.05
+78.71
+ 1.57%
--
WTI
Light Sweet Crude Oil
61.804
61.834
61.804
61.863
60.054
+1.056
+ 1.74%
--

Community Accounts

Signal Accounts
--
Profit Accounts
--
Loss Accounts
--
View More

Become a signal provider

Sell trading signals to earn additional income

View More

Guide to Copy Trading

Get started with ease and confidence

View More

Signal Accounts for Members

All Signal Accounts

Best Return
  • Best Return
  • Best P/L
  • Best MDD
Past 1W
  • Past 1W
  • Past 1M
  • Past 1Y

All Contests

  • All
  • Trump Updates
  • Recommend
  • Stocks
  • Cryptocurrencies
  • Central Banks
  • Featured News
Top News Only
Share

MSCI's Nordic Countries Index Rose 0.6%, Marking Its Sixth Consecutive Day Of Gains, Closing At 395.00 Points, A New Closing High In At Least A Year. Among The Ten Sectors, The Nordic Financial Sector Saw The Largest Gains. Epiroc Ab, A Supplier Of Construction And Mining Machinery, Led The Pack Among Nordic Stocks, Rising 4.1%

Share

Euro Up 0.88% At $1.1985

Share

USA Dollar Index At Near Four-Year Low, Last Down 0.95% At 96.17

Share

National Association Of Cereal Exporters - Brazil Corn Exports Seen Reaching 3.39 Million Tonnes In January Versus 3.45 Million Tonnes In The Previous Week

Share

National Association Of Cereal Exporters - Brazil Soymeal Exports Seen Reaching 1.78 Million Tonnes In January Versus 1.82 Million Tonnes In The Previous Week

Share

National Association Of Cereal Exporters - Brazil Soy Exports Seen Reaching 3.23 Million Tonnes In January Versus 3.79 Million Tonnes In The Previous Week

Share

Petrobras Executives: Entering Venezuela Could Be An Alternative

Share

Boeing CEO: Trump Administration Understands Importance Of Commercial Aerospace Industry To US Economy

Share

ICE Arabica Coffee Futures Rise More Than 3% To $3.6730 Per Lb

Share

Vortexa: US Gulf Coast Oil, LNG Exports Hit Zero On Sunday Due To Freeze

Share

Iranian President Speaks With Saudi Crown Prince By Phone

Share

[Investors Bet On Sinbaum's Ability To Protect Mexican Peso From Trump Impact] Investors Are Betting That Mexican President Claudia Sinbaum's Ability To Resolve The Dispute With US President Donald Trump Will Help Extend One Of The Best-performing Currencies In Emerging Markets This Year. The Mexican Peso Has Benefited From Carry Trades, A Weaker Dollar, And Soaring Commodity Prices, Accumulating A Gain Of Over 4% This Year. Jason Schenker, President Of Prestige Economics, Which Topped Bloomberg's Fourth-quarter Peso Exchange Rate Forecasts, Believes That If Trade Negotiations Yield Unexpectedly Positive Results, The Peso Could "very Easily" Surge To 16 To The Dollar, And Even Break The 15 Mark Within The Next 12-18 Months

Share

Armenia And Azerbaijan Agree On Rail Transit Of LNG And Bitumen Via Azerbaijani Territory, Tass Reports

Share

WTO: Members Consider Request For Panel To Examine Indian Measures On Batteries, E-Vehicles

Share

[EU Warns Against Over-Reliance On US Gas After Phase-out Of Russian Gazette] Teresa Ribera, The EU's Competition Chief, Warned Via Rte Radio That The EU Should Not Become Overly Reliant On US Liquefied Natural Gas (LNG) Imports As It Seeks To Diversify Its Energy Basket. Since The Russia-Ukraine Conflict, The EU Has Replaced Some Of Its Lost Russian Gas Supply With US LNG And Faces Pressure To Increase Purchases. According To The Institute For Energy Economics And Financial Analysis (IEEFA), If Europe Fulfills All Its US LNG Supply Agreements, 80% Of Its Total Imports Could Come From The US By 2030, Compared To 57% In 2025

Share

US Senate Democratic Leader Schumer: $17.2 Billion New York City Tunnel Project In Jeopardy After Trump Administration Suspended Funding In October

Share

Brazil's Real Strengthens 1% Versus USA Dollar In Spot Trading

Share

Dollar/Yen Down 0.8% At 152.92

Share

Sterling Up 0.8% At $1.3787, Its Strongest Since October 2021

Share

Sovecon Agriculture Consultancy Says It Has Raised Its 2025/26 Russian Wheat Export Forecast By 1.1 Million Metric Tons (Mmt) To 45.7 Mmt

TIME
ACT
FCST
PREV
Mexico Unemployment Rate (Not SA) (Dec)

A:--

F: --

P: --

Canada National Economic Confidence Index

A:--

F: --

P: --

U.S. Non-Defense Capital Durable Goods Orders MoM (Excl. Aircraft) (Nov)

A:--

F: --

P: --
U.S. Durable Goods Orders MoM (Excl. Defense) (SA) (Nov)

A:--

F: --

P: --
U.S. Durable Goods Orders MoM (Excl.Transport) (Nov)

A:--

F: --

P: --

U.S. Durable Goods Orders MoM (Nov)

A:--

F: --

P: --
U.S. Chicago Fed National Activity Index (Nov)

A:--

F: --

P: --
U.S. Dallas Fed New Orders Index (Jan)

A:--

F: --

P: --

U.S. Dallas Fed General Business Activity Index (Jan)

A:--

F: --

P: --
U.S. 2-Year Note Auction Avg. Yield

A:--

F: --

P: --

U.K. BRC Shop Price Index YoY (Jan)

A:--

F: --

P: --

China, Mainland Industrial Profit YoY (YTD) (Dec)

A:--

F: --

P: --

Germany 2-Year Schatz Auction Avg. Yield

A:--

F: --

P: --

Mexico Trade Balance (Dec)

A:--

F: --

P: --

U.S. Weekly Redbook Index YoY

A:--

F: --

P: --

U.S. S&P/CS 20-City Home Price Index YoY (Not SA) (Nov)

A:--

F: --

P: --

U.S. S&P/CS 20-City Home Price Index MoM (SA) (Nov)

A:--

F: --

P: --
U.S. FHFA House Price Index MoM (Nov)

A:--

F: --

P: --

U.S. FHFA House Price Index (Nov)

A:--

F: --

P: --

U.S. FHFA House Price Index YoY (Nov)

A:--

F: --

P: --
U.S. S&P/CS 10-City Home Price Index YoY (Nov)

A:--

F: --

P: --

U.S. S&P/CS 10-City Home Price Index MoM (Not SA) (Nov)

A:--

F: --

P: --

U.S. S&P/CS 20-City Home Price Index (Not SA) (Nov)

A:--

F: --

P: --

U.S. S&P/CS 20-City Home Price Index MoM (Not SA) (Nov)

A:--

F: --

P: --

U.S. Richmond Fed Manufacturing Composite Index (Jan)

A:--

F: --

P: --

U.S. Conference Board Present Situation Index (Jan)

A:--

F: --

P: --

U.S. Conference Board Consumer Expectations Index (Jan)

A:--

F: --

P: --

U.S. Richmond Fed Manufacturing Shipments Index (Jan)

A:--

F: --

P: --

U.S. Richmond Fed Services Revenue Index (Jan)

A:--

F: --

P: --

U.S. Conference Board Consumer Confidence Index (Jan)

A:--

F: --

P: --
U.S. 5-Year Note Auction Avg. Yield

--

F: --

P: --

U.S. API Weekly Refined Oil Stocks

--

F: --

P: --

U.S. API Weekly Crude Oil Stocks

--

F: --

P: --

U.S. API Weekly Gasoline Stocks

--

F: --

P: --

U.S. API Weekly Cushing Crude Oil Stocks

--

F: --

P: --

Australia RBA Trimmed Mean CPI YoY (Q4)

--

F: --

P: --

Australia CPI YoY (Q4)

--

F: --

P: --

Australia CPI QoQ (Q4)

--

F: --

P: --

Germany GfK Consumer Confidence Index (SA) (Feb)

--

F: --

P: --

Germany 10-Year Bund Auction Avg. Yield

--

F: --

P: --

India Industrial Production Index YoY (Dec)

--

F: --

P: --

India Manufacturing Output MoM (Dec)

--

F: --

P: --

U.S. MBA Mortgage Application Activity Index WoW

--

F: --

P: --

Canada Overnight Target Rate

--

F: --

P: --

BOC Monetary Policy Report
U.S. EIA Weekly Crude Stocks Change

--

F: --

P: --

U.S. EIA Weekly Cushing, Oklahoma Crude Oil Stocks Change

--

F: --

P: --

U.S. EIA Weekly Crude Demand Projected by Production

--

F: --

P: --

U.S. EIA Weekly Crude Oil Imports Changes

--

F: --

P: --

U.S. EIA Weekly Heating Oil Stock Changes

--

F: --

P: --

U.S. EIA Weekly Gasoline Stocks Change

--

F: --

P: --

BOC Press Conference
Russia PPI MoM (Dec)

--

F: --

P: --

Russia PPI YoY (Dec)

--

F: --

P: --

U.S. Target Federal Funds Rate Lower Limit (Overnight Reverse Repo Rate)

--

F: --

P: --

U.S. Interest Rate On Reserve Balances

--

F: --

P: --

U.S. Federal Funds Rate Target

--

F: --

P: --

U.S. Target Federal Funds Rate Upper Limit (Excess Reserves Ratio)

--

F: --

P: --

FOMC Statement
FOMC Press Conference
Brazil Selic Interest Rate

--

F: --

P: --

Q&A with Experts
    • All
    • Chatrooms
    • Groups
    • Friends
    REETRADER flag
    Size
    The market’s really watching their language and hints more than just the numbers themselves.@REETRADER
    @Size for now the dollar is in mixed of a diverse battle , any wrong move or hint can be bad
    Size flag
    Let’s see how the market reacts once the Fed speaks it could still surprise us a bit.@REETRADER
    Size flag
    Coolx
    @CoolxA rising wedge could signal a potential reversal if it breaks down
    REETRADER flag
    Size
    Let’s see how the market reacts once the Fed speaks it could still surprise us a bit.@REETRADER
    @Size the fed will be speaking 30min after ba
    EuroTrader flag
    Coolx
    @Coolxall good mate i did not really get my ideal trade setup on the gold market today
    Size flag
    What time frame are you seeing that rising wedge on?@Coolx
    Coolx flag
    Size
    @Sizeyeah correct buddy
    Size flag
    REETRADER
    @REETRADERThe dollar’s in a delicate spot one wrong hint or unexpected move could trigger big swings.
    Coolx flag
    EuroTrader
    @EuroTraderahh you missed it brother two major setups already been completed
    Size flag
    Patience and careful observation are key right now.
    EuroTrader flag
    REETRADER
    @REETRADER yeahh but they should be done by 2:30 NY time brother
    Size flag
    Coolx
    @Coolxso it’s worth watching the support levels closely before taking any trades.
    EuroTrader flag
    Coolx
    @Coolxi am yet too see a snapshot of the chart you are highlighting
    REETRADER flag
    EuroTrader
    @EuroTrader gmt
    Size flag
    REETRADER
    @REETRADERYeah, perfect time to watch how the market positions itself and get ready for any volatility.
    "EuroTrader" recalled a message
    EuroTrader flag
    REETRADER
    @REETRADER in nigerian time that will be around 8:30 pm GMT+1
    ANDY flag
    @Sarkar
    EuroTrader flag
    Coolx
    @Coolx gold has been really choppy since the open today not mudh price runs
    EuroTrader flag
    @Coolxwhich opportunity did you see was it the longs or the sells
    Type here...
    Add Symbol or Code

      No matching data

      All
      Trump Updates
      Recommend
      Stocks
      Cryptocurrencies
      Central Banks
      Featured News
      • All
      • Russia-Ukraine Conflict
      • Middle East Flashpoint
      • All
      • Russia-Ukraine Conflict
      • Middle East Flashpoint
      Search
      Products

      Charts Free Forever

      Chats Q&A with Experts
      Screeners Economic Calendar Data Tools
      Membership Features
      Data Warehouse Market Trends Institutional Data Policy Rates Macro

      Market Trends

      Market Sentiment Order Book Forex Correlations

      Top Indicators

      Charts Free Forever
      Markets

      News

      News Analysis 24/7 Columns Education
      From Institutions From Analysts
      Topics Columnists

      Latest Views

      Latest Views

      Trending Topics

      Top Columnists

      Latest Update

      Signals

      Copy Rankings Latest Signals Become a signal provider AI Rating
      Contests
      Brokers

      Overview Brokers Assessment Rankings Regulators News Claims
      Broker listing Forex Brokers Comparison Tool Live Spread Comparison Scam
      Q&A Complaint Scam Alert Videos Tips to Detect Scam
      More

      Business
      Events
      Careers About Us Advertising Help Center

      White Label

      Data API

      Web Plug-ins

      Affiliate Program

      Awards Institution Evaluation IB Seminar Salon Event Exhibition
      Vietnam Thailand Singapore Dubai
      Fans Party Investment Sharing Session
      FastBull Summit BrokersView Expo
      Recent Searches
        Top Searches
          Markets
          News
          Analysis
          User
          24/7
          Economic Calendar
          Education
          Data
          • Names
          • Latest
          • Prev

          View All

          No data

          Scan to Download

          Faster Charts, Chat Faster!

          Download App
          English
          • English
          • Español
          • العربية
          • Bahasa Indonesia
          • Bahasa Melayu
          • Tiếng Việt
          • ภาษาไทย
          • Français
          • Italiano
          • Türkçe
          • Русский язык
          • 简中
          • 繁中
          Open Account
          Search
          Products
          Charts Free Forever
          Markets
          News
          Signals

          Copy Rankings Latest Signals Become a signal provider AI Rating
          Contests
          Brokers

          Overview Brokers Assessment Rankings Regulators News Claims
          Broker listing Forex Brokers Comparison Tool Live Spread Comparison Scam
          Q&A Complaint Scam Alert Videos Tips to Detect Scam
          More

          Business
          Events
          Careers About Us Advertising Help Center

          White Label

          Data API

          Web Plug-ins

          Affiliate Program

          Awards Institution Evaluation IB Seminar Salon Event Exhibition
          Vietnam Thailand Singapore Dubai
          Fans Party Investment Sharing Session
          FastBull Summit BrokersView Expo

          EU's Energy Warning: Don't Swap Russian Gas for US LNG

          King Ten

          Energy

          Remarks of Officials

          Commodity

          Political

          Russia-Ukraine Conflict

          Economic

          Summary:

          Europe warns against replacing Russian gas dependency with over-reliance on US LNG, urging diverse, secure energy.

          The European Union’s competition chief has issued a sharp warning against becoming overly dependent on liquefied natural gas (LNG) from the United States as the bloc works to secure its energy future.

          "We know that we cannot rely on Russian gas, and that we should pay attention not to rely too much on American gas," Teresa Ribera said in a radio interview on Tuesday.

          This cautionary stance comes as Europe rapidly pivots away from its former primary supplier, Russia, following the invasion of Ukraine.

          The Scale of the Shift to US Energy

          To replace lost volumes of Russian gas, European nations have increasingly turned to US LNG. This shift is solidified by a major trade agreement with Washington, which includes a commitment to purchase $750 billion in American energy by 2028.

          The momentum is significant. A recent report from the Institute for Energy Economics and Financial Analysis (IEEFA) projected that if current supply deals are fulfilled and gas demand reduction efforts lag, the US could account for as much as 80% of Europe's gas imports by 2030. This would be a substantial increase from a projected 57% in 2025.

          Even as the EU diversifies, Russia remains a key player, currently providing about 15% of the bloc's LNG supplies and standing as its second-largest provider after the United States.

          Concerns Over a New Dependency

          Top officials are openly cautioning that trading one dependency for another is not a sustainable long-term strategy.

          "One of the reasons why we need to produce much more of our own energy is that it is not good to be reliant on any country in the world fundamentally for our energy supply," EU energy chief Dan Jorgensen told reporters. He added, "we need to be very careful that now we're moving out of Russian energy, that we're not replacing that dependency with other dependencies."

          These concerns are amplified by geopolitical uncertainties. Past actions by former US President Donald Trump, including his interest in Greenland's mining rights and threats of tariffs against European nations, serve as a reminder of the political risks associated with over-reliance on a single partner.

          Europe's Broader Energy Strategy

          The EU's overarching goal remains a complete phaseout of Russian gas. To achieve true energy security, the bloc is focused on a two-pronged approach: seeking a diverse range of alternative suppliers while simultaneously accelerating its own transition to renewable energy.

          This strategy is designed not only to secure its energy supply chain but also to meet the continent's ambitious climate target of achieving zero emissions by 2050.

          To stay updated on all economic events of today, please check out our Economic calendar
          Risk Warnings and Disclaimers
          You understand and acknowledge that there is a high degree of risk involved in trading. Following any strategies or investment methods may lead to potential losses. The content on the site is provided by our contributors and analysts for information purposes only. You are solely responsible for determining whether any trading assets, securities, strategy, or any other product is suitable for investing based on your own investment objectives and financial situation.
          Add to Favorites
          Share

          Hungary Keeps Interest Rate at 6.5% Amid Stubborn Inflation

          Michael Ross

          Data Interpretation

          Central Bank

          Remarks of Officials

          Economic

          Traders' Opinions

          Forex

          The National Bank of Hungary has held its benchmark interest rate at 6.5%, opting for a wait-and-see approach as it looks for more conclusive evidence that slowing inflation is sustainable.

          This marks the 16th consecutive month the rate has remained unchanged, tying with Romania for the highest in the European Union. The decision, announced on Tuesday, was in line with the forecasts of 22 out of 23 economists surveyed by Bloomberg.

          A Cautious Shift in Monetary Policy

          Hungary's central bank recently adjusted its policy guidance. After previously ruling out rate cuts, policymakers now state that decisions will be made on a meeting-by-meeting basis, driven entirely by incoming economic data. The bank's projections indicate that inflation is expected to return to its 3% target, plus or minus a one percentage point tolerance band, over the monetary policy horizon.

          However, despite headline inflation slowing in December and moving closer to the target, officials remain cautious. Deputy Governor Zoltan Kurali highlighted a key concern on January 14, pointing to "stubborn" price increases in the services sector, a critical indicator of underlying inflation expectations.

          At an annual rate of 6.8%, services inflation was more than double the headline figure last month. Kurali noted that policymakers would need "a lot of conviction" before they could begin cutting rates.

          All Eyes on February Inflation Data

          With the central bank holding firm for now, market focus is shifting to the next policy meeting in February. A crucial factor in that decision will be the January inflation report, scheduled for release by the statistics office on February 12.

          This data will provide the first clear picture of how businesses, particularly in the services industry, have repriced their offerings at the start of the new year.

          Market Expectations and Currency Headwinds

          Money market traders are already positioning for a change in policy. According to forward rate agreements, investors are anticipating one or two quarter-point rate cuts within the next three months, with the first potentially coming as soon as February.

          Adding another layer to the bank's decision-making is the strength of the Hungarian forint. The currency is trading near a two-year high against the euro, buoyed by a broader emerging-market rally and a weaker U.S. dollar. A stronger forint helps to lower the cost of imported goods, including energy, which eases inflationary pressures and gives the central bank more room to consider rate cuts.

          This economic maneuvering occurs ahead of parliamentary elections scheduled for April 12, where Prime Minister Viktor Orban's party is reportedly trailing in most polls after 16 years in power.

          To stay updated on all economic events of today, please check out our Economic calendar
          Risk Warnings and Disclaimers
          You understand and acknowledge that there is a high degree of risk involved in trading. Following any strategies or investment methods may lead to potential losses. The content on the site is provided by our contributors and analysts for information purposes only. You are solely responsible for determining whether any trading assets, securities, strategy, or any other product is suitable for investing based on your own investment objectives and financial situation.
          Add to Favorites
          Share

          The New Middle East: Two Blocs Compete Beyond Iran

          Isaac Bennett

          Palestinian-Israeli conflict

          Energy

          Middle East Situation

          Political

          Economic

          Recent headlines about Iran’s internal turmoil and potential military confrontations obscure a more fundamental shift in the Middle East. Tehran is no longer the primary force shaping the region’s strategic direction. Instead, a new era is dawning, defined by competition between two emerging coalitions: an Abrahamic bloc and an Islamic bloc. The evolution of this rivalry—not Iran's next move—will determine the future of the region and America's role within it.

          The Rise of the Abrahamic Coalition

          Though not yet a formal alliance, the first bloc is becoming increasingly coherent. Centered on Israel and the United Arab Emirates, this group extends to include Morocco, Greece, and even India. This coalition aims to reconfigure the region through a combination of military power, technological partnership, and economic integration.

          Core members believe the existing Middle Eastern order has failed to stop militant Islam, whether the Shiite version backed by Iran or the Sunni variant supported by Turkey and Qatar. They argue that true stability can only be achieved by intervening in regional conflicts to support more secular forces. Capitalizing on President Donald Trump's push to broaden the Abraham Accords, these nations are prioritizing the expansion of Arab-Israeli normalization, regardless of progress on Palestinian self-determination or a two-state solution.

          This Abrahamic coalition is gaining momentum. Israel's military operations following the Oct. 7, 2023, Hamas attack have bolstered its deterrence and power projection capabilities. The UAE, known as "Little Sparta," continues to use its economic might and diplomatic agility to expand its influence far beyond the Gulf. United Nations experts and international NGOs suspect the UAE of supplying weapons to the Rapid Support Forces in Sudan, the Southern Transitional Council in Yemen, and Libyan strongman Khalifa Haftar.

          Greece has become a vital partner in the Eastern Mediterranean, collaborating with Israel on military drills and energy projects to counter their shared competitor, Turkey. Further east, India’s growing ties with both Israel and the UAE—through bilateral agreements and multilateral platforms like I2U2 and the India-Middle East-Europe Economic Corridor—give the bloc strategic depth far beyond the region itself.

          The Islamic Bloc Forms a Counterweight

          Opposing the Abrahamic axis is the Islamic coalition, a counterbalancing effort led by Saudi Arabia and including Turkey, Pakistan, Qatar, and a more cautious Egypt. These nations view the Israel-UAE axis as a source of instability, arguing that its support for separatist groups worsens fragmentation in conflict zones. They see the narrative of pushing back against Islamists as a self-serving excuse to project power.

          This group prefers to preserve and operate within existing structures, however flawed. In Yemen, Sudan, and elsewhere, they are backing weak states struggling to maintain sovereignty and territorial integrity.

          Over the past year, Saudi Arabia has bolstered its defense relationship with Pakistan, creating a mutual security pact after an Israeli airstrike on Qatar. Its military cooperation with Turkey has also grown, with a more formal defense agreement seemingly on the horizon. Egypt, concerned by Israeli and Emirati activities in the Horn of Africa, is also discussing closer coordination with Riyadh on Sudan and Somalia. Together, these states are forming a loose but expanding counterweight across the region.

          The Saudi-UAE Rivalry at the Center

          At the heart of this realignment is the most critical bilateral rift in the Middle East today: the escalating rivalry between Saudi Arabia and the UAE. Once close partners, the two Gulf powers are now strategic competitors. This divergence was highlighted in Yemen, where Saudi Arabia struck the Port of Mukalla to stop Emirati arms shipments, ultimately forcing a UAE withdrawal.

          If left unchecked, this competition could escalate from proxy conflicts to direct confrontation. Threats of airspace restrictions, border closures, and even a UAE withdrawal from Saudi-led institutions like OPEC+ have already been voiced by senior officials. Such moves, once unthinkable, would disrupt energy markets, regional travel, and cross-border business. While Gulf diplomacy has contained the friction so far, the underlying divide is structural, not merely personal.

          U.S. Strategy in a New Regional Order

          This new competition complicates a key U.S. foreign policy goal: Saudi-Israeli normalization. Riyadh still sees the value in a deal that would grant it a U.S. security treaty in exchange for integrating Israel into the region. However, without significant changes in Israeli policy, especially regarding Gaza and the West Bank, the kingdom is more likely to align with Turkey and Pakistan than with Israel.

          For the United States, the primary challenge is no longer countering an Iranian regime that appears critically weakened. The new task is managing the damaging rivalries among its own partners to prevent further fragmentation. This is made more difficult by divisions within Washington, where officials reportedly have diverging views and independent business interests in the region, leading to a hands-off approach.

          To achieve a breakthrough, the Trump administration must take two steps. First, it needs to actively manage the rivalries among its partners and its own aides, perhaps by appointing a special envoy to coordinate a unified regional strategy. Second, it must preserve a viable path to Saudi-Israeli normalization by influencing political outcomes in Jerusalem after upcoming elections. The next Israeli government cannot be beholden to radical elements opposed to Palestinian self-determination.

          Saudi Arabia is the Middle East's crucial swing state. A senior Saudi official described the kingdom's policy as pragmatic, guided by "maximum flexibility at a time of maximum uncertainty." If President Trump can secure Saudi-Israeli normalization, he could steer Riyadh and the wider region away from its current path of rivalry. This would fold both coalitions into a broader American-led framework, stabilizing the post-Iran Middle East for decades to come.

          To stay updated on all economic events of today, please check out our Economic calendar
          Risk Warnings and Disclaimers
          You understand and acknowledge that there is a high degree of risk involved in trading. Following any strategies or investment methods may lead to potential losses. The content on the site is provided by our contributors and analysts for information purposes only. You are solely responsible for determining whether any trading assets, securities, strategy, or any other product is suitable for investing based on your own investment objectives and financial situation.
          Add to Favorites
          Share

          Markets Today: EU/India Reach Trade Deal, Gold Holds Highs, Puma Soars 19%, FTSE 100 Eyes Further Gains

          Adam

          Economic

          EU/India Reach Trade Deal

          goods. The goal is to increase trade between the two regions and rely less on the United States.
          Key points of the deal:
          Benefits for the EU: The deal removes or lowers taxes on almost 97% of European goods sold to India. This is expected to double EU exports to India by 2032 and save European companies about €4 billion ($4.75 billion).
          Benefits for India: Over the next seven years, the EU will cut import taxes on 99.5% of goods coming from India. Taxes will drop to zero for Indian seafood, leather, clothes, chemicals, rubber, metals, and jewelry.
          What is excluded: Farming products such as soy, beef, sugar, rice, and dairy are not included in this agreement.
          The trade negotiations between the EU and India, which had dragged on for twenty years, finally sped up after the United States imposed a 50% tax on certain Indian goods. This urgency was further driven by US allies reacting to President Trump’s tariff threats and his controversial attempt to buy Greenland.
          In response to this global tension, Canadian Prime Minister Mark Carney recently gave a popular speech urging medium-sized countries to band together for protection. He now plans to visit India to sign new agreements on uranium, energy, and minerals.
          Economically, the EU has established itself as India’s top partner. Last year, trade between the two reached $136.5 billion, surpassing India’s trade with both the United States ($132 billion) and China ($128 billion).
          According to an Indian government official, lawyers will spend the next five to six months reviewing the final details of the agreement. Once that legal check is complete, the deal will be formally signed and is expected to be fully in action within a year.

          European Session - Puma Soars 19%

          European stock markets rose on Tuesday, driven by good news from major companies that helped calm fears about global trade tensions.
          The main European index, the STOXX 600, increased by 0.34% early in the day. This rise highlights how investors are currently relying more on specific company updates rather than general economic news to guide their decisions during these uncertain times.
          Several companies saw significant gains. Puma’s stock soared 19%, its highest level since last March after the Chinese company Anta Sports bought a 29% stake in the business for €1.5 billion ($1.8 billion).
          This deal is expected to boost Puma's sales in the massive Chinese market. Additionally, shares in the Swiss pharmaceutical company Roche rose nearly 1% after it announced successful trial results for a new weekly weight-loss drug.
          On the political front, markets remain worried about the long-term stability of global trade. These concerns persist because US President Donald Trump has threatened to raise taxes on cars from South Korea and other imports, citing delays in a trade deal signed last year.
          On the FX front, the US dollar rose slightly on Tuesday but struggled to build significant momentum as traders remained cautious. Markets are on high alert for potential government intervention from the US and Japan to stabilize currency rates, and investors are waiting for the Federal Reserve's interest rate decision on Wednesday.
          This caution has helped the yen steady in the 153 to 154 range, a solid recovery from its recent low of 159.23. By the end of trading, the dollar was up about 0.4% against the yen at 154.75.
          Broader measures of the dollar showed a 0.2% increase, marking its first gain in four days, though it is still down about 1% since the start of the year. Other major currencies pulled back slightly from recent highs.
          The euro dropped 0.2% to $1.1855, and the British pound dipped marginally to $1.3668, though both remain close to their four-month peaks.
          Similarly, the Australian dollar slipped slightly but stayed near its highest level in 16 months.
          Currency Power Balance
          Markets Today: EU/India Reach Trade Deal, Gold Holds Highs, Puma Soars 19%, FTSE 100 Eyes Further Gains_1
          Gold prices rose on Tuesday, hovering just below the $5,100 milestone that was reached for the first time yesterday. Market participants are flocking to the metal as a safety net due to growing uncertainty surrounding US President Donald Trump’s policies.
          As of late morning, the spot price of gold had climbed 1.6% to $5,092.09 per ounce, staying close to the all-time high of $5,110.50 set on Monday. US gold futures for February also posted a small gain.
          It was also a volatile day for other precious metals. Silver jumped 8.4% to trade at $112.57 per ounce. This follows a record high of $117.69 on Monday, meaning silver has already surged by over 50% just since the start of the year.
          Meanwhile, platinum fell 2.5% to $2,689.12 per ounce after hitting a record high yesterday, whereas palladium saw a gain of 3.3%, rising to $2,048.28.
          Oil prices rose slightly on Tuesday after a massive winter storm struck the US Gulf Coast, disrupting oil production and refineries.
          However, the price increase was limited because oil supply from Kazakhstan has started flowing again. Brent crude increased by 23 cents to $65.82 a barrel, while US West Texas Intermediate rose by 29 cents to $60.92. The severe weather has strained power grids and energy infrastructure across the US.
          Experts estimate that over the weekend, American oil producers lost about 2 million barrels per day, which is roughly 15% of the country's total output.

          Economic Calendar and Final Thoughts

          Data is largely thin today with Geopolitical developments likely to remain key. Greenland, tariffs, US-Iran among other discussions may be key drivers today.
          There is also a host of US companies reporting earnings today which could also stoke volatility. The only US data of note is the weekly ADP jobs numbers. Barring a negative print here, the DXY can work its way higher and potentially fill Monday's gap to 97.42.
          Markets Today: EU/India Reach Trade Deal, Gold Holds Highs, Puma Soars 19%, FTSE 100 Eyes Further Gains_2

          Chart of the Day - FTSE 100

          From a technical perspective, the FTSE 100 index has bounced off the 100-day MA on the four-hour timeframe.
          This puts the index looking like it is on its way to fresh highs once more.
          Immediate resistance rests at 10243 with a break above eyeing the 10277 handle before the 10300 handle comes into focus.
          A move lower here may find support at 10178 before the psychological 10000 handle and the 200-day MA at 9973 comes into focus.
          FTSE 100 Index Daily Chart, January 27, 2026
          Markets Today: EU/India Reach Trade Deal, Gold Holds Highs, Puma Soars 19%, FTSE 100 Eyes Further Gains_3

          Source: marketpulse

          To stay updated on all economic events of today, please check out our Economic calendar
          Risk Warnings and Disclaimers
          You understand and acknowledge that there is a high degree of risk involved in trading. Following any strategies or investment methods may lead to potential losses. The content on the site is provided by our contributors and analysts for information purposes only. You are solely responsible for determining whether any trading assets, securities, strategy, or any other product is suitable for investing based on your own investment objectives and financial situation.
          Add to Favorites
          Share

          Why Silver's Epic Rally Is Built on Shaky Ground

          Catherine Richards

          Central Bank

          Commodity

          Political

          Economic

          Traders' Opinions

          Forex

          China–U.S. Trade War

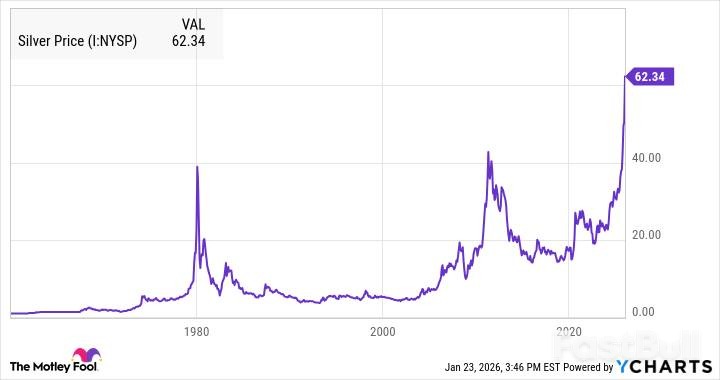
          While many investors focus on big tech, the precious metals sector has delivered stunning returns, with silver leading the charge. Prices for the metal have soared by an incredible 240% over the last 12 months, driven by supply concerns from China and political uncertainty in the U.S.

          This month, silver prices topped $100 per ounce for the first time ever. But before jumping into the frenzy, it's worth examining the drivers behind this rally and why history suggests it may not be sustainable.

          What's Driving the Record-High Silver Price?

          The current surge in silver's value isn't based on a single factor but a combination of geopolitical tensions, currency weakness, and supply chain fears.

          Geopolitical Risk and a Weaker Dollar

          A primary catalyst is growing geopolitical turmoil. The Trump administration's unpredictable trade policy, which has imposed tariffs ranging from 10% to 50% on most of the world, has rattled international investors. This uncertainty is raising questions about the U.S. dollar's long-term stability as the world's primary reserve currency.

          Reflecting this sentiment, the U.S. dollar index, which measures the greenback against other major currencies, has fallen nearly 10% in the past year, signaling that some investors are moving their capital elsewhere.

          Further eroding confidence in the dollar are concerns over rising deficit spending and the independence of the central bank. President Trump has repeatedly pressured Federal Reserve Chairman Jerome Powell to lower interest rates. While Powell has resisted, these confrontations risk reducing trust in the U.S. monetary system.

          China's Export Policy Stokes Supply Fears

          Adding to the momentum, China announced new export restrictions that fueled market anxiety. Under the policy, only 44 companies will be permitted to export silver from 2026 to 2027.

          However, the real-world impact of this announcement may be limited. According to Bloomberg, a similar licensing system has been active since 2019 without causing any significant supply bottlenecks. Furthermore, China’s silver exports reached 5,100 tons last year—the highest volume in 16 years—suggesting that supply remains robust for now.

          A Familiar Story: Silver's History of Booms and Busts

          Over the last century, silver has experienced several massive speculative rallies, all of which ultimately ended in a crash. The current situation bears a striking resemblance to previous cycles.

          Echoes of the 2011 Price Collapse

          The most recent boom and bust occurred in 2011, following the Great Recession. The drivers then were remarkably similar to today's: macroeconomic anxiety fueled by the first-ever U.S. credit rating downgrade, the eurozone debt crisis, and fears of runaway inflation.

          That rally, however, was short-lived. After its peak, silver's price collapsed, shedding approximately 70% of its value by 2015 before beginning the slow climb that led to the current surge.

          Figure 1: The historical price of silver shows a recurring pattern of sharp peaks followed by significant corrections, such as the spike around 2011 and the subsequent downturn leading into the mid-2010s.

          The Industrial Demand Problem

          Speculative rallies often lose steam because they are fueled by hype rather than sustainable, fundamental demand. For silver, industrial use is a critical and often overlooked factor.

          Industrial applications account for about 59% of all silver consumption, with major demand coming from the solar and electric vehicle (EV) industries, which value its high conductivity.

          Cheaper Metals Poised to Replace Silver

          When silver prices rise to uneconomical levels, manufacturers begin substituting it with cheaper alternatives like copper or aluminum. This trend is already underway.

          Bloomberg recently reported that major Chinese solar cell manufacturer LONGi Green Energy Technology has started replacing silver with base metals to cut costs. This shift is likely to continue across other industries until silver prices return to more reasonable levels. In the long run, high prices will also incentivize increased mining output, further boosting supply and putting downward pressure on prices.

          What Should Investors Do Now?

          When a commodity price hits unprecedented highs, it’s easy to believe that "this time is different." But history shows it rarely is. Silver, much like crude oil and cobalt, has a long record of boom-and-bust cycles.

          The current rally appears driven by speculation that will likely fade as market hype subsides and industrial users shift to alternatives. For now, investors should consider taking profits or avoiding new positions in this volatile market.

          To stay updated on all economic events of today, please check out our Economic calendar
          Risk Warnings and Disclaimers
          You understand and acknowledge that there is a high degree of risk involved in trading. Following any strategies or investment methods may lead to potential losses. The content on the site is provided by our contributors and analysts for information purposes only. You are solely responsible for determining whether any trading assets, securities, strategy, or any other product is suitable for investing based on your own investment objectives and financial situation.
          Add to Favorites
          Share

          Russia Strikes Odesa Energy as Peace Talks Stall

          Isaac Bennett

          Energy

          Remarks of Officials

          Political

          Russia-Ukraine Conflict

          Daily News

          Russian forces have launched a significant wave of drone strikes across Ukraine, heavily targeting energy infrastructure in the southern port city of Odesa. Ukrainian President Volodymyr Zelenskiy stated the attack directly threatens ongoing diplomatic efforts to end the war.

          The overnight assault involved some 165 drones deployed against cities from Lviv in the west to Kharkiv in the east. The main focus was Odesa, where Zelenskiy reported on social media platform X that over 50 unmanned aerial vehicles struck energy facilities, injuring dozens.

          This strategy appears timed to exploit harsh winter conditions, with freezing temperatures straining heat and water supplies for Ukrainian families. The strikes aim to cripple the nation's already damaged energy system.

          Peace Negotiations Falter Amid Airstrikes

          The attacks coincide with a series of US-brokered peace talks between Russian and Ukrainian negotiators, part of an initiative sought by President Donald Trump. Zelenskiy argued that the Kremlin's actions are undermining the fragile diplomatic process.

          "Every such Russian strike erodes the diplomacy that is still ongoing and undermines the efforts of partners who are helping to end this war," he said, calling for increased pressure on Moscow from the US and European allies. "Without pressure on the aggressor, wars do not stop."

          Negotiations, which began last week in the United Arab Emirates, are set to continue but have yet to produce tangible results. The talks in Abu Dhabi have been described as constructive by Trump officials, particularly because the two sides met face-to-face instead of through intermediaries.

          Key Sticking Points in Negotiations

          Deep disagreements over territorial control remain the primary obstacle. Russia continues to demand that Ukrainian forces withdraw from areas in the eastern Donbas region that its troops have not yet seized. This demand, which covers parts of the Donetsk and Luhansk regions, has been rejected by Zelenskiy.

          Despite the deadlock, the Ukrainian leader has pointed to some progress, especially regarding the establishment of security guarantees from the United States.

          Why Odesa Remains a Critical Target

          Odesa and its surrounding region host vital Black Sea port infrastructure that is essential for Ukraine's grain exports. This strategic importance has made the city a frequent target of Russian attacks since the full-scale invasion began in February 2022.

          According to the national grid operator Ukrenergo, the latest strikes damaged the region's power infrastructure, triggering local blackouts. These power failures add to more than 500 weather-related outages across the country. However, no damage to the port facilities themselves was reported.

          Risk Warnings and Disclaimers
          You understand and acknowledge that there is a high degree of risk involved in trading. Following any strategies or investment methods may lead to potential losses. The content on the site is provided by our contributors and analysts for information purposes only. You are solely responsible for determining whether any trading assets, securities, strategy, or any other product is suitable for investing based on your own investment objectives and financial situation.
          Add to Favorites
          Share

          Saudi Aramco Taps Debt Market with $4B Bond Sale

          Daniel Foster

          Bond

          Energy

          Commodity

          Economic

          Saudi Arabia's state-owned oil giant, Aramco, has successfully issued a $4 billion bond, marking its first entry into the debt market this year. The move comes as global oil prices remain weak, hovering in the low $60s per barrel range.

          The company, which is the world's largest crude exporter, initially announced its plan to issue U.S. dollar-denominated international bonds under its Global Medium Term Note Programme, stating the final amount would depend on market conditions.

          Overwhelming Demand Signals Investor Confidence

          The offering ultimately raised $4 billion through a four-tranche bond that attracted more than $21 billion in orders from investors.

          This exceptionally high demand allowed Aramco to secure more favorable terms. According to market sources, the company was able to offer lower yields compared to benchmark U.S. Treasuries than it had initially guided, reducing its borrowing costs.

          A Pattern of Increased Borrowing

          While this is Aramco's first bond sale of the year, it represents the company's second debt issuance in the last five months, highlighting a growing trend. In September 2025, the oil firm offered Islamic bonds, known as sukuk, with five and ten-year maturities.

          The turn to debt markets follows a period of financial pressure caused by declining oil prices. Lower prices have already reduced Aramco's cash flows, with Q1 figures showing a decline and Q2 results revealing an even larger drop in both cash flow and profits as prices slumped.

          Kingdom's Finances Strained by Oil Price Slump

          Aramco's recent bond sale is part of a broader pattern of increased borrowing by Saudi Arabia as the Kingdom grapples with the financial impact of lower oil revenue. This trend suggests that the country's finances are under strain.

          Other recent debt activities include:

          • Saudi Arabia: The Kingdom sold $5.5 billion in Islamic bonds, which received orders totaling $17.5 billion.

          • Public Investment Fund (PIF): The nation's sovereign wealth fund raised $2 billion by selling 10-year dollar bonds to help finance its investment plans.

          Saudi Arabia’s budget deficit expanded last year as oil prices have remained well below the estimated $90 per barrel the Kingdom needs to balance its budget, prompting both the government and its flagship company to increasingly tap debt markets for funding.

          To stay updated on all economic events of today, please check out our Economic calendar
          Risk Warnings and Disclaimers
          You understand and acknowledge that there is a high degree of risk involved in trading. Following any strategies or investment methods may lead to potential losses. The content on the site is provided by our contributors and analysts for information purposes only. You are solely responsible for determining whether any trading assets, securities, strategy, or any other product is suitable for investing based on your own investment objectives and financial situation.
          Add to Favorites
          Share
          FastBull
          Copyright © 2026 FastBull Ltd

          728 RM B 7/F GEE LOK IND BLDG NO 34 HUNG TO RD KWUN TONG KLN HONG KONG

          TelegramInstagramTwitterfacebooklinkedin
          App Store Google Play Google Play
          Products
          Charts

          Chats

          Q&A with Experts
          Screeners
          Economic Calendar
          Data
          Tools
          Membership
          Features
          Function
          Markets
          Copy Trading
          Latest Signals
          Contests
          News
          Analysis
          24/7
          Columns
          Education
          Company
          Careers
          About Us
          Contact Us
          Advertising
          Help Center
          Feedback
          User Agreement
          Privacy Policy
          Personal Information Protection Statement
          Business

          White Label

          Data API

          Web Plug-ins

          Poster Maker

          Affiliate Program

          Risk Disclosure

          The risk of loss in trading financial instruments such as stocks, FX, commodities, futures, bonds, ETFs and crypto can be substantial. You may sustain a total loss of the funds that you deposit with your broker. Therefore, you should carefully consider whether such trading is suitable for you in light of your circumstances and financial resources.

          No decision to invest should be made without thoroughly conducting due diligence by yourself or consulting with your financial advisors. Our web content might not suit you since we don't know your financial conditions and investment needs. Our financial information might have latency or contain inaccuracy, so you should be fully responsible for any of your trading and investment decisions. The company will not be responsible for your capital loss.

          Without getting permission from the website, you are not allowed to copy the website's graphics, texts, or trademarks. Intellectual property rights in the content or data incorporated into this website belong to its providers and exchange merchants.

          Not Logged In

          Log in to access more features

          Connect Broker
          Become a signal provider
          Help Center
          Customer Service
          Dark Mode
          Price Up/Down Colors

          Log In

          Sign Up

          Position
          Layout
          Fullscreen
          Default to Chart
          The chart page opens by default when you visit fastbull.com