• Trade
  • Markets
  • Copy
  • Contests
  • News
  • 24/7
  • Calendar
  • Q&A
  • Chats
Screeners
SYMBOL
LAST
ASK
BID
HIGH
LOW
NET CHG.
%CHG.
SPREAD
SPX
S&P 500 Index
6950.22
6950.22
6950.22
6964.65
6921.61
+34.61
+ 0.50%
--
DJI
Dow Jones Industrial Average
49412.39
49412.39
49412.39
49488.81
49137.65
+313.69
+ 0.64%
--
IXIC
NASDAQ Composite Index
23601.35
23601.35
23601.35
23688.94
23486.08
+100.11
+ 0.43%
--
USDX
US Dollar Index
96.780
96.860
96.780
97.060
96.680
-0.050
-0.05%
--
EURUSD
Euro / US Dollar
1.18810
1.18818
1.18810
1.18991
1.18502
+0.00017
+ 0.01%
--
GBPUSD
Pound Sterling / US Dollar
1.36944
1.36955
1.36944
1.37003
1.36636
+0.00164
+ 0.12%
--
XAUUSD
Gold / US Dollar
5088.43
5088.84
5088.43
5100.65
5013.05
+78.16
+ 1.56%
--
WTI
Light Sweet Crude Oil
60.790
60.820
60.790
60.885
60.054
+0.042
+ 0.07%
--

Community Accounts

Signal Accounts
--
Profit Accounts
--
Loss Accounts
--
View More

Become a signal provider

Sell trading signals to earn additional income

View More

Guide to Copy Trading

Get started with ease and confidence

View More

Signal Accounts for Members

All Signal Accounts

Best Return
  • Best Return
  • Best P/L
  • Best MDD
Past 1W
  • Past 1W
  • Past 1M
  • Past 1Y

All Contests

  • All
  • Trump Updates
  • Recommend
  • Stocks
  • Cryptocurrencies
  • Central Banks
  • Featured News
Top News Only
Share

Slovakia To File Lawsuit Against EU's Ban Of Russian Gas Imports, Dennik N Cites Prime Minister Fico

Share

Asked About Bank Indonesia's Independence, Governor Warjiyo Says Bi Decides Its Monetary Policy Based On Inflation, Forex Rate And Growth Data

Share

South Korea National Security Office: Urges North Korea To Immediately Halt Ballistic Missile Launches

Share

German Defense Minister Pistorius: Well On The Way To Joining Forces With The US In The Arctic Sentry Mission

Share

Angola Also Expects To Raise $500 Million In 2026 From World Bank Development Policy Operations, Debt Plan Shows

Share

Indonesia Central Bank Governor: Rupiah Is Currently Undervalued

Share

Indonesia Central Bank Governor: Rupiah Movement Recently Due To Short Term Factors, Fundamentals Will Help Rupiah Strengthen

Share

Polish Minister Of State Assets Says That Poland To Sign Memorandum Of Understanding With Finland On Hydrogen Supply

Share

China Renews Cooperation MOU On Green Maritime Technology, Shipbuilding Industry With Denmark - Industry Ministry

Share

Indian Rupee Up 0.24% At 91.72 Per USA Dollar As Of 3:30 P.M. Ist, Previous Close 91.94

Share

India's Nifty 50 Index Provisionally Ends 0.75% Higher

Share

The US Dollar Fell More Than 100 Points Against The Japanese Yen In The Short Term, Reaching A Low Of 153.2

Share

Softbank: About 8600 Cases Of Personal Information May Have Been Leaked Due To Server Malfunction

Share

India's Nifty 50 Index Extends Gains, Last Up 0.5%

Share

Spot Palladium Rises Over 3% To $2054.44/Oz

Share

Indonesia Central Bank Governor: Bank Indonesia Is Also Expanding Monetary Operation Instruments To Include Currencies Such As Yen, Yuan

Share

Indonesia Central Bank Governor: Looking Forward, Bi Will Continue To Monitor For Room To Further Lower Interest Rate

Share

Indonesia Central Bank Governor: Looking Forward Bi Is Committed To Maintain Rupiah Stability, Including Through Measured Interventions

Share

European Bank Stocks Index Rises 1%, Highest Level Since May 2008

Share

Hong Kong December Net Gold Exports To China 12.205 Metric Tons Versus 16.16 Metric Tons In November

TIME
ACT
FCST
PREV
U.S. IHS Markit Manufacturing PMI Prelim (SA) (Jan)

A:--

F: --

P: --

U.S. IHS Markit Services PMI Prelim (SA) (Jan)

A:--

F: --

P: --

U.S. IHS Markit Composite PMI Prelim (SA) (Jan)

A:--

F: --

P: --

U.S. UMich Consumer Sentiment Index Final (Jan)

A:--

F: --

P: --

U.S. UMich Current Economic Conditions Index Final (Jan)

A:--

F: --

P: --

U.S. UMich Consumer Expectations Index Final (Jan)

A:--

F: --

P: --

U.S. Conference Board Leading Economic Index MoM (Nov)

A:--

F: --

P: --

U.S. Conference Board Coincident Economic Index MoM (Nov)

A:--

F: --

P: --

U.S. Conference Board Lagging Economic Index MoM (Nov)

A:--

F: --

P: --

U.S. UMich 1-Year-Ahead Inflation Expectations Final (Jan)

A:--

F: --

P: --

U.S. Conference Board Leading Economic Index (Nov)

A:--

F: --

P: --

U.S. Weekly Total Rig Count

A:--

F: --

P: --

U.S. Weekly Total Oil Rig Count

A:--

F: --

P: --

Japanese Prime Minister Sanae Takaichi delivers a speech
Germany Ifo Business Expectations Index (SA) (Jan)

A:--

F: --

P: --

Germany IFO Business Climate Index (SA) (Jan)

A:--

F: --

P: --

Germany Ifo Current Business Situation Index (SA) (Jan)

A:--

F: --

P: --

Brazil Current Account (Dec)

A:--

F: --

P: --

Mexico Unemployment Rate (Not SA) (Dec)

A:--

F: --

P: --

Canada National Economic Confidence Index

A:--

F: --

P: --

U.S. Non-Defense Capital Durable Goods Orders MoM (Excl. Aircraft) (Nov)

A:--

F: --

P: --
U.S. Durable Goods Orders MoM (Excl. Defense) (SA) (Nov)

A:--

F: --

P: --
U.S. Durable Goods Orders MoM (Excl.Transport) (Nov)

A:--

F: --

P: --

U.S. Durable Goods Orders MoM (Nov)

A:--

F: --

P: --
U.S. Chicago Fed National Activity Index (Nov)

A:--

F: --

P: --
U.S. Dallas Fed New Orders Index (Jan)

A:--

F: --

P: --

U.S. Dallas Fed General Business Activity Index (Jan)

A:--

F: --

P: --
U.S. 2-Year Note Auction Avg. Yield

A:--

F: --

P: --

U.K. BRC Shop Price Index YoY (Jan)

A:--

F: --

P: --

China, Mainland Industrial Profit YoY (YTD) (Dec)

A:--

F: --

P: --

Germany 2-Year Schatz Auction Avg. Yield

--

F: --

P: --

Mexico Trade Balance (Dec)

--

F: --

P: --

U.S. Weekly Redbook Index YoY

--

F: --

P: --

U.S. S&P/CS 20-City Home Price Index YoY (Not SA) (Nov)

--

F: --

P: --

U.S. S&P/CS 20-City Home Price Index MoM (SA) (Nov)

--

F: --

P: --

U.S. FHFA House Price Index MoM (Nov)

--

F: --

P: --

U.S. FHFA House Price Index (Nov)

--

F: --

P: --

U.S. FHFA House Price Index YoY (Nov)

--

F: --

P: --

U.S. S&P/CS 10-City Home Price Index YoY (Nov)

--

F: --

P: --

U.S. S&P/CS 10-City Home Price Index MoM (Not SA) (Nov)

--

F: --

P: --

U.S. S&P/CS 20-City Home Price Index (Not SA) (Nov)

--

F: --

P: --

U.S. S&P/CS 20-City Home Price Index MoM (Not SA) (Nov)

--

F: --

P: --

U.S. Richmond Fed Manufacturing Composite Index (Jan)

--

F: --

P: --

U.S. Conference Board Present Situation Index (Jan)

--

F: --

P: --

U.S. Conference Board Consumer Expectations Index (Jan)

--

F: --

P: --

U.S. Richmond Fed Manufacturing Shipments Index (Jan)

--

F: --

P: --

U.S. Richmond Fed Services Revenue Index (Jan)

--

F: --

P: --

U.S. Conference Board Consumer Confidence Index (Jan)

--

F: --

P: --

U.S. 5-Year Note Auction Avg. Yield

--

F: --

P: --

U.S. API Weekly Refined Oil Stocks

--

F: --

P: --

U.S. API Weekly Crude Oil Stocks

--

F: --

P: --

U.S. API Weekly Gasoline Stocks

--

F: --

P: --

U.S. API Weekly Cushing Crude Oil Stocks

--

F: --

P: --

Australia RBA Trimmed Mean CPI YoY (Q4)

--

F: --

P: --

Australia CPI YoY (Q4)

--

F: --

P: --

Australia CPI QoQ (Q4)

--

F: --

P: --

Germany GfK Consumer Confidence Index (SA) (Feb)

--

F: --

P: --

Germany 10-Year Bund Auction Avg. Yield

--

F: --

P: --

India Industrial Production Index YoY (Dec)

--

F: --

P: --

India Manufacturing Output MoM (Dec)

--

F: --

P: --

Q&A with Experts
    • All
    • Chatrooms
    • Groups
    • Friends
    9JWVD8VGZN flag
    SlowBear ⛅ flag
    ANDY
    @ANDY wow this is one origial buy from supply bro!
    Khawatir_ flag
    SlowBear ⛅ flag
    ANDY
    should the position be closed, afraid it will go down?
    @ANDYQell EURUSD sell is not bad for a sounter trend, but why do you have to open this many?
    McOkanz flag
    If you’re not confident enough dont take sell on gold, but it’s currently selling now, I don’t have a specific tp yet
    3008000 flag
    hi guys any on what's happening on jpy pairs
    3008000 flag
    clue
    3008000 flag
    It has suddenly dump 100pips and their is no high impact news today
    SURYAVANSHI flag
    Trading Contest

    SURYAVANSHI

    ID: 5249090

    2026 FastBull GOLD Global S1 Ongoing
    148
    Rankings
    +205,430.50
    Profit and loss(USD)
    205.43%
    Return rate
    Show your trading skills, PK top traders globally
    Contest details
    McOkanz flag
    3008000
    hi guys any on what's happening on jpy pairs
    @Visitor3008000 USDJPy fuvk me up with wick 😂🤣
    Nues Scalp flag
    Why can't I enter the live contest even though I've registered?
    Nues Scalp flag
    I can't trade my contest. Where is the login info?
    SlowBear ⛅ flag
    3008000
    hi guys any on what's happening on jpy pairs
    @3008000the yen pairs are still in their correctve stage lets just watch out
    SlowBear ⛅ flag
    3008000
    It has suddenly dump 100pips and their is no high impact news today
    @3008000 the yen pairs are still going through the ubcertainties that surronds the BoJ Intervention so lets stay clear of them
    ndu flag
    trump is target south korea again with tarrif due to a delay to make an agreement with US and that not good for USD.
    Tấn Tài Ng flag
    The Japanese yen is about to explode, soon to be a safe haven for gold and silver stars.
    ndu flag
    Tấn Tài Ng
    The Japanese yen is about to explode, soon to be a safe haven for gold and silver stars.
    @Tấn Tài Ng
    Judy flag
    what are your buy limits for gold my people?
    Tấn Tài Ng flag
    Silver was initially ignored, but when people started paying attention, its price rose sharply, as did the Japanese yen.
    SlowBear ⛅ flag
    ndu
    @ndu I agree, the Yen and USD relationship is divergening and like you said investors are shifting to Gold and silver instead of the usual carry trader relationshop between both currencies
    Type here...
    Add Symbol or Code

      No matching data

      All
      Trump Updates
      Recommend
      Stocks
      Cryptocurrencies
      Central Banks
      Featured News
      • All
      • Russia-Ukraine Conflict
      • Middle East Flashpoint
      • All
      • Russia-Ukraine Conflict
      • Middle East Flashpoint
      Search
      Products

      Charts Free Forever

      Chats Q&A with Experts
      Screeners Economic Calendar Data Tools
      Membership Features
      Data Warehouse Market Trends Institutional Data Policy Rates Macro

      Market Trends

      Market Sentiment Order Book Forex Correlations

      Top Indicators

      Charts Free Forever
      Markets

      News

      News Analysis 24/7 Columns Education
      From Institutions From Analysts
      Topics Columnists

      Latest Views

      Latest Views

      Trending Topics

      Top Columnists

      Latest Update

      Signals

      Copy Rankings Latest Signals Become a signal provider AI Rating
      Contests
      Brokers

      Overview Brokers Assessment Rankings Regulators News Claims
      Broker listing Forex Brokers Comparison Tool Live Spread Comparison Scam
      Q&A Complaint Scam Alert Videos Tips to Detect Scam
      More

      Business
      Events
      Careers About Us Advertising Help Center

      White Label

      Data API

      Web Plug-ins

      Affiliate Program

      Awards Institution Evaluation IB Seminar Salon Event Exhibition
      Vietnam Thailand Singapore Dubai
      Fans Party Investment Sharing Session
      FastBull Summit BrokersView Expo
      Recent Searches
        Top Searches
          Markets
          News
          Analysis
          User
          24/7
          Economic Calendar
          Education
          Data
          • Names
          • Latest
          • Prev

          View All

          No data

          Scan to Download

          Faster Charts, Chat Faster!

          Download App
          English
          • English
          • Español
          • العربية
          • Bahasa Indonesia
          • Bahasa Melayu
          • Tiếng Việt
          • ภาษาไทย
          • Français
          • Italiano
          • Türkçe
          • Русский язык
          • 简中
          • 繁中
          Open Account
          Search
          Products
          Charts Free Forever
          Markets
          News
          Signals

          Copy Rankings Latest Signals Become a signal provider AI Rating
          Contests
          Brokers

          Overview Brokers Assessment Rankings Regulators News Claims
          Broker listing Forex Brokers Comparison Tool Live Spread Comparison Scam
          Q&A Complaint Scam Alert Videos Tips to Detect Scam
          More

          Business
          Events
          Careers About Us Advertising Help Center

          White Label

          Data API

          Web Plug-ins

          Affiliate Program

          Awards Institution Evaluation IB Seminar Salon Event Exhibition
          Vietnam Thailand Singapore Dubai
          Fans Party Investment Sharing Session
          FastBull Summit BrokersView Expo

          Europe Bets Big on Offshore Wind for Energy Security

          King Ten

          Energy

          Remarks of Officials

          Economic

          Political

          Summary:

          Ten European nations have agreed to jointly develop a massive offshore wind network, aiming to secure energy independence, reduce reliance on U.S. natural gas, and manage the rising cost of renewables.

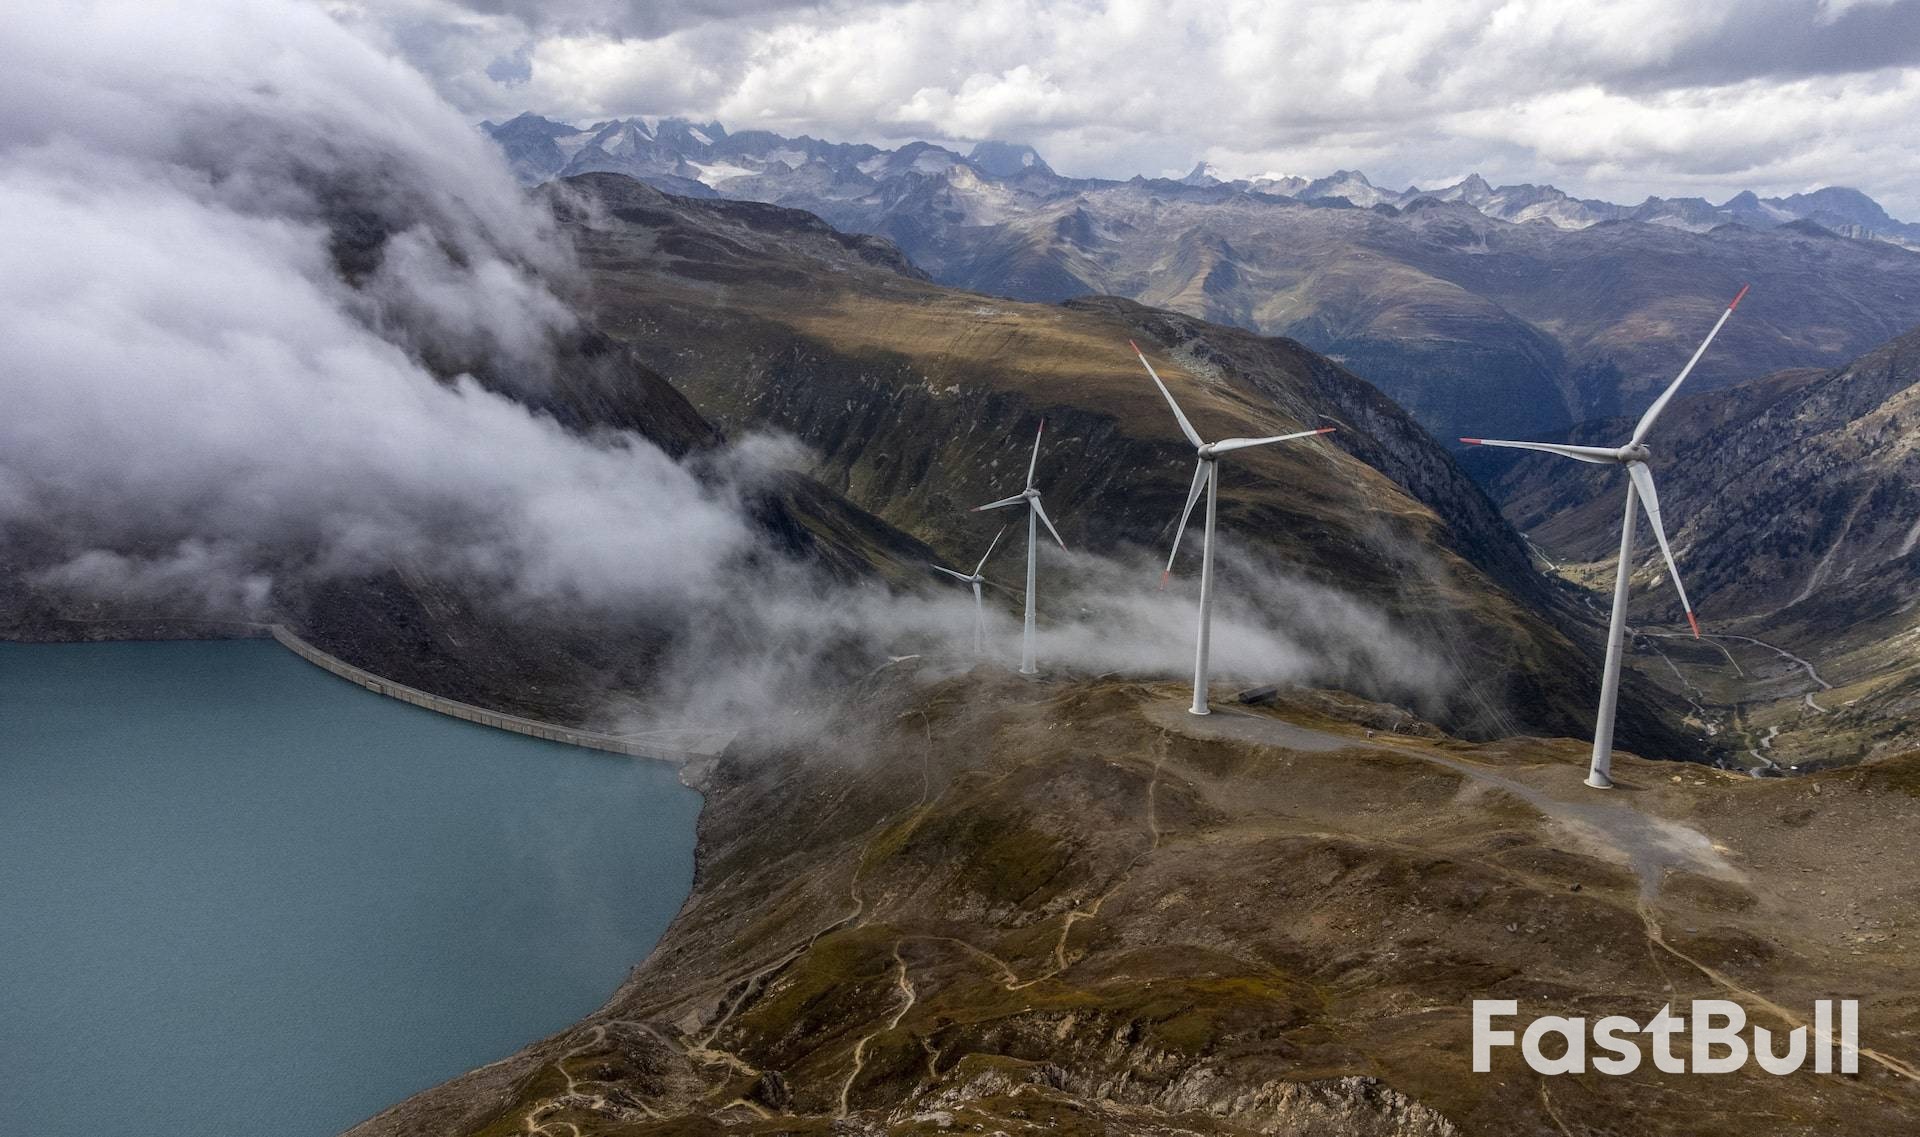
          Ten European nations have agreed to jointly develop a massive offshore wind network, a landmark move designed to secure the region's energy supply, reduce dependence on U.S. natural gas, and manage the rising cost of renewables.

          At the North Sea Summit, ministers from Britain, Belgium, Denmark, France, Germany, Iceland, Ireland, Luxembourg, the Netherlands, and Norway signed a pact to build 100 gigawatts (GW) of offshore wind capacity. This ambitious project aims to power over 50 million households and builds on a 2023 commitment to install 300 GW of offshore wind by 2050—a strategy initially driven by the energy crisis following Russia's 2022 invasion of Ukraine.

          A Strategic Pivot from US Gas Imports

          The agreement comes at a critical juncture in Europe's relationship with the United States. Following the disruption of Russian gas flows, Europe has become heavily reliant on U.S. liquefied natural gas (LNG). In 2025, U.S. gas made up 57% of all LNG imports into the EU and Britain, accounting for roughly a quarter of the region's total gas supply.

          Concerns over this dependency have been amplified by President Donald Trump's "energy dominance" agenda and transactional approach to diplomacy, highlighted by a recent dispute over Greenland. This new wind power initiative is a clear effort to build a more independent and homegrown energy system.

          Navigating a Challenging Climate for Renewables

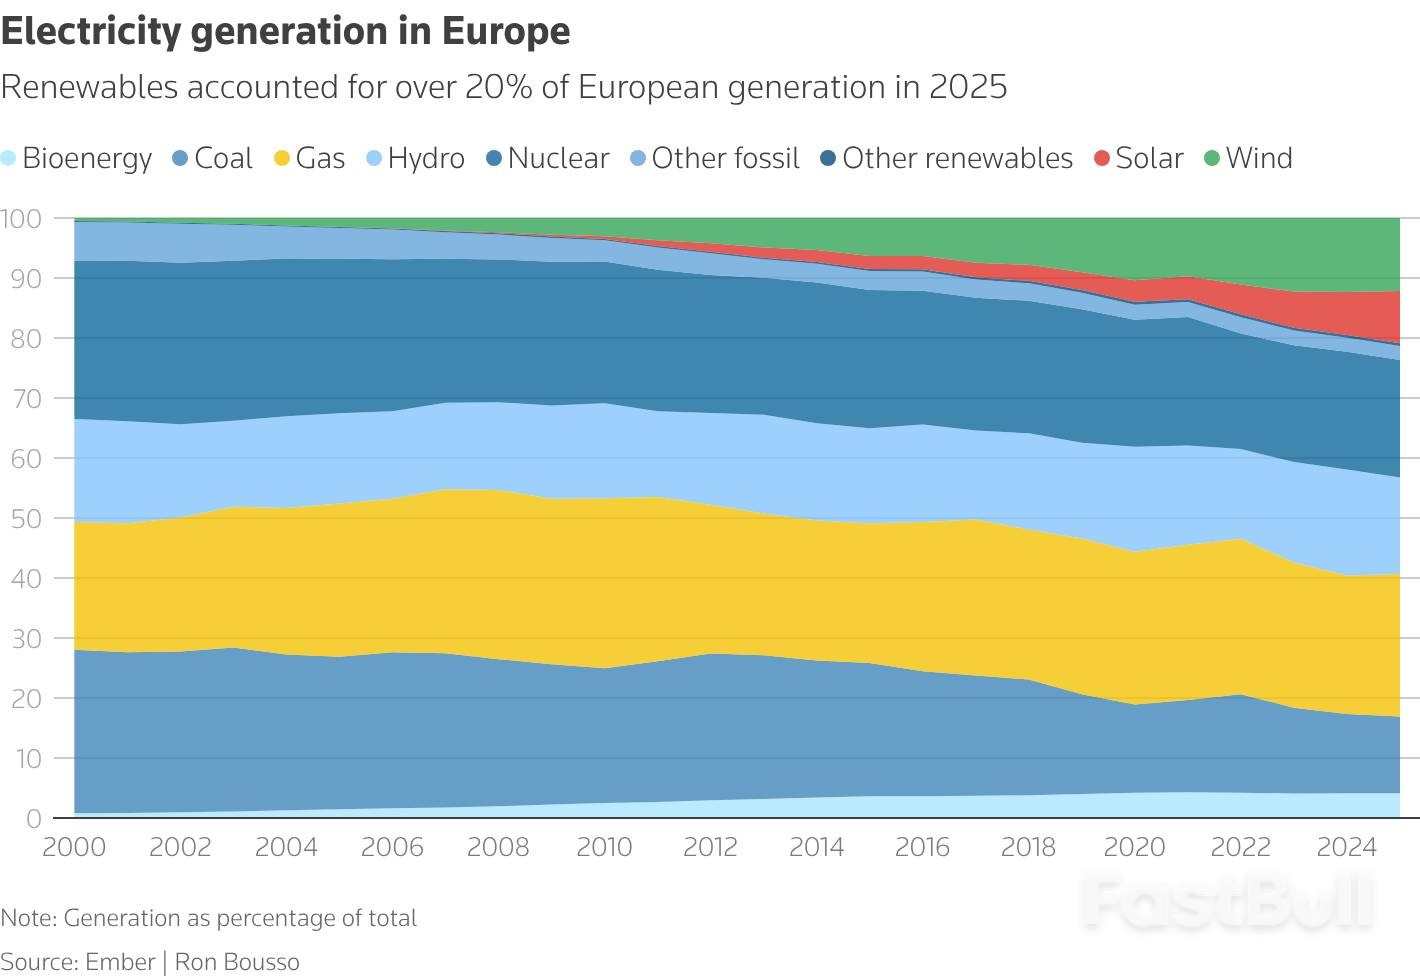
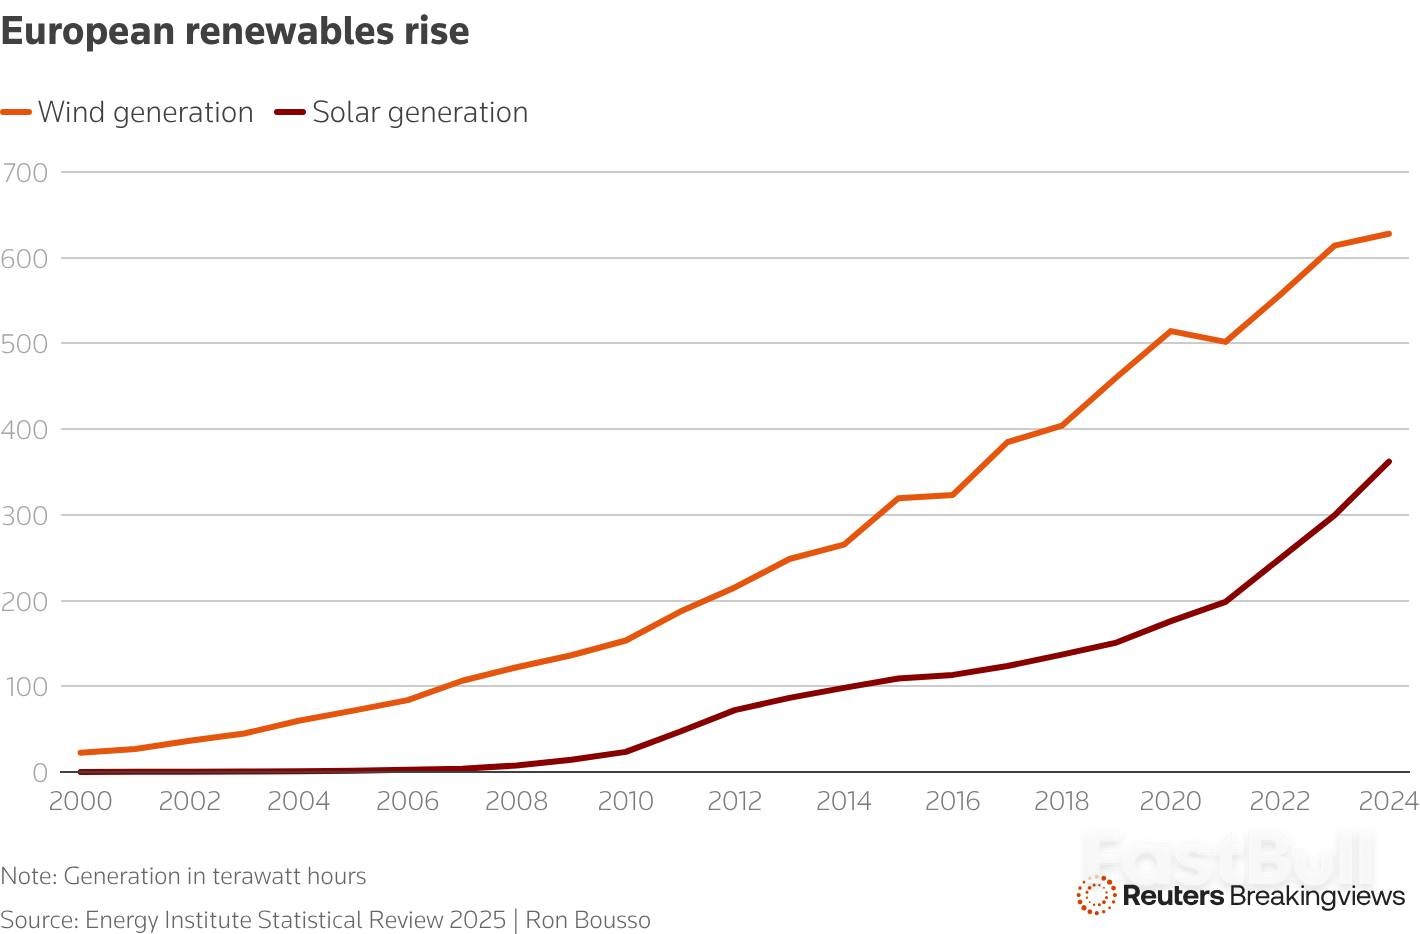
          While wind power is central to Northern Europe's energy strategy—generating 19% of EU electricity in 2025—the industry faces significant headwinds. The region currently operates just 37 GW of offshore wind capacity, making the planned 100 GW expansion a profound transformation of its power market.

          Figure 1: Europe's electricity generation mix has transformed since 2000, with renewable sources like wind and solar steadily displacing fossil fuels.

          Globally, investor confidence in clean energy has cooled due to rising capital costs, supply chain bottlenecks, and concerns over China's dominance in renewables manufacturing. In the U.S., the Trump administration's open hostility toward green energy, especially wind power, has led to the cancellation of multiple projects and further weakened market sentiment.

          At the same time, Europe's cost-of-living crisis, exacerbated by high energy prices, has made climate policies a political battleground, creating public resistance to net-zero initiatives.

          Figure 2: Wind and solar generation in Europe have grown significantly since 2000, with wind power consistently leading the expansion of renewable energy capacity.

          A Blueprint for Cost Reduction and Efficiency

          The multi-nation offshore wind pact is designed to address cost concerns as much as energy security. It includes several features aimed at lowering development expenses and, eventually, consumer electricity bills.

          Leveraging Economies of Scale

          The sheer scale of the 100 GW commitment is its most powerful feature. By providing the offshore wind supply chain with greater demand certainty, the plan is expected to spur investment in European manufacturing. Industry group WindEurope projects the initiative will:

          • Cut costs by 30% between 2025 and 2040.

          • Create 91,000 jobs.

          • Generate 1 trillion euros ($1.19 trillion) in economic activity.

          Building an Integrated Power Network

          A core element of the agreement is a plan to connect wind farms to multiple countries through a network of bidirectional cables and interconnectors. This integrated grid will allow electricity to flow where it is most needed, improving efficiency and giving operators the flexibility to respond to shifting supply and demand across different markets.

          This cross-border "arbitrage" should also minimize "negative pricing" events, where excess wind generation forces operators to shut down turbines and receive compensation. "When it is windy in Germany, it may not be windy in the UK, so if Germany can't use all of the power, the UK can take some instead of wasting it," explained Jordan May, a senior analyst at consultancy TGS 4C.

          Furthermore, because the network will span multiple time zones, peak demand hours will vary by country. This diversity should make it easier to match supply with demand, reducing the need for gas-fired backup power.

          An Unexpected Boost from US Policy

          Europe may also benefit indirectly from President Trump's stance on wind energy. The U.S. offshore wind sector has seen a sharp downturn, with the International Energy Agency slashing its 2030 forecast for the country by over 50%. Reduced American demand for vessels, components, and services could lead to lower prices for European operators.

          The Real Cost of Europe's Energy Future

          Despite the plan's potential, the path forward is complex. European governments must develop intricate new regulations to align different national subsidy programs and power market rules—a process that could take years and face political opposition.

          The cost of transitioning to renewables remains a contentious issue in Europe. However, forecasting these costs is difficult, and the same uncertainty applies to fossil fuels, which are subject to volatile global prices. While offshore wind requires significant upfront investment, its long-term operating costs are generally lower. In contrast, gas-fired plants are cheaper to build but remain exposed to price shocks.

          Critically, debates over the cost of renewables often overlook the cost of inaction. Europe's power demand is projected to nearly double by 2050, requiring massive investment to upgrade and expand aging grids regardless of the energy source. Delaying this work will only make it more expensive.

          Ultimately, this joint offshore wind plan provides a clear path toward greater energy independence and industrial strength. Its success, however, will be measured by its ability to deliver lower, more stable electricity prices for European consumers.

          To stay updated on all economic events of today, please check out our Economic calendar
          Risk Warnings and Disclaimers
          You understand and acknowledge that there is a high degree of risk involved in trading. Following any strategies or investment methods may lead to potential losses. The content on the site is provided by our contributors and analysts for information purposes only. You are solely responsible for determining whether any trading assets, securities, strategy, or any other product is suitable for investing based on your own investment objectives and financial situation.
          Add to Favorites
          Share

          Germany's Economic Rebound: Can Merz Overcome Stagnation?

          Nathaniel Wright

          Data Interpretation

          Remarks of Officials

          Economic

          Political

          Chancellor Friedrich Merz came to power with a promise to revive Europe's largest economy through an unprecedented fiscal stimulus after two years of contraction. While Germany's growth prospects are central to the eurozone's recovery, economists and business leaders warn that the deep structural reforms needed for sustainable growth have yet to materialize.

          The country's sluggish federal decision-making process, combined with a coalition partner hesitant about some of Merz’s more aggressive plans, threatens to stall the reform agenda. Furthermore, idle industrial capacity will take time to bring back online, potentially slowing the recovery.

          After expanding by a mere 0.2% in 2025, the German economy is projected to see healthier growth this year as government spending accelerates.

          Cautious Optimism for Germany's 2026 Growth

          Forecasts for 2026 point toward a moderate upswing. The International Monetary Fund anticipates 1.1% growth, while the German government officially expects a 1.3% expansion, though a source told Reuters this figure will likely be revised down to 1.0%.

          "A moderate upswing is a good sign, but the recovery remains fragile," noted Ulrich Reuter, president of Germany's savings banks association DSGV, who also forecasts 1.0% growth.

          Investor morale is one bright spot, hitting its highest level since August 2021 in January, according to the ZEW economic research institute.

          Figure 1: German investor sentiment (orange line) surged to its highest since August 2021, though the assessment of the current economic situation (red line) remains deeply negative.

          "It is reasonable to look ahead to 2026 with cautious optimism: If the fiscal measures that have already been decided take full effect, a noticeable pickup is possible," said Geraldine Dany-Knedlik, an economist at the German Institute for Economic Research DIW Berlin.

          Slow Decision-Making Hampers Key Investments

          Despite the optimism, progress has been slow. A landmark 500 billion euro ($593 billion) special fund for infrastructure was approved by parliament last March, yet only 24 billion euros had been invested by the end of the year. This reflects the slow pace of decision-making inherent in Germany's federal system.

          Public impatience has grown, especially now that Merz has been in office for over eight months. The initial enthusiasm surrounding the government's fiscal policy shift has also waned amid concerns that parts of the infrastructure fund are being used for daily spending rather than growth-enhancing projects.

          Deep-Rooted Structural Issues and Political Hurdles

          Even if a recovery is underway, Germany's problems are structural, self-inflicted, and cannot be fixed quickly, according to Carsten Brzeski, global head of macro at ING.

          "This time around, the economy almost needs a complete makeover," Brzeski said, pointing to the need to cut red tape, roll out e-government, and address the fiscal burden of an aging population.

          However, Merz's pro-business agenda has met resistance from his centre-left Social Democrat (SPD) coalition partners. The SPD is wary of reforms they believe could weaken workers' rights, leading to disputes over pension changes and tax policy that have hindered progress.

          The most difficult structural challenges—including pensions, health insurance financing, and fiscal rule reform—have been delegated to commissions that are not due to report until the end of 2026. This means many of the biggest decisions are still pending.

          Industrial Sector Shows Signs of Life, But Capacity Lags

          Fiscal stimulus is providing some support to the industrial sector, which has shown tentative signs of stabilization. Industrial production rose by 0.8% in November, marking its third consecutive monthly increase.

          Figure 2: German industrial production has shown a long-term decline but stabilized in late 2025, supporting forecasts of a modest recovery.

          Industrial orders climbed 5.6% month-on-month in November, and private sector business activity grew at its fastest rate in three months in January, according to the flash composite PMI.

          "This makes us more confident that, after six years of stagnation, Germany will grow again in 2026. However, we would not get carried away," commented Franziska Palmas, senior Europe economist at Capital Economics.

          Despite these positive signals, the BDI industry association projects that industry will likely expand more slowly than the overall economy this year. BDI Managing Director Tanja Goenner highlighted that industrial capacity utilization was at 78% in October, well below the long-term average of 83.3%, marking the longest period of underutilization.

          "This means machines are standing still, production potential remains unused, investments are being postponed and employment is being reduced," she explained.

          Fragile Demand and Corporate Distress Cloud Outlook

          On the domestic front, household demand remains weak. Consumer sentiment fell in January as the tendency to save reached its highest point since the 2008 financial crisis. Spending is expected to stay muted this year as unemployment rises, a lagging effect from the economic stagnation of previous years.

          Meanwhile, corporate distress is on the rise. The number of bankruptcies and insolvency-related business closures has reached an 11-year high.

          To reverse this trend, DIHK chief analyst Volker Treier insists that the structural problems facing companies must be addressed urgently. "It is up to Chancellor Friedrich Merz and his government to implement these reforms this year and turn a long-awaited rebound into a sustainable recovery," he said.

          To stay updated on all economic events of today, please check out our Economic calendar
          Risk Warnings and Disclaimers
          You understand and acknowledge that there is a high degree of risk involved in trading. Following any strategies or investment methods may lead to potential losses. The content on the site is provided by our contributors and analysts for information purposes only. You are solely responsible for determining whether any trading assets, securities, strategy, or any other product is suitable for investing based on your own investment objectives and financial situation.
          Add to Favorites
          Share

          Trade Cable On The FOMC Interest Rate Decision

          IC Markets

          Forex

          Political

          Economic

          FX traders are preparing for a very lively day on Wednesday as focus should move away from geopolitical concerns and onto fundamentals for a few sessions. There is some key data out earlier in the day, but the real attention will be on the North American trading session where we hear interest rate updates from both the Bank of Canada and the Federal Reserve Bank, and as always, the Fed should dominate market sentiment across global markets.

          After the drama of last month's meeting where the Fed closed out 2025 with another 25-basis point cut, the market is expecting this meeting conclusion to be slightly quieter with chances now up at 97% that they will keep rates on hold. Moves should come from forward guidance from the statement and press conference as projections are not declared at this meeting. Data has remained fairly stable in the US with growth remaining strong, jobs numbers still weak – although the unemployment rate dipped on the last reading – and inflation still sticky, the Core PCE still up at 2.8% well off the Fed's desired 2%.

          Some currencies are sitting at very sensitive levels going into the meeting and anything slightly off expectations could see some big moves in the market. The dollar has taken a big hit over the last few sessions and Cable looks particularly vulnerable to a topside move if we hear anything more dovish than expected from the FOMC, while anything on the hawkish side should see it drop hard back into recent ranges. Key long-term trendline resistance on the Daily chart is now relatively close at 1.3730 and a break there opens the way for a move up to the 2025 high at 1.3788, while a move south could see the 200-day moving average at 1.3413 challenged.

          Resistance 2: 1.3788 – 2025 High

          Resistance 1: 1.3733 – Trendline Resistance

          Support 1: 1.3413 – 200 – Day Moving Average

          Support 2: 1.3335 – 19 Jan Low

          Source: IC Markets

          To stay updated on all economic events of today, please check out our Economic calendar
          Risk Warnings and Disclaimers
          You understand and acknowledge that there is a high degree of risk involved in trading. Following any strategies or investment methods may lead to potential losses. The content on the site is provided by our contributors and analysts for information purposes only. You are solely responsible for determining whether any trading assets, securities, strategy, or any other product is suitable for investing based on your own investment objectives and financial situation.
          Add to Favorites
          Share

          India Offers EU Auto Quota Six Times Larger Than UK Deal

          James Whitman

          Economic

          India has agreed to give European automakers a quota more than six times larger than any it has offered in recent times, slashing tariffs under a trade pact with the European Union and granting far greater access to its tightly protected car market.

          The agreement will gradually allow up to 250,000 European-made vehicles to enter India at preferential duty rates, according to people familiar with the negotiations — far above the 37,000-unit quota extended to the UK under a separate deal.

          Of this, about 160,000 units with internal combustion-engine cars will see import duties fall to 10% within five years while for 90,000 electric vehicles, this levy will kick in by the 10th year to protect the nascent Indian electric vehicle market, the people said. The initial in-quota tariffs will start at about 30% for most segments.

          Beyond this quota, the trade pact has negotiated a rate cut to 35% over 10 years for fossil-fuel powered cars, they added. This is a substantial markdown since India currently charges as much as 110% on imported cars.

          The larger allocation reflects the bloc's much bigger auto market and will benefit manufacturers including Volkswagen AG, Mercedes-Benz Group AG, Stellantis NV and Renault SA.

          The pact includes a review clause allowing quotas to be reassessed periodically to reflect India's booming auto market and any concessions offered to future trade partners, including the US, one of the people said. Reviews will be linked to steel — a key priority for India — giving both sides leverage in future negotiations, the person said.

          The unprecedented quota underscores how both sides are using the pact to reset their trade relationship. For Europe, it deepens access to the fast-growing market long shielded by steep tariffs, while India secures reciprocal access for its own automakers as it pushes to expand exports and boost manufacturing. The auto sector concessions are part of a larger trade pact that also slashes duties on wine, spirits and beer, while preserving protections for politically sensitive farm sectors on both sides.

          The EU will offer Indian automakers such as Mahindra & Mahindra Ltd., Tata Motors Passenger Vehicles Ltd. and Maruti Suzuki India Ltd. import concessions covering up to 625,000 vehicles, a number calibrated to reflect the relative size of the two markets, one of the people said.

          Tariffs on India-made electric vehicles imported into the bloc within quotas will be eliminated over 10 years, the person said. Smaller, lower-cost EVs will be phased in more slowly over 14 years, starting at 27,500 units in year five and rising to 125,000 units — about 2% of EU's market based on current forecasts, according to one of the people.

          To be sure, while the agreement gives European carmakers a clearer pathway to deepen their presence in India — and potentially operate with lower levels of local manufacturing investment than they have long sought to avoid — the timing of the tariff cuts will be critical in determining how valuable the concessions prove in practice.

          With the steepest reductions phased in over several years, companies' ability to capitalize on the deal will hinge on how quickly lower duties take effect and whether demand in India's premium and electric segments accelerates as expected.

          India also agreed to reduce out-of-quota tariffs on European combustion-engine cars to between 30% and 35% over a decade, the people said.

          In addition to finished vehicles, European carmakers will be allowed to export up to 75,000 cars a year, priced above €15,000 (about $17,800), for assembly in India from completely-knocked-down kits. Tariffs on those imports will be cut to 8.25% from 16.5%, according to a person familiar with the details.

          Duties on car parts will be reduced to zero, the people said, supporting deeper supply-chain integration between Europe and India. Europe is a major export market for Indian auto component suppliers, while higher pricing for Europe-made parts is expected to limit the impact on India's domestic manufacturing industry.

          The agreement stops short of sweeping market opening, the person said, adding that it underscored the constraints the bloc faced in talks with India, especially after New Delhi tied progress to its demands on steel. Even with the deal in place, new EU regulations on that sector are likely to curb India's effective access to the market, the person said.

          Source: Bloomberg

          To stay updated on all economic events of today, please check out our Economic calendar
          Risk Warnings and Disclaimers
          You understand and acknowledge that there is a high degree of risk involved in trading. Following any strategies or investment methods may lead to potential losses. The content on the site is provided by our contributors and analysts for information purposes only. You are solely responsible for determining whether any trading assets, securities, strategy, or any other product is suitable for investing based on your own investment objectives and financial situation.
          Add to Favorites
          Share

          South Korean Auto Stocks Rebound as Markets Downplay Trump Tariff Threat

          Gerik

          Economic

          Initial Shock From Tariff Rhetoric

          Shares of South Korea’s leading automakers came under immediate pressure after Donald Trump said he would raise tariffs on South Korean goods, including automobiles, to 25% from 15%. The remarks, delivered via social media, triggered a swift selloff at the market open, reflecting investor sensitivity to renewed trade tensions between Washington and Seoul.
          Hyundai Motor fell as much as 4.8% in early trading before reversing course to close up 1.1%. Kia Corp also pared steep losses, ending down 1% after having dropped as much as 6%. Hyundai Mobis narrowed its decline to 0.1% after earlier losses of nearly 6%.
          The sharp intraday reversal suggests that while tariff headlines can generate immediate volatility, markets are increasingly cautious about extrapolating political statements into concrete trade outcomes.

          Investors Reassess Policy Likelihood

          Analysts pointed out that South Korea U.S. trade terms had already been agreed at the presidential level, reducing the likelihood of sudden unilateral changes. Kim Joon-sung, a senior analyst at Meritz Securities, said expectations remain that auto export tariffs to the United States will ultimately be reconfirmed at 15%.
          This assessment highlights a distinction between headline risk and policy execution. While Trump’s comments created uncertainty, the lack of clarity on timing or implementation weakened the causal link between the announcement and long term earnings impact for automakers.

          Currency Weakness Reflects Residual Caution

          The South Korean won weakened 0.52% to 1,451.1 per dollar when onshore trading opened in Seoul, giving back some of the gains recorded a day earlier. The currency move indicates lingering caution among investors, even as equity markets stabilized. Currency reactions tend to be more sensitive to trade rhetoric, reflecting concerns about export competitiveness and capital flows.
          Despite the won’s pullback, broader market sentiment improved, with the benchmark KOSPI trading up 1.2%. This divergence suggests that equity investors are focusing more on domestic fundamentals and global risk appetite than on near term trade threats.

          Global Market Context Supports Recovery

          The rebound in South Korean auto stocks also coincided with a positive close on Wall Street, where U.S. equities finished higher. That backdrop helped limit downside momentum in Asian markets and reinforced the view that Trump’s tariff remarks, while disruptive, have not yet altered the broader global risk environment.
          Overall, the episode illustrates how markets are adapting to frequent trade related rhetoric. Initial reactions remain sharp, but recoveries are quicker as investors weigh political signaling against established trade frameworks. For South Korea’s automakers, the recovery suggests confidence that existing agreements and negotiation channels will ultimately temper policy risk, keeping volatility episodic rather than structural.

          Source: Reuters

          To stay updated on all economic events of today, please check out our Economic calendar
          Risk Warnings and Disclaimers
          You understand and acknowledge that there is a high degree of risk involved in trading. Following any strategies or investment methods may lead to potential losses. The content on the site is provided by our contributors and analysts for information purposes only. You are solely responsible for determining whether any trading assets, securities, strategy, or any other product is suitable for investing based on your own investment objectives and financial situation.
          Add to Favorites
          Share

          Bank Of America Calls For $6,000 Gold In 2026

          Samantha Luan

          Commodity

          Political

          In October, Bank of America raised its 2026 gold price forecast to $5,000.

          Mission accomplished as of January 23.

          Now the big bank has upped its projection again, calling for $6,000 gold this year.

          BoA analyst Michael Hartnett said gold's performance in past bull markets influenced his thinking.

          "History is no guide to future, but avg gold jump past 4 bull markets ≈ 300% in 43 months which would imply gold reaching $6,000 by spring."

          Earlier this month, Bank of America's Head of Metals Research, Michael Widmer, indicated he thought gold would become a key asset in investment portfolios this year.

          "Gold continues to stand out as a hedge and alpha source," he wrote, adding that gold will serve as a key hedge and potential return driver in 2026.

          In December, Widmer noted that bull markets don't end simply because prices reach high levels. The bulls will fade when the fundamentals driving the market shift. At this point, there is no reason to think that de-dollarization, central bank gold buying, inflation pressures, Federal Reserve monetary easing, geopolitical tensions, and U.S. fiscal malfeasance will end any time soon.

          "I've highlighted before that the gold market has been very overbought. But it's actually still underinvested. There is still a lot of room for gold as a diversification tool in portfolios."

          Tight supplies have been a key driver of the silver market. Widmer said the thinks supply constraints may also impact the gold market, forecasting that the 13 major North American gold miners will produce 19.2 million ounces this year, a decline of 2 percent from 2025. He said he believes that most market forecasts for output are too optimistic.

          Widmer also projects average all-in sustaining costs will rise 3 percent to about $1,600 per ounce, a level slightly above the market consensus.

          There has been growing interest in gold as a portfolio diversifier. Last fall, Morgan Stanley CIO Michael Wilson said investors should consider abandoning the traditional 60/40 equity/bond portfolio allocation and adopt a 60/20/20 distribution with 20 percent allocated to precious metals.

          Widmer said the 60/20/20 allocation makes sense.

          "When you run the analysis since 2020, you can actually justify that retail investors should have a gold share of well above 20 percent. You can even justify 30 percent at the moment."

          On average, Western investors currently hold less than 1 percent of gold in their portfolios.

          With the price touching $5,000, it's getting increasingly more difficult to ignore gold. Widmer said this will likely incentivize more portfolio managers to consider both gold and silver.

          "Just looking at benchmarks, gold has been one of the best-performing assets for the past few years. What we've heard a lot of the time is that 'gold is a non-yielding asset; it costs to hold it; you don't make any money from it, so what's the point of actually holding it?' But  just from a pure direction perspective, gold could have actually made a good contribution to a portfolio. I think the numbers speak for themselves."

          Source: Gold-Eagle

          Risk Warnings and Disclaimers
          You understand and acknowledge that there is a high degree of risk involved in trading. Following any strategies or investment methods may lead to potential losses. The content on the site is provided by our contributors and analysts for information purposes only. You are solely responsible for determining whether any trading assets, securities, strategy, or any other product is suitable for investing based on your own investment objectives and financial situation.
          Add to Favorites
          Share

          Japan's Service Inflation Stokes BOJ Rate Hike Pressure

          Winkelmann

          Data Interpretation

          Central Bank

          Remarks of Officials

          Economic

          Traders' Opinions

          A key measure of prices in Japan's services sector climbed 2.6% in December from the previous year, reinforcing the Bank of Japan's view that persistent labor shortages are compelling companies to pass on higher costs.

          This data adds to a growing body of evidence suggesting that steady wage growth, combined with rising import costs from a weak yen, will keep inflation elevated. This trend strengthens the case for the central bank to pursue further interest rate hikes.

          The December increase in the services producer price index, which tracks prices businesses charge each other, followed a 2.7% gain in November, according to Bank of Japan (BOJ) data.

          Labor Shortages Fuel Price Increases

          Analysts believe the tight labor market will continue to put upward pressure on prices. "Labour shortages will likely intensify ahead and prompt firms to pass on labour costs for various services, which will keep the index rising at a pace of around 2%," noted Koya Miyamae, a senior economist at SMBC Nikko Securities.

          The price data revealed increases in labor-intensive industries like hotels and construction. This aligns with the BOJ's perspective that a constrained jobs market will continue to drive up both wages and service-sector inflation.

          The Bank of Japan's Policy Pivot

          In 2024, the BOJ concluded its massive, decade-long stimulus program. By December of last year, it had raised short-term interest rates to 0.75%, signaling that Japan was close to sustainably meeting its 2% inflation target.

          With consumer inflation running above the 2% goal for nearly four years, the central bank has indicated its readiness to continue increasing borrowing costs, provided that prices and wages rise in tandem.

          Underscoring its conviction, the BOJ recently raised its forecasts for "core core" inflation for fiscal years 2025, 2026, and 2027. This metric, which excludes volatile fresh food and fuel prices, is considered a key indicator of demand-driven price growth.

          A Debate Over "Underlying Inflation"

          BOJ Governor Kazuo Ueda stated on Friday that the central bank is closely monitoring whether the prospect of steady wage gains will encourage more companies to pass on rising labor costs. This observation will be critical in determining the timing of the next rate hike. The primary focus is on the outlook for "underlying inflation," which the BOJ defines as price movements driven by domestic demand and wage growth.

          Ueda has suggested that underlying inflation is approaching but has not yet reached the 2% target. However, this view is not unanimous. Hawkish board member Hajime Takata argued that underlying inflation has already hit 2%, unsuccessfully proposing a rate hike in January.

          The BOJ uses several data points to gauge underlying inflation, including the trimmed mean, mode, and weighted median price indices. In a sign of moderating price pressures for some items, all three of these indices showed year-on-year growth falling below 2% in December.

          Market Expectations for the Next Rate Hike

          Market participants are weighing when the BOJ will act next.

          • Analysts' View: A Reuters poll from earlier this month found that most analysts expect the central bank to wait until July before raising rates again. Over 75% of those surveyed anticipate rates climbing to 1% or higher by September.

          • Swap Market Bets: In contrast, swap markets are pricing in a more aggressive timeline, with roughly an 80% probability of a rate hike to 1.0% by April. This expectation is fueled by the view that the yen's recent declines will accelerate inflation.

          The BOJ's next policy meetings are scheduled for March and April, with the latter including a quarterly review of its growth and inflation forecasts.

          To stay updated on all economic events of today, please check out our Economic calendar
          Risk Warnings and Disclaimers
          You understand and acknowledge that there is a high degree of risk involved in trading. Following any strategies or investment methods may lead to potential losses. The content on the site is provided by our contributors and analysts for information purposes only. You are solely responsible for determining whether any trading assets, securities, strategy, or any other product is suitable for investing based on your own investment objectives and financial situation.
          Add to Favorites
          Share
          FastBull
          Copyright © 2026 FastBull Ltd

          728 RM B 7/F GEE LOK IND BLDG NO 34 HUNG TO RD KWUN TONG KLN HONG KONG

          TelegramInstagramTwitterfacebooklinkedin
          App Store Google Play Google Play
          Products
          Charts

          Chats

          Q&A with Experts
          Screeners
          Economic Calendar
          Data
          Tools
          Membership
          Features
          Function
          Markets
          Copy Trading
          Latest Signals
          Contests
          News
          Analysis
          24/7
          Columns
          Education
          Company
          Careers
          About Us
          Contact Us
          Advertising
          Help Center
          Feedback
          User Agreement
          Privacy Policy
          Personal Information Protection Statement
          Business

          White Label

          Data API

          Web Plug-ins

          Poster Maker

          Affiliate Program

          Risk Disclosure

          The risk of loss in trading financial instruments such as stocks, FX, commodities, futures, bonds, ETFs and crypto can be substantial. You may sustain a total loss of the funds that you deposit with your broker. Therefore, you should carefully consider whether such trading is suitable for you in light of your circumstances and financial resources.

          No decision to invest should be made without thoroughly conducting due diligence by yourself or consulting with your financial advisors. Our web content might not suit you since we don't know your financial conditions and investment needs. Our financial information might have latency or contain inaccuracy, so you should be fully responsible for any of your trading and investment decisions. The company will not be responsible for your capital loss.

          Without getting permission from the website, you are not allowed to copy the website's graphics, texts, or trademarks. Intellectual property rights in the content or data incorporated into this website belong to its providers and exchange merchants.

          Not Logged In

          Log in to access more features

          Connect Broker
          Become a signal provider
          Help Center
          Customer Service
          Dark Mode
          Price Up/Down Colors

          Log In

          Sign Up

          Position
          Layout
          Fullscreen
          Default to Chart
          The chart page opens by default when you visit fastbull.com