• Trade
  • Markets
  • Copy
  • Contests
  • News
  • 24/7
  • Calendar
  • Q&A
  • Chats
Trending
Screeners
SYMBOL
LAST
BID
ASK
HIGH
LOW
NET CHG.
%CHG.
SPREAD
SPX
S&P 500 Index
6920.92
6920.92
6920.92
6965.70
6919.18
-23.90
-0.34%
--
DJI
Dow Jones Industrial Average
48996.07
48996.07
48996.07
49621.43
48951.99
-466.00
-0.94%
--
IXIC
NASDAQ Composite Index
23584.26
23584.26
23584.26
23723.37
23504.22
+37.10
+ 0.16%
--
USDX
US Dollar Index
98.910
98.990
98.910
98.990
98.840
-0.010
-0.01%
--
EURUSD
Euro / US Dollar
1.16436
1.16443
1.16436
1.16518
1.16359
+0.00017
+ 0.01%
--
GBPUSD
Pound Sterling / US Dollar
1.34370
1.34378
1.34370
1.34491
1.34190
+0.00163
+ 0.12%
--
XAUUSD
Gold / US Dollar
4627.29
4627.63
4627.29
4639.52
4588.51
+41.19
+ 0.90%
--
WTI
Light Sweet Crude Oil
60.410
60.440
60.410
60.933
60.354
-0.446
-0.73%
--

Community Accounts

Signal Accounts
--
Profit Accounts
--
Loss Accounts
--
View More

Become a signal provider

Sell trading signals to earn additional income

View More

Guide to Copy Trading

Get started with ease and confidence

View More

Signal Accounts for Members

All Signal Accounts

Best Return
  • Best Return
  • Best P/L
  • Best MDD
Past 1W
  • Past 1W
  • Past 1M
  • Past 1Y

All Contests

  • All
  • Trump Updates
  • Recommend
  • Stocks
  • Cryptocurrencies
  • Central Banks
  • Featured News
Top News Only
Share

Bank Of Japan Puts Self Defense Ahead Of Solidarity With Fed's Chairman Powell

Share

Fresnillo Shares Hit Record High, Up 3.5% As Silver Breaks Above $90

Share

Bank Of England's Taylor: At-Target Inflation From Mid-2026 Is Likely To Be Sustainable

Share

European Central Bank Governing Council Member Villeroy: Livret A Rate Could Go Down A Bit But Should Stay Above Inflation Rate

Share

European Central Bank Governing Council Member Villeroy: If The Budget Deficit Were To Be Higher Than 5% In 2026, France Would Enter The Danger Zone

Share

China Foreign Ministry, On Trump Comment About Iran Protesters: Opposes Outside Interference In Internal Affairs

Share

Japan Chief Cabinet Secretary Kihara: Important For Currencies To Move In Stable Manner Reflecting Fundamentals

Share

Stats Office - Swedish Household Consumption 1.0% Month-On-Month In November

Share

Eurostoxx 50 Futures Up 0.08%, DAX Futures Down 0.05%, FTSE Futures Up 0.14%

Share

Swedish Industry Orders +23.0 % Year-On-Year In November

Share

Romanian Consumer Price Inflation At 9.69% Year-On-Year In December Versus Forecast 9.65% - Stats Board

Share

Romanian Consumer Price Inflation At 0.22% Month-On-Month In December - Stats Board

Share

Kuwait Oct CPI +0.07% Month-On-Month

Share

Kuwait Oct CPI +2.46% Year-On-Year

Share

French Foreign Affairs Minister: France Will Open Consulate In Greenland On Feb 6

Share

French Foreign Affairs Minister: USA Administration Blackmail On Greenland Must Stop

Share

French Foreign Affairs Minister: Ibelieves Crackdown In Iran Is Probably Most Violent In Contemporary History Of Iran

Share

[US Launches Nearly 600 Unilateral Military Strikes In One Year] Newsweek Reported On January 13 That In His First Year Back In The White House, US President Trump Has Ordered Nearly 600 Unilateral Military Strikes On Foreign Soil. The Report Cited Data Released That Day By The Armed Conflict Locations And Events Database Project, Which Focuses On Global Conflict Activities, Stating That From January 20, 2025 To January 5, 2026, The US Conducted 573 Airstrikes And Drone Strikes. If Attacks Carried Out In Cooperation With Allies Are Included, The Trump Administration Has Launched A Total Of 658 Attacks

Share

India's Dec Manufacturing Inflation At 1.82% Year-On-Year

Share

India's Wholesale Price Food Index At 0.00% Year-On-Year In Dec

TIME
ACT
FCST
PREV
U.S. Cleveland Fed CPI MoM (SA) (Dec)

A:--

F: --

P: --

U.S. Cleveland Fed CPI MoM (Dec)

A:--

F: --

P: --

China, Mainland M0 Money Supply YoY (Dec)

--

F: --

P: --

China, Mainland M1 Money Supply YoY (Dec)

--

F: --

P: --

China, Mainland M2 Money Supply YoY (Dec)

--

F: --

P: --

U.S. EIA Natural Gas Production Forecast For The Next Year (Jan)

A:--

F: --

P: --

U.S. EIA Short-Term Crude Production Forecast For The Next Year (Jan)

A:--

F: --

P: --

U.S. EIA Short-Term Crude Production Forecast For The Year (Jan)

A:--

F: --

P: --

EIA Monthly Short-Term Energy Outlook
U.S. 30-Year Bond Auction Avg. Yield

A:--

F: --

P: --

Argentina 12-Month CPI (Dec)

A:--

F: --

P: --

U.S. Budget Balance (Dec)

A:--

F: --

P: --

Argentina CPI MoM (Dec)

A:--

F: --

P: --

Argentina National CPI YoY (Dec)

A:--

F: --

P: --

Richmond Federal Reserve President Barkin delivered a speech.
U.S. API Weekly Cushing Crude Oil Stocks

A:--

F: --

P: --

U.S. API Weekly Crude Oil Stocks

A:--

F: --

P: --

U.S. API Weekly Refined Oil Stocks

A:--

F: --

P: --

U.S. API Weekly Gasoline Stocks

A:--

F: --

P: --

South Korea Unemployment Rate (SA) (Dec)

A:--

F: --

P: --

Japan Reuters Tankan Non-Manufacturers Index (Jan)

A:--

F: --

P: --

Japan Reuters Tankan Manufacturers Index (Jan)

A:--

F: --

P: --

China, Mainland Exports YoY (CNH) (Dec)

A:--

F: --

P: --

China, Mainland Trade Balance (USD) (Dec)

A:--

F: --

P: --

China, Mainland Trade Balance (CNH) (Dec)

A:--

F: --

P: --

China, Mainland Exports (Dec)

A:--

F: --

P: --

China, Mainland Imports YoY (CNH) (Dec)

A:--

F: --

P: --

China, Mainland Imports (CNH) (Dec)

A:--

F: --

P: --

China, Mainland Imports YoY (USD) (Dec)

A:--

F: --

P: --

China, Mainland Exports YoY (USD) (Dec)

A:--

F: --

P: --

China, Mainland Outstanding Loans Growth YoY (Dec)

--

F: --

P: --

U.K. 10-Year Note Auction Yield

--

F: --

P: --

Canada Leading Index MoM (Dec)

--

F: --

P: --

U.S. MBA Mortgage Application Activity Index WoW

--

F: --

P: --

U.S. Core PPI YoY (Nov)

--

F: --

P: --

U.S. PPI MoM (SA) (Nov)

--

F: --

P: --

U.S. PPI YoY (Nov)

--

F: --

P: --

U.S. Current Account (Q3)

--

F: --

P: --

U.S. Retail Sales YoY (Nov)

--

F: --

P: --

U.S. Retail Sales (Nov)

--

F: --

P: --

U.S. Core Retail Sales MoM (Nov)

--

F: --

P: --

U.S. PPI YoY (Excl. Food, Energy & Trade) (Nov)

--

F: --

P: --

U.S. PPI MoM Final (Excl. Food, Energy and Trade) (SA) (Nov)

--

F: --

P: --

U.S. Core Retail Sales (Nov)

--

F: --

P: --

U.S. Retail Sales MoM (Excl. Automobile) (SA) (Nov)

--

F: --

P: --

U.S. Retail Sales MoM (Nov)

--

F: --

P: --

U.S. Retail Sales MoM (Excl. Gas Stations & Vehicle Dealers) (SA) (Nov)

--

F: --

P: --

U.S. Core PPI MoM (SA) (Nov)

--

F: --

P: --

Philadelphia Fed President Henry Paulson delivers a speech
U.S. Commercial Inventory MoM (Oct)

--

F: --

P: --

U.S. Existing Home Sales Annualized Total (Dec)

--

F: --

P: --

U.S. Existing Home Sales Annualized MoM (Dec)

--

F: --

P: --

U.S. EIA Weekly Cushing, Oklahoma Crude Oil Stocks Change

--

F: --

P: --

U.S. EIA Weekly Crude Stocks Change

--

F: --

P: --

U.S. EIA Weekly Gasoline Stocks Change

--

F: --

P: --

U.S. EIA Weekly Crude Demand Projected by Production

--

F: --

P: --

U.S. EIA Weekly Crude Oil Imports Changes

--

F: --

P: --

U.S. EIA Weekly Heating Oil Stock Changes

--

F: --

P: --

U.S. Refinitiv/Ipsos Primary Consumer Sentiment Index (PCSI) (Jan)

--

F: --

P: --

Japan Domestic Enterprise Commodity Price Index YoY (Dec)

--

F: --

P: --

Japan Domestic Enterprise Commodity Price Index MoM (Dec)

--

F: --

P: --

Q&A with Experts
    • All
    • Chatrooms
    • Groups
    • Friends
    Nawhdir. Øt flag
    Nawhdir. Øt
    don't let it go beyond that
    EuroTrader flag
    Nawhdir. Øt
    @Nawhdir. Øti would prefer a pure ecn broker actually, market makers are out of it for me cousin
    3160004 flag
    todaye gold bias upsude or downside ?
    Nawhdir. Øt flag
    EuroTrader
    @EuroTraderwhat about Straight Through P ?
    EuroTrader flag
    Nawhdir. Øt
    @Nawhdir. Øthow about you look out for Prime brokers rather than hybrid brokers my cousin for the safety of your funds
    SlowBear ⛅ flag
    3160004
    todaye gold bias upsude or downside ?
    @3160004Gold bias today is upside visitor, long term today
    Nawhdir. Øt flag
    SlowBear ⛅
    @SlowBear ⛅In your opinion, which of the two is more reliable?
    Kevedge FX flag
    SESSION PRINT AT BEST
    EuroTrader flag
    Nawhdir. Øt
    @Nawhdir. Øtwont even try doing business with a STP broker if am managing such account size in the first place
    SlowBear ⛅ flag
    Nawhdir. Øt
    @Nawhdir. Øt i think i will say the market maker are more relaible
    SlowBear ⛅ flag
    Nawhdir. Øt
    @Nawhdir. ØtYou cannot play the market maker and marker really just do their things and it is not personal
    EuroTrader flag
    Nawhdir. Øt
    @Nawhdir. ØtYou should be trading with brokers like Charles schwab or Td Ameritrade
    Kevedge FX flag
    SlowBear ⛅ flag
    SlowBear ⛅
    @Nawhdir. Øt hybrid broker come to you directly, if you are tagged with different risk or classiified wrongly in their system and you wen ahead to make crazy profit you will likely get smoked intentionally
    Nawhdir. Øt flag
    SlowBear ⛅
    @SlowBear ⛅yes, that's what my friend experienced
    SlowBear ⛅ flag
    Nawhdir. Øt
    @Nawhdir. Øt exactly, when you are wrongly classified as a trader on an hybrid broker platform and all of a suddent you start making crasy profits - but you are classified as a beginner to lose money in less than 2momths but you have made money consistently, you will see some crazy manipulations or failure or sow withdrwal accesss
    Nawhdir. Øt flag
    SlowBear ⛅
    @SlowBear ⛅luckily, I'm still fluent
    Nawhdir. Øt flag
    That's why I really watch my tempo on this big account, rarely make transactions, but once I make a transaction, I have to hold it for a long time, and stick to lot management.
    Nawhdir. Øt flag
    Nawhdir. Øt
    That's why I really watch my tempo on this big account, rarely make transactions, but once I make a transaction, I have to hold it for a long time, and stick to lot management.
    and should also be rare in withdrawing funds
    Nawhdir. Øt flag
    but once the withdrawal is at least $100,000
    Type here...
    Add Symbol or Code

      No matching data

      All
      Trump Updates
      Recommend
      Stocks
      Cryptocurrencies
      Central Banks
      Featured News
      • All
      • Russia-Ukraine Conflict
      • Middle East Flashpoint
      • All
      • Russia-Ukraine Conflict
      • Middle East Flashpoint
      Search
      Products

      Charts Free Forever

      Chats Q&A with Experts
      Screeners Economic Calendar Data Tools
      Membership Features
      Data Warehouse Market Trends Institutional Data Policy Rates Macro

      Market Trends

      Market Sentiment Order Book Forex Correlations

      Top Indicators

      Charts Free Forever
      Markets

      News

      News Analysis 24/7 Columns Education
      From Institutions From Analysts
      Topics Columnists

      Latest Views

      Latest Views

      Trending Topics

      Top Columnists

      Latest Update

      Signals

      Copy Rankings Latest Signals Become a signal provider AI Rating
      Contests
      Brokers

      Overview Brokers Assessment Rankings Regulators News Claims
      Broker listing Forex Brokers Comparison Tool Live Spread Comparison Scam
      Q&A Complaint Scam Alert Videos Tips to Detect Scam
      More

      Business
      Events
      Careers About Us Advertising Help Center

      White Label

      Data API

      Web Plug-ins

      Affiliate Program

      Awards Institution Evaluation IB Seminar Salon Event Exhibition
      Vietnam Thailand Singapore Dubai
      Fans Party Investment Sharing Session
      FastBull Summit BrokersView Expo
      Recent Searches
        Top Searches
          Markets
          News
          Analysis
          User
          24/7
          Economic Calendar
          Education
          Data
          • Names
          • Latest
          • Prev

          View All

          No data

          Scan to Download

          Faster Charts, Chat Faster!

          Download App
          English
          • English
          • Español
          • العربية
          • Bahasa Indonesia
          • Bahasa Melayu
          • Tiếng Việt
          • ภาษาไทย
          • Français
          • Italiano
          • Türkçe
          • Русский язык
          • 简中
          • 繁中
          Open Account
          Search
          Products
          Charts Free Forever
          Markets
          News
          Signals

          Copy Rankings Latest Signals Become a signal provider AI Rating
          Contests
          Brokers

          Overview Brokers Assessment Rankings Regulators News Claims
          Broker listing Forex Brokers Comparison Tool Live Spread Comparison Scam
          Q&A Complaint Scam Alert Videos Tips to Detect Scam
          More

          Business
          Events
          Careers About Us Advertising Help Center

          White Label

          Data API

          Web Plug-ins

          Affiliate Program

          Awards Institution Evaluation IB Seminar Salon Event Exhibition
          Vietnam Thailand Singapore Dubai
          Fans Party Investment Sharing Session
          FastBull Summit BrokersView Expo

          December CPI: Why Real Inflation Is Just Getting Started

          Justin

          Economic

          Remarks of Officials

          Data Interpretation

          Central Bank

          Summary:

          December CPI masks deeper inflation: surging money supply and renewed Fed QE point to persistent price pressures.

          The December Consumer Price Index (CPI) report was as complex as analysts predicted, but the real story of inflation isn't in the headline numbers. A closer look at money supply and central bank activity reveals pressures that the official data may be missing.

          Decoding the December CPI Numbers

          At first glance, the December inflation data seemed to align with expectations, offering a sliver of optimism for markets hoping for future monetary easing.

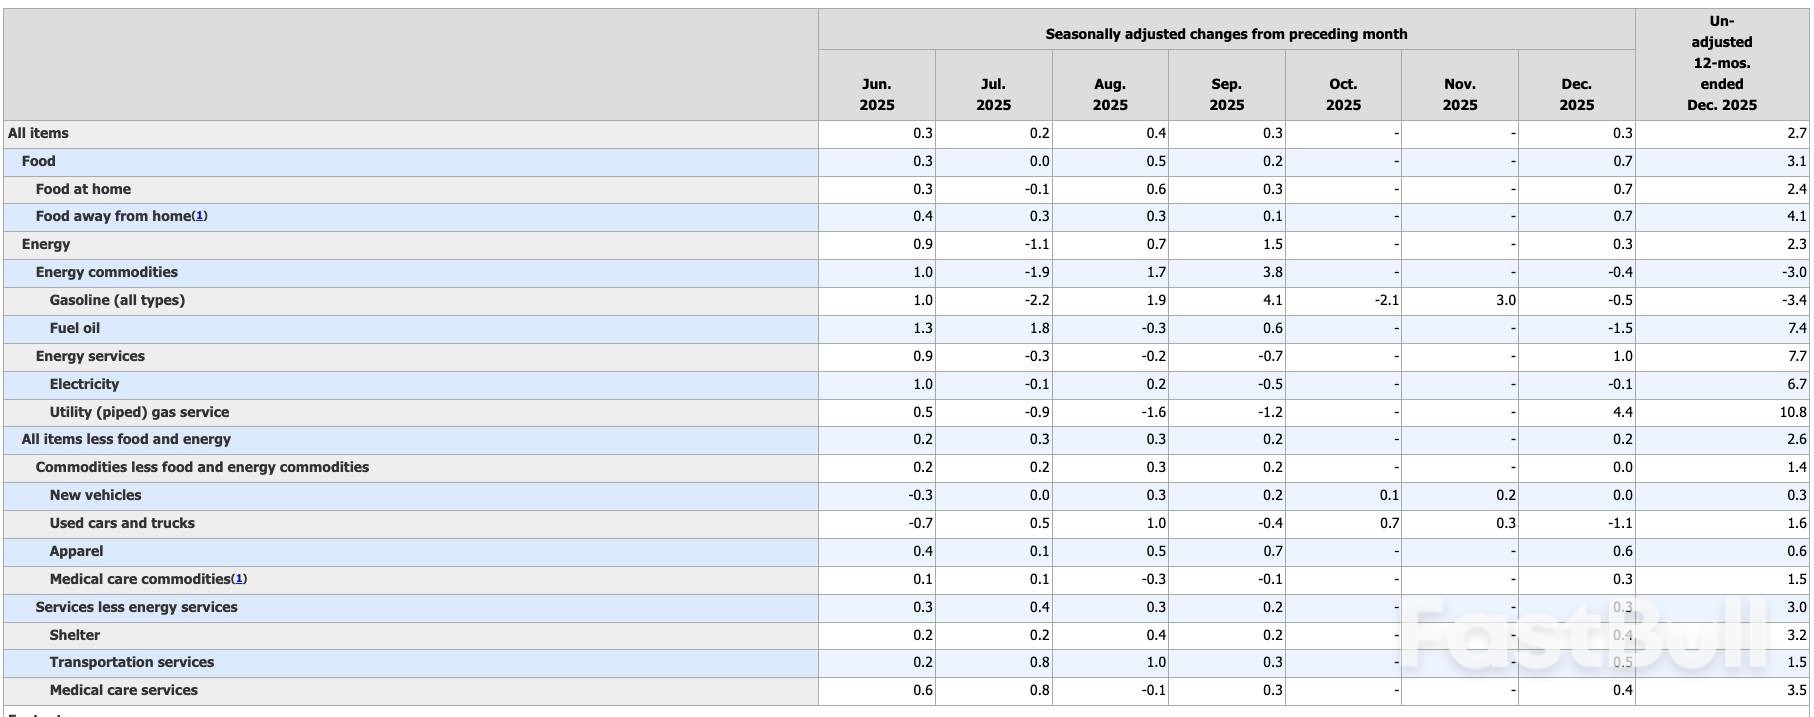
          The overall CPI rose 0.3% month-on-month, holding the annual inflation rate steady at 2.7%. When stripping out volatile food and energy costs, the core CPI increased by 0.2% for the month, with the annual rate unchanged at 2.6%. This slightly cooler-than-expected core reading fueled speculation that the Federal Reserve might continue easing monetary policy in 2026.

          However, a persistent trend lies beneath the surface. Over the last six available readings, core CPI has posted increases of 0.2%, 0.3%, 0.3%, 0.2%, 0.2%, and 0.2%. This pattern annualizes to a rate of 2.8%, showing that core inflation has been stuck in this range for over a year.

          A detailed breakdown of the December report shows specific price pressures:

          • Shelter: Increased by 0.4%

          • Food: Surged by 0.7%

          • Energy: Rose by 0.3%, even as gasoline prices fell 0.4%

          • Services: Grew by 0.3%

          • Used Cars & Trucks: Posted the largest decline, falling 1.1%

          A table showing the monthly percentage change in the Consumer Price Index for various categories from June to December 2025.

          The Limits of Official Inflation Data

          It’s crucial to approach the CPI report with caution. The data's reliability has been questioned, particularly following a November report some critics described as heavily estimated.

          Furthermore, the government's methodology for calculating CPI was revised in the 1990s, leading to a formula that many argue systematically understates the true rise in the cost of living. If the formula from the 1970s were still in use, today's official CPI figures would likely be closer to 6%.

          Even based on the current official data, inflation remains well above the Federal Reserve's target. As Ellen Zentner, chief economic strategist at Morgan Stanley, noted, the situation feels familiar.

          "We've seen this movie before—inflation isn't reheating, but it remains above target," Zentner stated. "Today's inflation report doesn't give the Fed what it needs to cut interest rates later this month."

          The True Driver: Accelerating Money Supply

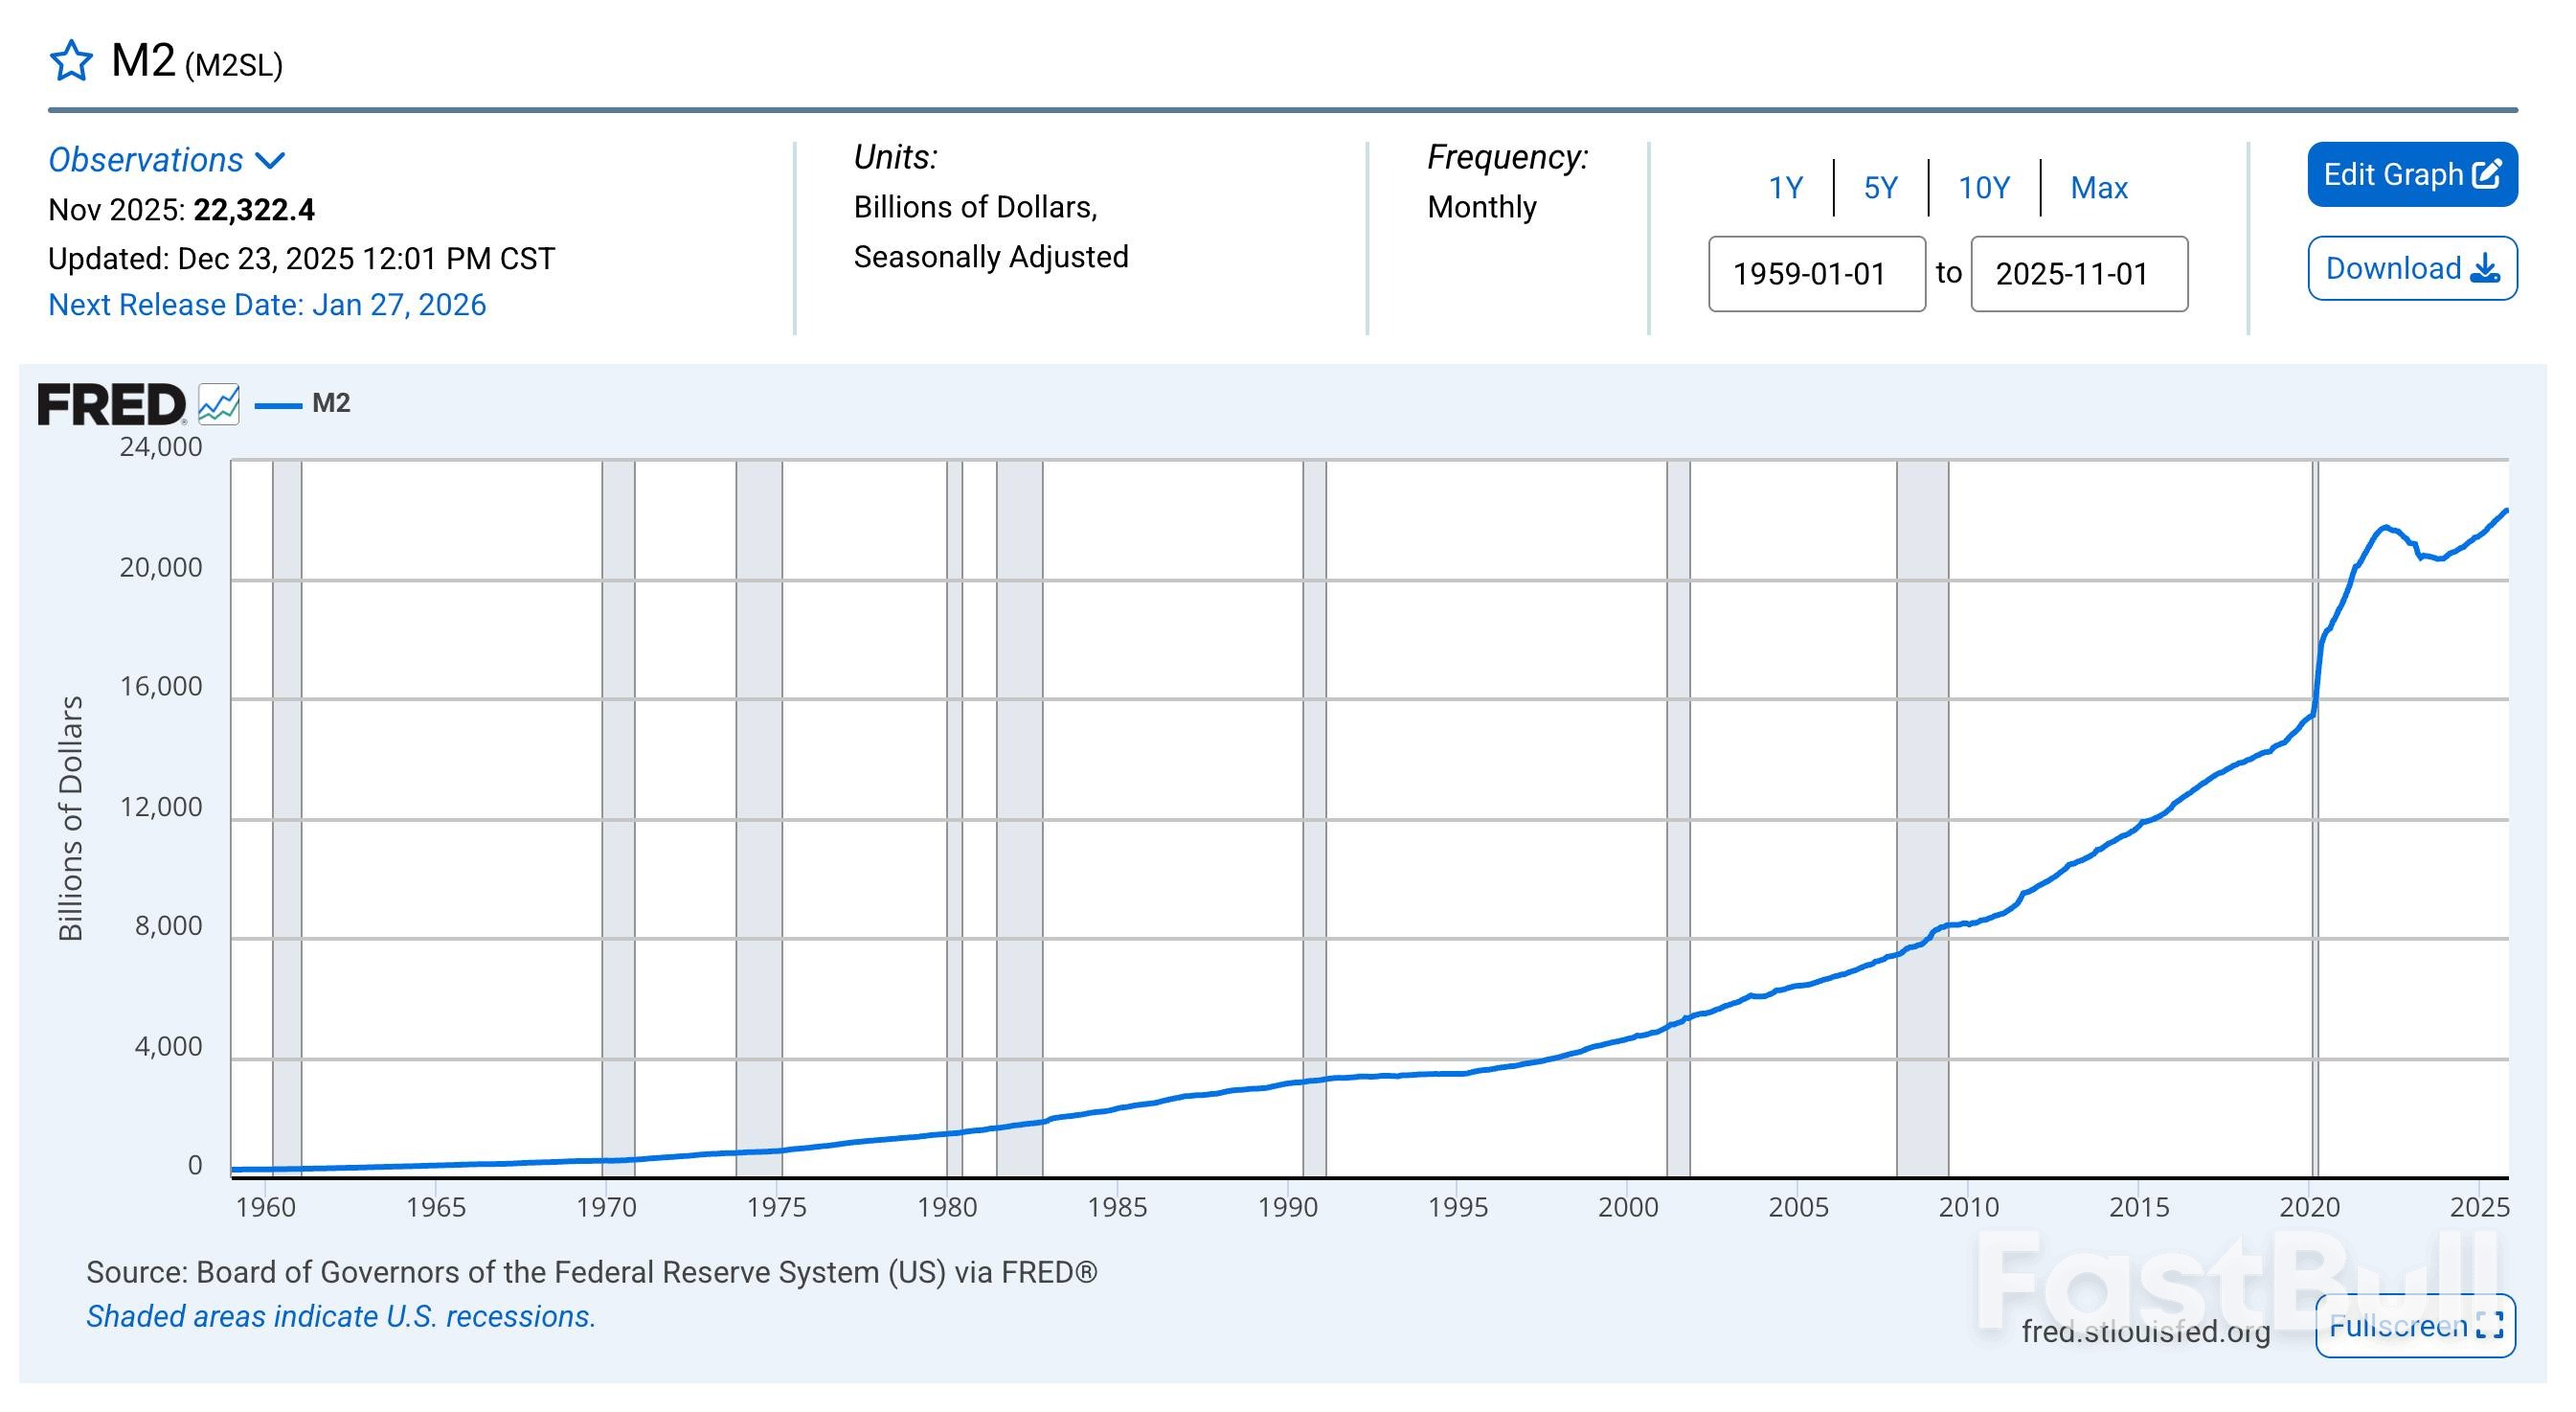
          The CPI measures price changes in a specific basket of goods, but it only captures a symptom of inflation. Historically, economists defined inflation as an increase in the supply of money and credit. Rising prices are the consequence of this monetary expansion.

          By this fundamental measure, inflation is not only present but accelerating. The M2 money supply is currently growing at its fastest rate since July 2022. After hitting a low in October 2023, the money supply has resumed its upward trajectory, now surpassing its pandemic-era peak as money creation has quickened in recent months.

          A chart from the Federal Reserve Economic Data (FRED) shows the M2 money stock in billions of dollars from 1959 to November 2025, highlighting a sharp increase beginning in 2020.

          The Fed's Quiet Relaunch of QE

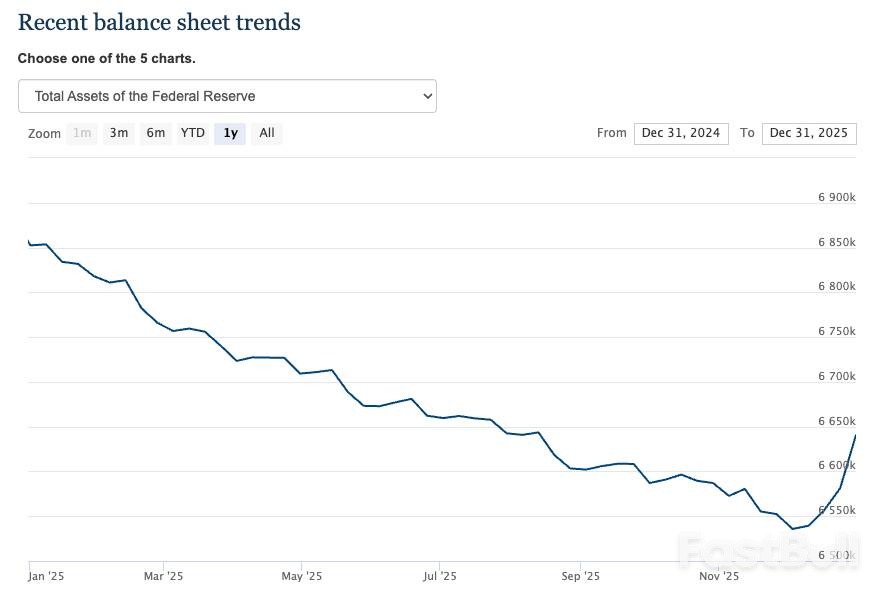
          Further evidence of rising inflationary pressure comes from the Federal Reserve's balance sheet, which is once again expanding.

          Last month, the central bank resumed purchasing U.S. Treasuries with newly created money, effectively restarting its quantitative easing (QE) program. This direct injection of liquidity into the financial system is, by definition, inflationary.

          A graph illustrates the recent trend of the Federal Reserve's total assets, showing a decline through most of 2025 followed by a distinct increase in December.

          The Fed's Catch-22: No Easy Way Out

          This leads to a fundamental conflict for the central bank. The Fed is caught in a Catch-22: it needs to loosen monetary policy through rate cuts and QE to support a debt-laden economy, but it also needs higher rates to bring price inflation back under control. It cannot do both at the same time.

          Any "cooler than expected" CPI report provides political cover to prioritize easing, despite official rhetoric aimed at managing expectations. This dynamic ensures that even if official price metrics cool temporarily, the underlying inflationary forces are likely to grow stronger.

          To stay updated on all economic events of today, please check out our Economic calendar
          Risk Warnings and Disclaimers
          You understand and acknowledge that there is a high degree of risk involved in trading. Following any strategies or investment methods may lead to potential losses. The content on the site is provided by our contributors and analysts for information purposes only. You are solely responsible for determining whether any trading assets, securities, strategy, or any other product is suitable for investing based on your own investment objectives and financial situation.
          Add to Favorites
          Share

          Silver Breaks $90 As Monetary Anxiety And Geopolitics Supercharge Precious Metals Rally

          Gerik

          Economic

          Commodity

          A New Milestone For Silver And Gold

          Silver vaulted past the $90-per-ounce threshold, reaching as high as $91.5535, marking an unprecedented milestone for the metal. Gold followed closely, trading within $10 of its all-time high. This advance reflects a continuation of the powerful rally that began last year rather than a short-lived reaction to a single data release. December inflation data in the United States came in softer than feared, although economists noted that the figures were temporarily suppressed by distortions linked to the prolonged government shutdown. That outcome strengthened market confidence that monetary policy conditions may eventually ease further, supporting non-yielding assets such as precious metals.
          Markets currently expect the Federal Reserve to pause rate cuts for several months, yet swaps pricing still points to at least two cuts later in the year. This outlook has reinforced demand for gold and silver through a direct transmission channel, as lower expected real rates tend to improve the relative attractiveness of metals. At the same time, renewed political attacks on Federal Reserve Chair Jerome Powell have revived concerns about central bank autonomy. While global central bankers and senior Wall Street executives have publicly defended Powell, the episode has increased sensitivity to institutional risk. This relationship is largely correlational rather than mechanical, with investor confidence responding to perceived governance stability rather than immediate changes in policy settings.

          Geopolitical Stress And Haven Demand

          Safe-haven demand has been amplified by a tense geopolitical environment. Developments such as the U.S. capture of Venezuela’s leader, renewed rhetoric over Greenland, and escalating unrest in Iran have heightened perceptions of global instability. These events have not directly disrupted precious metal supply, but they have elevated risk aversion, which historically correlates with stronger inflows into gold and silver. Citigroup responded to this backdrop by upgrading its three-month price targets to $5,000 an ounce for gold and $100 an ounce for silver, underscoring expectations that elevated uncertainty will continue to support prices.
          Silver’s outperformance relative to gold has been notable. The metal gained roughly 150 percent last year, driven by a combination of a short squeeze in October, persistent physical tightness in London, and aggressive speculative positioning. Analysts also point to a broader rotation into commodities as investors seek diversification away from traditional financial assets. According to Lotus Asset Management’s Hao Hong, the rally still has room to extend, with prices potentially reaching $150 an ounce by year-end. This projection reflects momentum and positioning dynamics rather than a guaranteed price path.

          Supply Constraints And Trade Policy Risks

          Uncertainty surrounding U.S. trade policy has added another layer of complexity. Traders are watching the outcome of a Section 232 investigation that could result in import tariffs on silver. Fear of such measures has already altered physical flows, with large quantities of silver reportedly remaining in the United States rather than circulating globally. This has tightened availability elsewhere, reinforcing price strength. The link here is indirect, as policy uncertainty influences inventory behavior, which then affects market balance.
          The latest surge highlights the scale of investment flows into precious metals. Trading volumes on Comex and the Shanghai Futures Exchange have remained elevated since late December, signaling sustained speculative and institutional participation. Platinum and palladium have also joined the rally, each gaining more than 4 percent, suggesting broad-based interest rather than isolated enthusiasm for silver alone. The Bloomberg Dollar Spot Index remained steady, removing currency volatility as a primary driver of the move.
          Strategists caution that while demand for precious metals as a hedge against inflation and financial instability is likely to persist, gains in 2026 may not match the extraordinary pace seen last year. Some analysts expect gold to outperform silver over time due to its deeper liquidity and stronger association with geopolitical risk. Even so, the break above $90 has reinforced silver’s status as a high-beta expression of macro uncertainty, leaving prices highly sensitive to shifts in monetary expectations, policy credibility, and global risk sentiment.

          Source: Bloomberg

          To stay updated on all economic events of today, please check out our Economic calendar
          Risk Warnings and Disclaimers
          You understand and acknowledge that there is a high degree of risk involved in trading. Following any strategies or investment methods may lead to potential losses. The content on the site is provided by our contributors and analysts for information purposes only. You are solely responsible for determining whether any trading assets, securities, strategy, or any other product is suitable for investing based on your own investment objectives and financial situation.
          Add to Favorites
          Share

          US Inflation Holds Steady at 2.7% for December 2025

          Natalie Gordon

          Economic

          Cryptocurrency

          Data Interpretation

          Central Bank

          The latest data from the U.S. Bureau of Labor Statistics confirms that headline inflation remained at 2.7% for the year ending in December 2025, signaling a period of continued economic stability.

          This figure, which met market expectations, provides crucial insight for both Federal Reserve policymakers and market participants, including those in the cryptocurrency space. The report also showed that core inflation, which strips out volatile food and energy prices, held firm at 2.6%.

          A Deeper Look at the Inflation Data

          The December 2025 report revealed no month-over-month changes from November, reinforcing the theme of price stability. The primary components driving the annual figure include:

          • Energy Prices: Increased by 2.3% year-over-year.

          • Food Prices: Rose by 3.1% over the same period.

          The consistency in these numbers suggests that the underlying price pressures in the economy are not accelerating, providing a predictable environment for businesses and consumers.

          What Stable Inflation Means for Fed Policy

          With both headline and core inflation showing no unexpected volatility, the Federal Reserve is less likely to make aggressive adjustments to its monetary policy. Economists widely believe that this trend of stable inflation supports the case for holding interest rates steady in upcoming policy meetings.

          Continued stability over several months could strengthen confidence in the effectiveness of current economic strategies and allow for more predictable financial planning.

          Crypto Markets Remain Unfazed

          The cryptocurrency sector registered no significant reaction to the inflation report. Market analysts noted that major assets like Bitcoin and Ethereum did not experience any immediate volatility following the release of the data.

          This lack of response is typical when economic figures align with consensus forecasts. Since the stable inflation numbers did not introduce new uncertainty into the broader financial landscape, the crypto market continued to trade on its own specific drivers and sentiment.

          To stay updated on all economic events of today, please check out our Economic calendar
          Risk Warnings and Disclaimers
          You understand and acknowledge that there is a high degree of risk involved in trading. Following any strategies or investment methods may lead to potential losses. The content on the site is provided by our contributors and analysts for information purposes only. You are solely responsible for determining whether any trading assets, securities, strategy, or any other product is suitable for investing based on your own investment objectives and financial situation.
          Add to Favorites
          Share

          China’s Trade Surplus Breaks $1.2 Trillion As Export Engine Offsets U.S. Slowdown

          Gerik

          Economic

          A Record Surplus Driven By Export Momentum

          China’s trade surplus expanded to almost $1.2 trillion in 2025, the largest on record, reflecting the outsized role exports continue to play in stabilizing the economy. Customs data showed total exports rose 5.5% over the year to $3.77 trillion, while imports stagnated at $2.58 trillion. This compares with a surplus of $992 billion in 2024, underscoring how the gap between outbound and inbound trade has widened rather than narrowed. The expansion of the surplus is causally linked to stronger export growth rather than a collapse in imports, pointing to external demand as the dominant force.
          Momentum strengthened toward the end of the year. In December, exports increased 6.6% year on year in dollar terms, exceeding economists’ expectations and accelerating from November’s 5.9% pace. Imports also picked up, rising 5.7% year on year compared with 1.9% in November. The simultaneous rise in exports and imports suggests improving trade activity rather than a contraction-driven surplus, reinforcing the view that China remains deeply integrated into global supply chains despite geopolitical headwinds.

          Shifting Trade Geography Away From The U.S.

          Exports to the United States have declined sharply since President Donald Trump returned to office and intensified trade tensions. However, this weakness has been largely offset by stronger shipments to South America, Southeast Asia, Africa, and Europe. This reflects a structural reorientation of China’s trade patterns rather than a temporary diversion. The relationship here is compensatory: reduced access to the U.S. market has pushed firms to deepen penetration elsewhere, maintaining aggregate export growth even as bilateral tensions rise.
          Robust export performance has helped China’s economy grow at an annual rate close to its official target of around 5%. Economists broadly expect this dynamic to persist into 2026. BNP Paribas’ chief China economist Jacqueline Rong said exports are likely to remain a major growth driver this year, highlighting how external demand continues to fill gaps left by softer domestic consumption and investment. This dependence is causal, as exports directly contribute to output and employment, particularly in manufacturing-heavy regions.

          Rising Global Tensions And Policy Pushback

          The scale of China’s surplus has raised concerns among trading partners worried about a surge of low-cost imports undermining domestic industries. The head of the International Monetary Fund recently urged China to address its economic imbalances and accelerate a shift away from export-led growth toward stronger domestic demand and investment. These calls reflect a correlation between China’s surplus expansion and rising protectionist sentiment abroad, which could feed back into future trade constraints.
          China’s prolonged property downturn continues to weigh on consumer confidence and internal demand. The slump followed regulatory crackdowns on excessive borrowing that led to widespread developer defaults, limiting the recovery of household spending. Against this backdrop, exports remain a stabilizing force. Natixis economist Gary Ng expects export growth to slow to about 3% in 2026, down from roughly 5% in 2025, but still sufficient to keep the trade surplus above $1 trillion.
          Overall, China’s record trade surplus highlights both resilience and vulnerability. While export strength has cushioned the economy against domestic weakness and external shocks, it has also intensified global scrutiny and reinforced calls for rebalancing. The sustainability of this model in 2026 will depend on whether external demand remains robust and how geopolitical frictions evolve.

          Source: Bloomberg

          To stay updated on all economic events of today, please check out our Economic calendar
          Risk Warnings and Disclaimers
          You understand and acknowledge that there is a high degree of risk involved in trading. Following any strategies or investment methods may lead to potential losses. The content on the site is provided by our contributors and analysts for information purposes only. You are solely responsible for determining whether any trading assets, securities, strategy, or any other product is suitable for investing based on your own investment objectives and financial situation.
          Add to Favorites
          Share

          US-India Push for Trade Deal Amid Tariff Tensions

          Ukadike Micheal

          Political

          Remarks of Officials

          Economic

          Energy

          Daily News

          Top Diplomats Tackle Stalled Negotiations

          U.S. Secretary of State Marco Rubio and India's External Affairs Minister Subrahmanyam Jaishankar held discussions on trade Tuesday, raising questions about the future of a long-awaited bilateral deal.

          According to a U.S. Department of State statement, the two officials discussed ongoing trade negotiations, energy security, and critical minerals. The conversation also touched on their "shared interest in strengthening economic cooperation" and expanding bilateral civil nuclear cooperation.

          The call took place just one day after Sergio Gor, the new U.S. ambassador to India, expressed confidence that the two nations, as close partners, would resolve their differences, including the delayed trade agreement.

          Trump-Era Tariffs Strain Bilateral Ties

          The negotiations are happening against a backdrop of a sharp downturn in U.S.-India relations during Donald Trump's second presidency. Washington has imposed tariffs of 50% on India—among the highest in the world—partly due to its purchases of Russian oil.

          Despite months of negotiations and multiple phone calls between Trump and Indian Prime Minister Narendra Modi, India remains one of the few major economies without a trade agreement with the United States.

          Conflicting Signals on the Path Forward

          Recent official comments have sent mixed messages about the deal's progress. Last week, U.S. Commerce Secretary Howard Lutnick claimed a trade agreement failed to materialize last year because Modi did not call Trump. India dismissed this assertion as inaccurate.

          Despite the friction, India has taken steps to appease the Trump administration, such as reducing its purchases of Russian oil. Ambassador Gor noted this week that both sides "continue to actively engage" and are determined to get the trade talks across the finish line.

          To stay updated on all economic events of today, please check out our Economic calendar
          Risk Warnings and Disclaimers
          You understand and acknowledge that there is a high degree of risk involved in trading. Following any strategies or investment methods may lead to potential losses. The content on the site is provided by our contributors and analysts for information purposes only. You are solely responsible for determining whether any trading assets, securities, strategy, or any other product is suitable for investing based on your own investment objectives and financial situation.
          Add to Favorites
          Share

          Takaichi's Election Plan Rattles Japan's Bond Market

          James Riley

          Bond

          Political

          Forex

          Remarks of Officials

          Economic

          Central Bank

          Traders' Opinions

          Daily News

          Japan's latest auction of five-year government bonds showed a clear drop in investor appetite on Wednesday, signaling that mounting political risks are beginning to weigh on the market.

          Bond futures slid after the results were released, confirming investor nervousness. The selloff comes as markets digest reports that Prime Minister Sanae Takaichi is considering a snap election, a move that has revived the so-called "Takaichi trade" and sent the yen tumbling.

          Weak Demand Haunts 5-Year JGB Auction

          The auction's results pointed to weaker-than-average demand. The bid-to-cover ratio, a key metric of investor interest, stood at 3.08. This figure is a decline from the 3.17 ratio recorded at the previous sale in December and falls short of the 12-month average of 3.54.

          In response to the political uncertainty, the five-year government bond rate has surged to 1.615%, its highest level since the bond was first issued in 2000. Another indicator of weak demand, the "tail"—the difference between the average and lowest accepted prices—widened to 0.05 from 0.04 last month.

          Rising Fiscal Risks and BOJ Rate Hike Pressure

          Investors are now bracing for heightened fiscal risks. A snap election could solidify the position of the ruling Liberal Democratic Party, potentially clearing the path for increased government stimulus spending.

          This prospect arrives as Takaichi's government prepares to introduce a record initial budget for the fiscal year starting in April. According to the Ministry of Finance, this new budget will involve reducing the issuance of super-long government bonds while increasing sales of two- and five-year debt.

          At the same time, the yen has fallen to its lowest point against the U.S. dollar since July 2024. This currency weakness is increasing the pressure on the Bank of Japan (BOJ) to consider an early interest rate hike to stabilize the yen.

          Markets Brace for a Potential BOJ Move

          While most economists anticipate the central bank will wait until June before hiking rates again—following its December move to a three-decade high—the yen's persistent slide could force the BOJ to act sooner.

          Former BOJ board member Makoto Sakurai stated in an interview that concerns over Takaichi's fiscal policy could prompt the central bank to raise its benchmark interest rates as early as April.

          Current market pricing reflects this uncertainty. Overnight index swaps show that traders have not fully priced in the first rate hike of the year until July, leaving significant room for market sentiment to shift if the yen's weakness continues.

          To stay updated on all economic events of today, please check out our Economic calendar
          Risk Warnings and Disclaimers
          You understand and acknowledge that there is a high degree of risk involved in trading. Following any strategies or investment methods may lead to potential losses. The content on the site is provided by our contributors and analysts for information purposes only. You are solely responsible for determining whether any trading assets, securities, strategy, or any other product is suitable for investing based on your own investment objectives and financial situation.
          Add to Favorites
          Share

          Asian Equities Edge Higher As Yen Fragility Revives Intervention Fears

          Gerik

          Economic

          Stocks

          Japan Leads Regional Gains Amid Political Speculation

          Asian equity markets advanced modestly on Wednesday, supported primarily by Japanese shares. Investors positioned for the possibility of a snap election in Japan, which local media reported could be called for February 8. The prospect of renewed fiscal stimulus lifted sentiment toward Japanese equities, pushing the Nikkei more than 1% higher to a record level. At the same time, Japanese government bonds fell, reflecting expectations of looser fiscal policy and heavier issuance. This so-called “Takaichi trade” has gained momentum as markets reassess Japan’s fiscal outlook, though some strategists caution that legislative constraints in the upper house may limit how far policy easing can realistically go.
          The Japanese yen slid to 159.415 per dollar, its weakest level since July 2024, sharpening market focus on the risk of official intervention. Currency traders have increasingly treated the 161 level as a psychological threshold, beyond which authorities may feel compelled to act to curb volatility. Strategists noted that a decisive break higher could shift expectations for a Bank of Japan rate hike forward to April, altering the balance of currency dynamics. For now, yen moves are being shaped by anticipation and positioning rather than confirmed policy decisions, keeping volatility elevated.

          Broader Asia And Global Equity Signals

          Beyond Japan, MSCI’s broad Asia-Pacific index rose 0.2%, hovering just below a record high reached earlier in the week. Chinese equities added 0.7% in early trading, staying close to a 10-year peak, while European stock futures pointed to a muted open. U.S. equities closed lower overnight, led by declines in financial shares after comments from JPMorgan executives revived concerns over proposed caps on credit card interest rates. These cross-market moves suggest selective risk-taking rather than a uniform shift in sentiment.
          U.S. inflation data released on Tuesday showed moderate underlying price pressures, reinforcing the view that the pass-through from import tariffs has eased. While the data kept the option of rate cuts later this year in play, markets continue to expect the Federal Reserve to hold rates steady in the near term. Traders are pricing at least two cuts this year, with the first move unlikely until after Fed Chair Jerome Powell’s term ends in May. Analysts noted that inflation is not cooling fast enough to justify imminent easing, which has allowed the dollar to retain support.

          Fed Independence And Currency Market Volatility

          Concerns over Federal Reserve independence continued to influence currency markets. Earlier in the week, the dollar had weakened after the U.S. Justice Department threatened to indict Powell in connection with a building renovation project. That pressure eased after Powell pushed back and global central bank officials issued a coordinated statement backing him. Market participants largely interpreted the episode as political rather than a fundamental institutional risk, reinforcing the perception that existing safeguards around the Fed remain intact. The dollar index edged higher to 99.243, recovering from earlier losses as those fears subsided.
          Geopolitical tensions added another layer of complexity. President Donald Trump urged Iranians to continue protesting, prompting Tehran to accuse Washington of encouraging destabilization. These developments lifted oil prices and propelled safe-haven assets higher. Gold rose 0.6% to $4,613.93 per ounce, while silver jumped more than 2% to a fresh record. The surge in precious metals reflects heightened risk sensitivity rather than changes in physical supply or demand.
          Overall, Asian markets are navigating a fragile balance between stimulus optimism, currency instability, and global political uncertainty. Equity gains remain cautious, underpinned by expectations rather than hard policy shifts, while the yen’s weakness and persistent questions around central bank independence continue to shape cross-asset behavior.

          Source: Reuters

          To stay updated on all economic events of today, please check out our Economic calendar
          Risk Warnings and Disclaimers
          You understand and acknowledge that there is a high degree of risk involved in trading. Following any strategies or investment methods may lead to potential losses. The content on the site is provided by our contributors and analysts for information purposes only. You are solely responsible for determining whether any trading assets, securities, strategy, or any other product is suitable for investing based on your own investment objectives and financial situation.
          Add to Favorites
          Share
          FastBull
          Copyright © 2026 FastBull Ltd

          728 RM B 7/F GEE LOK IND BLDG NO 34 HUNG TO RD KWUN TONG KLN HONG KONG

          TelegramInstagramTwitterfacebooklinkedin
          App Store Google Play Google Play
          Products
          Charts

          Chats

          Q&A with Experts
          Screeners
          Economic Calendar
          Data
          Tools
          Membership
          Features
          Function
          Markets
          Copy Trading
          Latest Signals
          Contests
          News
          Analysis
          24/7
          Columns
          Education
          Company
          Careers
          About Us
          Contact Us
          Advertising
          Help Center
          Feedback
          User Agreement
          Privacy Policy
          Personal Information Protection Statement
          Business

          White Label

          Data API

          Web Plug-ins

          Poster Maker

          Affiliate Program

          Risk Disclosure

          The risk of loss in trading financial instruments such as stocks, FX, commodities, futures, bonds, ETFs and crypto can be substantial. You may sustain a total loss of the funds that you deposit with your broker. Therefore, you should carefully consider whether such trading is suitable for you in light of your circumstances and financial resources.

          No decision to invest should be made without thoroughly conducting due diligence by yourself or consulting with your financial advisors. Our web content might not suit you since we don't know your financial conditions and investment needs. Our financial information might have latency or contain inaccuracy, so you should be fully responsible for any of your trading and investment decisions. The company will not be responsible for your capital loss.

          Without getting permission from the website, you are not allowed to copy the website's graphics, texts, or trademarks. Intellectual property rights in the content or data incorporated into this website belong to its providers and exchange merchants.

          Not Logged In

          Log in to access more features

          FastBull Membership

          Not yet

          Purchase

          Become a signal provider
          Help Center
          Customer Service
          Dark Mode
          Price Up/Down Colors

          Log In

          Sign Up

          Position
          Layout
          Fullscreen
          Default to Chart
          The chart page opens by default when you visit fastbull.com