• Trade
  • Markets
  • Copy
  • Contests
  • News
  • 24/7
  • Calendar
  • Q&A
  • Chats
Trending
Screeners
SYMBOL
LAST
BID
ASK
HIGH
LOW
NET CHG.
%CHG.
SPREAD
SPX
S&P 500 Index
6827.42
6827.42
6827.42
6899.86
6801.80
-73.58
-1.07%
--
DJI
Dow Jones Industrial Average
48458.04
48458.04
48458.04
48886.86
48334.10
-245.98
-0.51%
--
IXIC
NASDAQ Composite Index
23195.16
23195.16
23195.16
23554.89
23094.51
-398.69
-1.69%
--
USDX
US Dollar Index
97.950
98.030
97.950
98.500
97.950
-0.370
-0.38%
--
EURUSD
Euro / US Dollar
1.17394
1.17409
1.17394
1.17496
1.17192
+0.00011
+ 0.01%
--
GBPUSD
Pound Sterling / US Dollar
1.33707
1.33732
1.33707
1.33997
1.33419
-0.00148
-0.11%
--
XAUUSD
Gold / US Dollar
4299.39
4299.39
4299.39
4353.41
4257.10
+20.10
+ 0.47%
--
WTI
Light Sweet Crude Oil
57.233
57.485
57.233
58.011
56.969
-0.408
-0.71%
--

Community Accounts

Signal Accounts
--
Profit Accounts
--
Loss Accounts
--
View More

Become a signal provider

Sell trading signals to earn additional income

View More

Guide to Copy Trading

Get started with ease and confidence

View More

Signal Accounts for Members

All Signal Accounts

Best Return
  • Best Return
  • Best P/L
  • Best MDD
Past 1W
  • Past 1W
  • Past 1M
  • Past 1Y

All Contests

  • All
  • Trump Updates
  • Recommend
  • Stocks
  • Cryptocurrencies
  • Central Banks
  • Featured News
Top News Only
Share

Ukraine Says It Received 114 Prisoners From Belarus

Share

USA Embassy In Lithuania: Maria Kalesnikava Is Not Going To Vilnius

Share

USA Embassy In Lithuania: Other Prisoners Are Being Sent From Belarus To Ukraine

Share

Ukraine President Zelenskiy: Five Ukrainians Released By Belarus In US-Brokered Deal

Share

USA Vilnius Embassy: USA Stands Ready For "Additional Engagement With Belarus That Advances USA Interests"

Share

USA Vilnius Embassy: Belarus, USA, Other Citizens Among The Prisoners Released Into Lithuania

Share

USA Vilnius Embassy: USA Will Continue Diplomatic Efforts To Free The Remaining Political Prisoners In Belarus

Share

USA Vilnius Embassy: Belarus Releases 123 Prisoners Following Meeting Of President Trump's Envoy Coale And Belarus President Lukashenko

Share

USA Vilnius Embassy: Masatoshi Nakanishi, Aliaksandr Syrytsa Are Among The Prisoners Released By Belarus

Share

USA Vilnius Embassy: Maria Kalesnikava And Viktor Babaryka Are Among The Prisoners Released By Belarus

Share

USA Vilnius Embassy: Nobel Peace Prize Laureate Ales Bialiatski Is Among The Prisoners Released By Belarus

Share

Belarusian Presidential Administration Telegram Channel: Lukashenko Has Pardoned 123 Prisoners As Part Of Deal With US

Share

Two Local Syrian Officials: Joint US-Syrian Military Patrol In Central Syria Came Under Fire From Unknown Assailants

Share

Israeli Military Says It Targeted 'Key Hamas Terrorist' In Gaza City

Share

Rwanda's Actions In Eastern Drc Are A Clear Violation Of Washington Accords Signed By President Trump - Secretary Of State Rubio

Share

Israeli Military Issues Evacuation Warning In Southern Lebanon Village Ahead Of Strike - Spokesperson On X

Share

Belarusian State Media Cites US Envoy Coale As Saying He Discussed Ukraine And Venezuela With Lukashenko

Share

Belarusian State Media Cites US Envoy Coale As Saying That US Removes Sanctions On Belarusian Potassium

Share

Thai Prime Minister: No Ceasefire Agreement With Cambodia

Share

US, Ukraine To Discuss Ceasefire In Berlin Ahead Of European Summit

TIME
ACT
FCST
PREV
U.K. Trade Balance Non-EU (SA) (Oct)

A:--

F: --

P: --

U.K. Trade Balance (Oct)

A:--

F: --

P: --

U.K. Services Index MoM

A:--

F: --

P: --

U.K. Construction Output MoM (SA) (Oct)

A:--

F: --

P: --

U.K. Industrial Output YoY (Oct)

A:--

F: --

P: --

U.K. Trade Balance (SA) (Oct)

A:--

F: --

P: --

U.K. Trade Balance EU (SA) (Oct)

A:--

F: --

P: --

U.K. Manufacturing Output YoY (Oct)

A:--

F: --

P: --

U.K. GDP MoM (Oct)

A:--

F: --

P: --

U.K. GDP YoY (SA) (Oct)

A:--

F: --

P: --

U.K. Industrial Output MoM (Oct)

A:--

F: --

P: --

U.K. Construction Output YoY (Oct)

A:--

F: --

P: --

France HICP Final MoM (Nov)

A:--

F: --

P: --

China, Mainland Outstanding Loans Growth YoY (Nov)

A:--

F: --

P: --

China, Mainland M2 Money Supply YoY (Nov)

A:--

F: --

P: --

China, Mainland M0 Money Supply YoY (Nov)

A:--

F: --

P: --

China, Mainland M1 Money Supply YoY (Nov)

A:--

F: --

P: --

India CPI YoY (Nov)

A:--

F: --

P: --

India Deposit Gowth YoY

A:--

F: --

P: --

Brazil Services Growth YoY (Oct)

A:--

F: --

P: --

Mexico Industrial Output YoY (Oct)

A:--

F: --

P: --

Russia Trade Balance (Oct)

A:--

F: --

P: --

Philadelphia Fed President Henry Paulson delivers a speech
Canada Building Permits MoM (SA) (Oct)

A:--

F: --

P: --

Canada Wholesale Sales YoY (Oct)

A:--

F: --

P: --

Canada Wholesale Inventory MoM (Oct)

A:--

F: --

P: --

Canada Wholesale Inventory YoY (Oct)

A:--

F: --

P: --

Canada Wholesale Sales MoM (SA) (Oct)

A:--

F: --

P: --

Germany Current Account (Not SA) (Oct)

A:--

F: --

P: --

U.S. Weekly Total Rig Count

A:--

F: --

P: --

U.S. Weekly Total Oil Rig Count

A:--

F: --

P: --

Japan Tankan Large Non-Manufacturing Diffusion Index (Q4)

--

F: --

P: --

Japan Tankan Small Manufacturing Outlook Index (Q4)

--

F: --

P: --

Japan Tankan Large Non-Manufacturing Outlook Index (Q4)

--

F: --

P: --

Japan Tankan Large Manufacturing Outlook Index (Q4)

--

F: --

P: --

Japan Tankan Small Manufacturing Diffusion Index (Q4)

--

F: --

P: --

Japan Tankan Large Manufacturing Diffusion Index (Q4)

--

F: --

P: --

Japan Tankan Large-Enterprise Capital Expenditure YoY (Q4)

--

F: --

P: --

U.K. Rightmove House Price Index YoY (Dec)

--

F: --

P: --

China, Mainland Industrial Output YoY (YTD) (Nov)

--

F: --

P: --

China, Mainland Urban Area Unemployment Rate (Nov)

--

F: --

P: --

Saudi Arabia CPI YoY (Nov)

--

F: --

P: --

Euro Zone Industrial Output YoY (Oct)

--

F: --

P: --

Euro Zone Industrial Output MoM (Oct)

--

F: --

P: --

Canada Existing Home Sales MoM (Nov)

--

F: --

P: --

Euro Zone Total Reserve Assets (Nov)

--

F: --

P: --

U.K. Inflation Rate Expectations

--

F: --

P: --

Canada National Economic Confidence Index

--

F: --

P: --

Canada New Housing Starts (Nov)

--

F: --

P: --

U.S. NY Fed Manufacturing Employment Index (Dec)

--

F: --

P: --

U.S. NY Fed Manufacturing Index (Dec)

--

F: --

P: --

Canada Core CPI YoY (Nov)

--

F: --

P: --

Canada Manufacturing Unfilled Orders MoM (Oct)

--

F: --

P: --

Canada Manufacturing New Orders MoM (Oct)

--

F: --

P: --

Canada Core CPI MoM (Nov)

--

F: --

P: --

Canada Manufacturing Inventory MoM (Oct)

--

F: --

P: --

Canada CPI YoY (Nov)

--

F: --

P: --

Canada CPI MoM (Nov)

--

F: --

P: --

Canada CPI YoY (SA) (Nov)

--

F: --

P: --

Canada Core CPI MoM (SA) (Nov)

--

F: --

P: --

Q&A with Experts
    • All
    • Chatrooms
    • Groups
    • Friends
    Connecting
    .
    .
    .
    Type here...
    Add Symbol or Code

      No matching data

      All
      Trump Updates
      Recommend
      Stocks
      Cryptocurrencies
      Central Banks
      Featured News
      • All
      • Russia-Ukraine Conflict
      • Middle East Flashpoint
      • All
      • Russia-Ukraine Conflict
      • Middle East Flashpoint
      Search
      Products

      Charts Free Forever

      Chats Q&A with Experts
      Screeners Economic Calendar Data Tools
      Membership Features
      Data Warehouse Market Trends Institutional Data Policy Rates Macro

      Market Trends

      Market Sentiment Order Book Forex Correlations

      Top Indicators

      Charts Free Forever
      Markets

      News

      News Analysis 24/7 Columns Education
      From Institutions From Analysts
      Topics Columnists

      Latest Views

      Latest Views

      Trending Topics

      Top Columnists

      Latest Update

      Signals

      Copy Rankings Latest Signals Become a signal provider AI Rating
      Contests
      Brokers

      Overview Brokers Assessment Rankings Regulators News Claims
      Broker listing Forex Brokers Comparison Tool Live Spread Comparison Scam
      Q&A Complaint Scam Alert Videos Tips to Detect Scam
      More

      Business
      Events
      Careers About Us Advertising Help Center

      White Label

      Data API

      Web Plug-ins

      Affiliate Program

      Awards Institution Evaluation IB Seminar Salon Event Exhibition
      Vietnam Thailand Singapore Dubai
      Fans Party Investment Sharing Session
      FastBull Summit BrokersView Expo
      Recent Searches
        Top Searches
          Markets
          News
          Analysis
          User
          24/7
          Economic Calendar
          Education
          Data
          • Names
          • Latest
          • Prev

          View All

          No data

          Scan to Download

          Faster Charts, Chat Faster!

          Download App
          English
          • English
          • Español
          • العربية
          • Bahasa Indonesia
          • Bahasa Melayu
          • Tiếng Việt
          • ภาษาไทย
          • Français
          • Italiano
          • Türkçe
          • Русский язык
          • 简中
          • 繁中
          Open Account
          Search
          Products
          Charts Free Forever
          Markets
          News
          Signals

          Copy Rankings Latest Signals Become a signal provider AI Rating
          Contests
          Brokers

          Overview Brokers Assessment Rankings Regulators News Claims
          Broker listing Forex Brokers Comparison Tool Live Spread Comparison Scam
          Q&A Complaint Scam Alert Videos Tips to Detect Scam
          More

          Business
          Events
          Careers About Us Advertising Help Center

          White Label

          Data API

          Web Plug-ins

          Affiliate Program

          Awards Institution Evaluation IB Seminar Salon Event Exhibition
          Vietnam Thailand Singapore Dubai
          Fans Party Investment Sharing Session
          FastBull Summit BrokersView Expo

          Commodities Weekly: Gold Retreats, Procyclicals Rise Amid Trade Truce Optimism

          Owen Li

          Economic

          Commodity

          Summary:

          Global financial markets responded very enthusiastically this past week to news that the US and China had agreed to a 90-day pause in their escalating trade war.

          Key points in this update:

          • Global financial markets responded very enthusiastically this past week to news that the US and China had agreed to a 90-day pause in their escalating trade war.
          • This de-escalation saw global equity markets and pro-cyclical commodities stage a comeback, while forcing an extended gold correction that eventually helped attract demand.
          • Elsewhere, the high-grade copper premium plunged; silver gained ground against gold, while platinum struggled for direction within a tightening range.
          • Crude's recent wild ride goes nowhere, with Brent and WTI both stuck in wide USD 10 ranges.

          Global financial markets responded very enthusiastically this past week to news that the US and China had agreed to a 90-day pause in their escalating trade war, for now reducing punitive tariffs that were beginning to hurt both economies, threatening a recession in the US and a slowdown in China’s export-driven economy. This de-escalation provided what may still turn out to be temporary relief to markets, with global equity markets and pro-cyclical commodities staging a comeback while haven demand for gold faded.

          The announcement of a 90-day truce in trade tensions prompted a swift and strong reaction from the global shipping industry. The Drewry Global Container Index—a key benchmark that tracks weekly freight rates for container shipping across major international routes showed a jump in the Shanghai–Los Angeles and Shanghai–New York lanes by 15.6% and 19.3%, respectively. The notable rebound on these routes reflects a renewed wave of frontloading activity, as exporters and importers in both China and the United States rush to ship goods ahead of any potential re-escalation of tariffs once the truce expires. Yet, the overall index remains down around 40% this year amid rising container capacity and tariff threats to global trade.

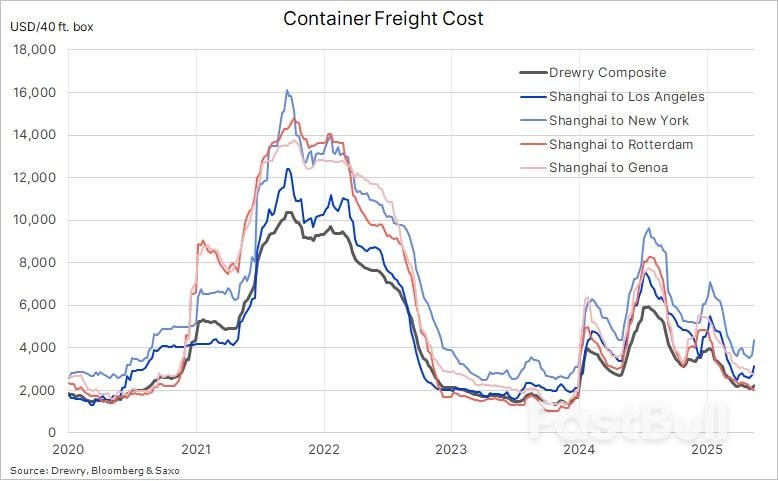
          Drewry Global Container Freight Indices

          The risk-on rally saw the tech-heavy Nasdaq reach February levels, reversing most of its tariff-related weakness, while USD bears were challenged and US Treasury yields, especially at the long end, rose to levels that raised a few eyebrows, not least considering an urgent need to bring down funding costs to service a growing fiscal deficit. Economic data in the US showed the first albeit small signs of what may come in the coming months as tariffs start to impact consumers. While prices paid to US producers unexpectedly declined by the most in five years, suggesting companies, for now, are absorbing some of the hit from higher tariffs. Separate data for April showed growth in retail sales decelerated while factory production declined for the first time in six months, and confidence fell for a third month.

          All signs indicate that the near-term economic outlook, not only in the US but also abroad—note Japan’s economy shrank for the first time in a year—remains challenged and vulnerable even before sustaining the full impact of Trump’s tariff measures. With this in mind, the prospect for additional dollar gains remains limited while the next rate cut from the US Federal Reserve is not a question of if but when they will cut next time; note the market is currently pricing in fully two 25-basis point cuts this year, followed by another two next year.

          Overall, the trade truce initially gave pro-cyclical commodities, such as energy and industrial metals a boost, before fading amid economic data weakness, leading the Bloomberg Commodity Index towards a weekly loss around 1.8%, lowering the year-to-date gain to 3.8%. Weighing on the index which tracks a basket of 24 major commodities futures spread almost evenly between energy, metals and agricultural, were a steep 9.6% loss in natural gas, and 5% drop in gold, two commodities that together with Arabica coffee (-6%) accounts for around 25% of the index. At the other end of the spectre, cocoa – a non-BCOM member - surged higher almost 19% and back above USD 11,000 tons amid renewed concerns about the quality and size of the current crop being harvested in West Africa.

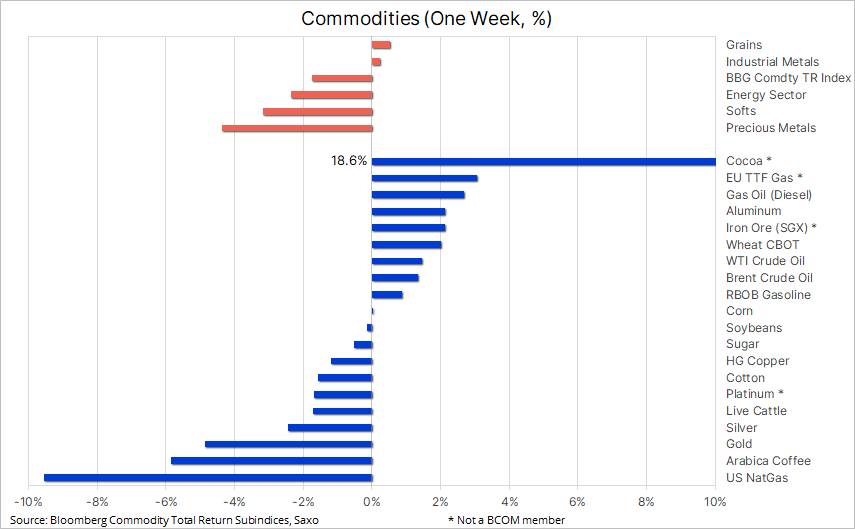
          Key commodities: one week performances

          Deep gold correction attracts demand, but market awaits fresh catalyst

          Gold has experienced its sharpest correction—both in absolute and percentage terms—since 2023, breaking through multiple technical support levels. The initial trigger was a fading of safe-haven demand following the US-China 90-day trade truce. However, prices have since found renewed support amid a weakening dollar and falling bond yields, driven by a batch of softer-than-expected U.S. economic data.

          Having already hit our 2025 price target of USD 3,500, we are currently adopting a wait-and-see approach. The market remains caught between profit-taking from those selling into strength and renewed interest from dip buyers. Despite the recent pullback, several key structural drivers—including central bank buying, geopolitical risks, fiscal debt concerns, and inflation hedging—remain intact. These are likely to underpin prices over the longer term, though a period of consolidation may be required before the next significant upside catalyst emerges.

          Investor flows will be critical to watch going forward, particularly in China, where demand from retail investors through yuan-denominated ETFs has been a key source of support before recently fading. In contrast, Western-based ETF holdings have seen net outflows since late April, contributing to the softer price environment. Meanwhile, speculative positioning in COMEX futures has turned increasingly bearish, with managed money and other reportables reducing their net long exposure by 42% over the past seven weeks. This highlights the need for a fresh technical breakout or macro catalyst to entice these key participants back to the buy side.

          Silver recovers against gold, platinum struggles for momentum in tightening range

          While gold fell sharply, silver and platinum also declined but were partially shielded by their industrial use cases. Optimism around U.S.-China trade relations has lent support to growth-sensitive commodities, tempering the downside in these two metals. The gold-silver ratio has since pulled back below 100, after spiking above 105 in early April.

          Platinum has underperformed both on a relative and absolute basis over the past decade. Once at parity with gold, it now trades at a ratio of 3.2:1, while its average price of USD 955 per oz over the past 17 years is just below current levels. This underperformance comes despite three consecutive years of structural deficits. According to Johnson Matthey, primary supply is expected to fall by 3% in 2025 to 5.54 million troy ounces, while demand is seen slipping 2.6% to 7.66 million ounces. Yet investment flows remain weak amid macroeconomic uncertainty, trade risks, and a softening outlook for the automotive sector, platinum’s largest demand driver.

          Platinum remains trapped in a narrowing technical range. A breakout could provide the spark for renewed speculative interest. Until then, COMEX-managed money accounts remain largely neutral. We are closely watching USD 1,010 as near-term resistance and USD 1,025 as the more significant downtrend level stemming from the 2008 highs.

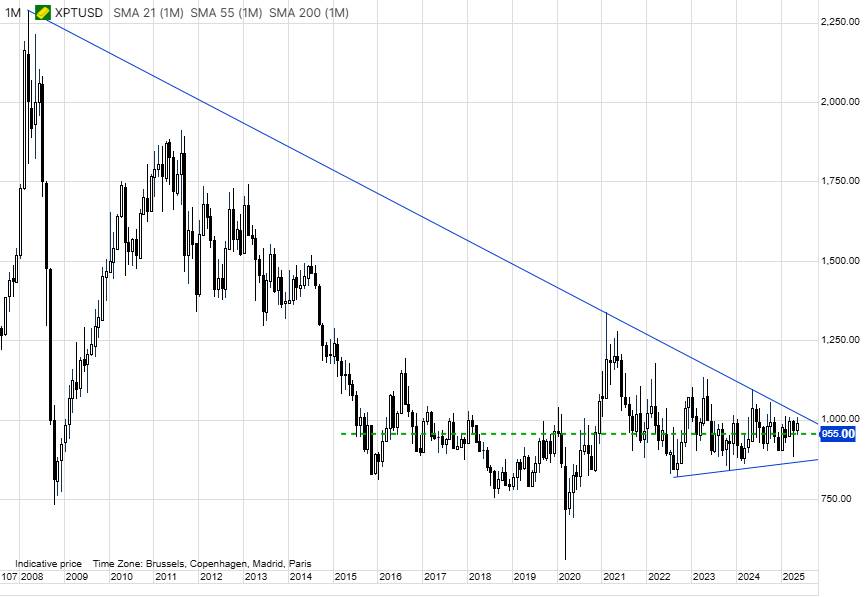
          Spot Platinum (XPTUSD) - Source: SaxoTraderGO

          High grade copper premiums plunge amid U.S. stockpile glut

          Benchmark copper prices in London were heading for a small weekly gain, extending a rebound from a 13-month low hit in April, as investors weigh tightening supply against a clouded economic outlook. The tightness has primarily been driven by a major transfer of copper to the US ahead of an expected tariff announcement, leaving the rest of the world, which accounts for more than 90% of global demand, with lower supplies.

          Since the US opened a probe into the copper market back in February, potentially leading to an implementation of tariffs on imports similar to the 25% tariff on all steel and aluminium imports that came into force this month, the spread between the High Grade contract on COMEX in New York and the global LME benchmark in London has seen a great deal of volatility, culminating at the end of March when the premium reached 16%.

          A level that helped trigger a massive, and ongoing surge in shipments of copper to the US, leading to a surge in copper stocks in COMEX-monitored warehouses to the highest since 2018, well above what is needed. As a result, and despite the risk of a 25% tariff being introduced, the premium over London has come down to around 7% on a combination of softer COMEX and firmer LME prices. Ample supply within the US has now created a glut that would delay the price impact of an eventual tariff introduction.

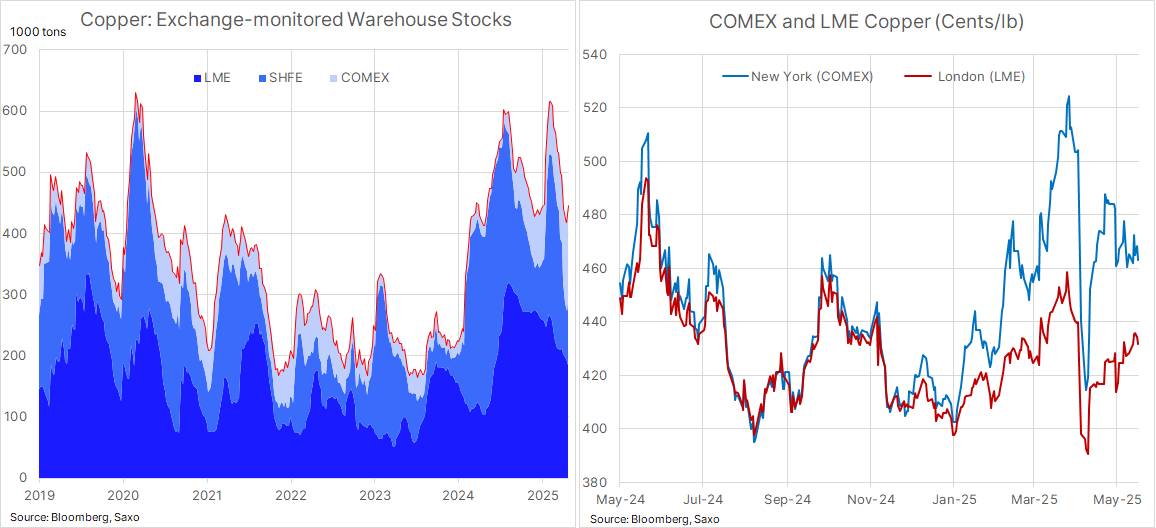
          Exchange monitored copper stocks and COMEX and LME prices

          Crude’s wild ride goes nowhere

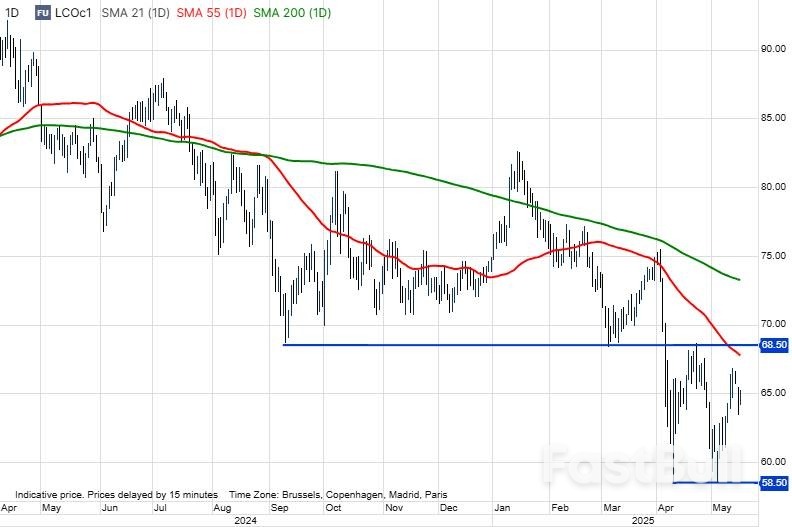
          Following the early April price collapse, both WTI and Brent—widely regarded as the two global benchmarks for crude oil—have settled into broad, yet volatile, $10-per-barrel trading ranges. WTI has fluctuated between $55 and $65, while Brent has moved between $58.5 and $68.5. Market sentiment continues to alternate between concerns over rising global supply and the potential economic fallout from ongoing global trade tensions.

          Over the past week, a fresh attempt to push prices higher—driven by renewed hopes from U.S.-China trade negotiations—was only partially successful. Gains were quickly reversed amid bearish supply-side developments. U.S. crude inventories posted another increase, and the Energy Information Administration (EIA) reported a 10% decline in the four-week average of U.S. crude oil exports. This drop brought export levels well below seasonal averages from the past two years and may indicate weakening demand among key buyers in Europe and Asia.

          Meanwhile, the International Energy Agency (IEA) has warned of a global oil glut both this year and next, citing a combination of robust supply growth and slower-than-expected demand expansion. The potential revival of the Iran nuclear deal could further aggravate this imbalance by bringing additional barrels to market. This would add to the already announced output increases from eight OPEC+ members, spearheaded by Saudi Arabia.

          In the short term, we expect oil prices to continue oscillating within their current ranges. Market participants remain focused on four key uncertainties: developments in global trade negotiations, lower prices’ potential negative impact on supply from high-cost producers, the extent of future production increases from OPEC+ members, and whether the group can rein in persistent quota violations. Recent compliance data suggests cumulative overproduction peaked at around 800,000 barrels per day, with Iraq, Kazakhstan, and the UAE identified as the primary offenders.

          Brent Crude Oil, first month future - Source: SaxoTraderGO

          Source: SAXO

          To stay updated on all economic events of today, please check out our Economic calendar
          Risk Warnings and Disclaimers
          You understand and acknowledge that there is a high degree of risk involved in trading. Following any strategies or investment methods may lead to potential losses. The content on the site is provided by our contributors and analysts for information purposes only. You are solely responsible for determining whether any trading assets, securities, strategy, or any other product is suitable for investing based on your own investment objectives and financial situation.
          Add to Favorites
          Share

          How Much Would A 100% 'Made In The USA' Vehicle Cost? It's Complicated

          Kevin Du

          Economic

          A white 2025 Ford Expedition SUV with bronze exterior trim rolls off the assembly line at Ford Motor's Kentucky Truck Plant. It was assembled — from its frame to completion — by American workers at the factory. But it's far from being completely "Made in the USA."

          A majority of its main parts — at least 58% as stated on a window sticker — were made outside of the country, including 22% from Mexico. That includes its Ford-engineered, 3.5-liter twin-turbocharged V-6 Ecoboost engine, the heart of the vehicle.

          The popular large SUV is a prime example of how complicated the global automotive supply chain is, and underscores the reality that even vehicles rolling off U.S. assembly lines from quintessentially American companies such as Ford can rely heavily on non-domestic content.

          The massive Kentucky assembly plant that has more than 9,000 people building the Expedition, F-Series pickup trucks and Lincoln Navigator SUV is exactly the kind of facility President Donald Trump is pressuring automakers to build in the U.S. through his use of aggressive tariffs.

          After Trump put 25% tariffs on imported vehicles and many automotive parts, automakers started scrambling to tout U.S. investments and localize supply chains as much as possible. But while the country would benefit from jobs and economic output if all auto parts were sourced and manufactured in the U.S., experts say it's just not feasible.

          "Some parts that have been offshored will still be cheaper to manufacture in those locations rather than the USA at scale even with some of the imposed tariffs," said Martin French, a longtime supplier executive and partner at Berylls Strategy Advisors USA.

          Processing and production plants for things such as steel, aluminum and semiconductor chips, especially older ones used for autos, as well as raw materials like platinum and palladium, aren't prevalent enough in the U.S. without establishing new plants or mines. Those are processes experts say would take a decade or more to create in scale.

          On top of that, the increased costs of a 100% U.S.-made vehicle could price many consumers out of the new vehicle market. That could in turn lead to less demand and likely lower production.

          "We can move everything to the U.S., but if every Ford is $50,000, we're not going to win as a company," Ford CEO Jim Farley said last week on CNBC's "Squawk Box." "That's a balancing act that every [automaker] will have to do, even the most American company."

          Farley said 15% to 20% of commoditized vehicle parts are difficult, if not impossible, to currently source in the U.S. That includes things such as small fasteners, labor-intensive wiring harnesses and almost $5,000 in semiconductors per vehicle, which are currently sourced largely from Asia.

          S&P Global Mobility reports there are on average 20,000 parts in a vehicle when it's torn down to its nuts and bolts. Parts may originate in anywhere from 50 to 120 countries.

          For example, the Ford F-150, which shares a platform and some parts with the Expedition, is exclusively assembled in the U.S. but has roughly 2,700 main billable parts, which exclude many small pieces, according to Caresoft, an engineering benchmarking and consulting firm.

          The Trump administration could ease higher prices for an American-made vehicle by offering tax breaks or consumer incentives, much like the up to $7,500 electric vehicle credit Trump previously promised to eliminate.

          But the costs of a 100% American-made vehicle are far greater and more complex than they might seem at first blush. It's even hard to track what comes from the U.S., as automakers are required to report a combined percentage of Canadian and U.S. content in a vehicle, not just U.S. content.

          The material costs alone, excluding manufacturing investments, would add thousands of dollars to a vehicle's price point, which would wipe out profits for automakers and force price increases for consumers, a handful of automotive analysts and executives told CNBC.

          The people, who were given anonymity to speak freely, estimated it would add thousands of dollars with each step you took to get closer to 100% U.S. and Canadian parts.

          100% U.S.-made vehicle

          Mark Wakefield, a partner and global automotive market lead at consulting firm AlixPartners, said nothing's necessarily impossible with time, but the investment needed for U.S. and Canadian sourcing and added costs would increase exponentially the closer a company came to a 100% "Made in the USA" vehicle.

          "The cost gets quantumly more the higher the closer you get to 100%," Wakefield said. "Getting above 90% gets expensive, and getting about 95% would get really expensive, and you just start getting into things that you'd have to a take a long time [to do]."

          To get that last 5% to 10%, if, or when, you could, Wakefield said, it would start "getting really expensive" and likely take a decade or more to set up raw material sourcing and reshore production of some parts.

          "I don't think you could do it more than about 95% on average, at any cost at the moment, just because you need to build a lot of stuff that's going to take a long time," he said. "The processing and the raw material stuff, it takes a really long time, because those are multibillion dollar facilities that process it."

          Two executives with auto suppliers told CNBC it would be "unrealistic," if not impossible, for a company to profitably build a 100% U.S.-made vehicle at this time. Another executive at an automaker estimated the average cost increase for an American-assembled U.S. full-size pickup would jump at least $7,000 to source as many components as currently possible from the U.S. and Canada.

          One expert, generalizing the costs, said it could cost $5,000 more to get a vehicle that's under 70% U.S./Canadian parts to 75% or 80%; another $5,000 to $10,000 to hit 90%; and thousands more to a higher percentage than that.

          Using that as a basis, the average transaction price of a new vehicle in the U.S. is currently around $48,000, according to Cox Automotive. Say that vehicle is made up of $30,000 in materials and parts. Adding the above costs would come out to roughly $10,000 to $20,000 more for companies.

          Cars.com reports the U.S. is by far the most expensive country to manufacture a vehicle in. The average new-car price of a U.S.-assembled vehicle is more than $53,200, according to its data. That compares with roughly $40,700 in Mexico, $46,148 in Canada and roughly $51,000 in China.

          Excluding raw materials, someone could theoretically start a new car company — let's call it U.S. Motors — from scratch. U.S. Motors could spend billions of dollars to build new factories and establish an exclusively American supply chain, but the vehicle it would produce would likely be low-volume and excessively expensive, experts say.

          Think of Ferrari: Every car from the iconic automaker comes from Italy, with as many components as possible sourced from the company's homeland.

          But even Ferrari's multimillion-dollar sports cars have parts or raw materials for things such as airbags, brakes, tires, batteries and more that come from non-Italian suppliers and facilities.

          "If you did it at really low volume and you're extremely innovative and different with the vehicle, you could make $300,000-$400,000 vehicles that are all-American," Wakefield said. "To do it at scale, it would be 10-15 [years] and $100 billion to do that."

          What's more realistic?

          Getting vehicles to 75% U.S. and Canadian parts and final assembly in the America is a far more achievable target that "doesn't really force you to do uneconomic things," Wakefield said, noting that a few vehicles meet that standard today.

          But even reaching that threshold on a larger scale would likely take billions of dollars in new investments from automakers and suppliers to localize production. Some automakers could make the move more easily, while others would require massive shifts in sourcing and production.

          Vehicles that meet the 75% U.S./Canada parts standard for the 2025 model year include the Kia EV6, two versions of the Tesla Model 3 and the Honda Ridgeline AWD Trail Sport, according to the latest vehicle content data required by the National Highway Traffic Safety Administration. Nearly 20 others are at 70% or higher, while some vehicles still need to be added to the data.

          That compares to 2007 model-year NHTSA data, where the top 16 vehicles — all from GM and Ford — had 90% or more U.S. and Canadian content. Ford's Expedition at that time was among the highest at 95%, but that was before the expanded globalization of the auto industry supply chain after the Great Recession — and before several major technological advances in cars made new parts and materials more important.

          For decades, there has been a trend for less U.S./Canadian content because of the globalization of supply chains and the increase in the use of Mexico as a source of parts and components, according to American University's Kogod School of Business.

          Imported vehicles from many luxury brands, specifically German manufacturers as well as Toyota's Lexus, feature little U.S.-sourced content. Many have none or 1%, according to the federal data.

          The U.S./Canada percentages, under the American Automobile Labeling Act of 1992, are calculated on a "carline" basis rather than for each individual vehicle and may be rounded to the nearest 5%. They are calculated by automakers and reported to the government.

          However, a high threshold of North American parts also doesn't mean the vehicles are produced in the U.S. The 2024 Toyota RAV4, for example, was reported to have 70% U.S./Canadian parts and is built in Canada.

          "You could have a vehicle, theoretically, that is made in the U.S., but only has 1% parts, content," said Patrick Masterson, a lead researcher for Cars.com's "American-Made Index."

          Cars.com's annual index of the top U.S. vehicles takes vehicle assembly, parts and other factors into account. No vehicles from Ford or General Motors made the top 10, while two Teslas, two Hondas and a Volkswagen took the top five spots.

          The study ranks 100 vehicles judged through the same five criteria it's used since the 2020 edition: assembly location, parts content, engine origin, transmission origin and U.S. manufacturing workforce. More than 400 vehicles of model-year 2024 vintage were analyzed to qualify the 100 vehicles on the list.

          The white 2025 Ford Expedition that recently rolled off the assembly line in Kentucky is expected to score higher than the prior model year, which ranked 78th, because of an increase in domestic content.

          Masterson said there's been increased interest and popularity for the "American-Made Index" this year amid Trump's tariff policies and nationalism.

          "Traffic on the 'American-Made Index' this year is way, way up. … People are concerned about this, perhaps more than ever," Masterson said, later adding "it would be extremely difficult to make a 100% U.S.-made [vehicle]."

          Source: CNBC

          To stay updated on all economic events of today, please check out our Economic calendar
          Risk Warnings and Disclaimers
          You understand and acknowledge that there is a high degree of risk involved in trading. Following any strategies or investment methods may lead to potential losses. The content on the site is provided by our contributors and analysts for information purposes only. You are solely responsible for determining whether any trading assets, securities, strategy, or any other product is suitable for investing based on your own investment objectives and financial situation.
          Add to Favorites
          Share

          ECB Member Kazaks Signals End To Interest Rate Cuts

          Jason

          Central Bank

          Kazaks signals ECB rate cuts concluding, impacting the Eurozone."Meeting-by-meeting approach" remains essential, Kazaks affirms.Trade tensions could still affect ECB's monetary policy.

          ECB Member Kazaks Signals End to Interest Rate Cuts

          Martins Kazaks, a European Central Bank Governing Council member, indicated on May 16, 2025, that the ECB is nearing the conclusion of its interest rate-cutting cycle, as he suggested during an interview with CNBC International.

          Kazaks' statement indicates a pivotal moment for ECB policy, as markets adjust to the potential end of rate cuts. The euro's relative strength signifies market adaptation.

          The ECB's interest rate cuts have been a significant component of its monetary policy over the past year. Kazaks emphasized a "meeting-by-meeting approach," signaling a strategy reliant on economic data. Trade tensions present a significant variable in future decisions.

          Market participants are currently pricing in expectations of a 25 basis point cut at the upcoming June 5 meeting, which I described as relatively reasonable. - Martins Kazaks, ECB Governing Council Member

          Kazaks noted that trade tensions might disrupt economic stability and potentially alter the ECB's approach. A potential trade war could affect monetary policy decisions, influencing growth and inflation rates within the Eurozone.

          Kazaks' remarks have led markets to anticipate a 25 basis point cut in the ECB's upcoming meeting. The EUR/USD trading around 1.1200 reflects this sentiment, illustrating the euro's solid position despite ongoing policy adjustments.

          The ECB's strategy aligns with its broader goals of crafting a cohesive European economic structure. Kazaks highlighted the importance of complete institutional architecture to strengthen the euro's global position and support the European economy's growth potential.

          Historical trends in monetary policy suggest that this stage typically signals a shift towards stability in interest rates. Kazaks' comments align with a gradual phasing out of interest rate cuts, aiming for a neutral rate neither boosting nor constraining economic growth.

          Kazaks' insights underscore the complexities facing the ECB, as it navigates these monetary policy changes. Future outcomes hinge on an interplay of regulatory, financial, and geopolitical factors. Historical analysis provides context to the ECB's evolving strategies.

          Source: CryptoSlate

          Risk Warnings and Disclaimers
          You understand and acknowledge that there is a high degree of risk involved in trading. Following any strategies or investment methods may lead to potential losses. The content on the site is provided by our contributors and analysts for information purposes only. You are solely responsible for determining whether any trading assets, securities, strategy, or any other product is suitable for investing based on your own investment objectives and financial situation.
          Add to Favorites
          Share

          The World Is Still Playing Catch-Up With The US

          Devin

          Economic

          The S&P 500 has “gone green” for the year to date. A few days ago, the US headline stock market index climbed to a point where it is now higher than it was at the start of January.

          It’s still below its (US dollar terms) all-time high set on 19th February. But it really doesn’t have to climb that much further to set a fresh record.

          That’s quite the turn-up for the books really, I think most of us would agree. I mean, what about all that tariff stuff? I know that US president Donald Trump has been rowing back a bit from the most extreme levels of tariffs, but the status quo has not returned by any manner of means.

          And what about the whole question of interest rates and what happens next with the bond market? Because, you know, if tariffs aren’t going to be the thing that fills the US deficit now, what will? And how will those promised tax cuts be paid for?

          You can see why people might be feeling a bit confused. And the truth is, I think it’s sensible to feel confused, or at least not to place too much conviction in any one view. Uncertainty is, of course, the nature of things, but there are times when conditions are supportive of higher levels of confidence in certain outcomes.

          This is most definitely not one of those times. Something that has stood out to me in recent weeks is that the traders and investors whose work I follow most closely — those on my “must read” list — are in “low conviction” mode. They’re taking stock, rather than piling in with big aggressive views on what’s going to happen next.

          The “End Of US Exceptionalism” Trade Is Still On

          So let’s take a step back ourselves, so as not to lose sight of our current thesis here — which is that “US exceptionalism” is over.

          US exceptionalism (in the markets sense at least) refers to the fact that US markets have outperformed “non-US” markets handsomely since just after the global financial crisis in 2008. You can tell a long story about why that’s happened but it’s irrelevant to this particular conversation.

          The recent period of outperformance was unusually long, and that has led to a certain sense among investors who’ve been trained by experience to “buy the dip,” that the US will never be a place to “underweight.”

          Yet US outperformance is not a natural law or an inevitability. There have been many periods during which the US has underperformed — the period between the tech bust and the lead-up to the financial crisis being just one of those. And it’s certainly my view that we’re returning to one of those periods now — where “the rest” beat the US for a while.

          Those who have watched the S&P 500 rocket back to its 2025 starting point might be thinking, “well, so much for that.” But there are a number of ways in which the gap between the US and the rest of the world can close.

          The obvious one is that US stocks go down and the rest go up. But the gap would also close if all stocks fall, but US ones fall faster — or, as the case is right now, US stocks go up, but others go up faster still.

          And so far, this is exactly what’s been happening. I’ll switch to using sterling as the measuring stick, because the majority of my readers pay their taxes in pounds.

          In sterling total return (ie including dividends) terms, since the start of the year, the S&P 500 is still down 6%. The FTSE 100 by contrast, is up 5.5%. That’s a punchy outperformance in anyone’s book. The MSCI World index excluding the US — which is an index of 22 developed markets — is up by 6%. And the MSCI Emerging Markets index is up 3%.

          In short, the gap is still closing. And so far I don’t see any reason to expect this theme to end soon. Clearly, I’ve been talking about the UK a lot here as an under-appreciated market to explore as a potential beneficiary of the US losing its “only place to own” status.

          But there are many other options to investigate too. As I’m writing this, Michael Hartnett of Bank of America (for my money, one of the best mainstream strategists out there), has put out a note arguing that “nothing will work better than emerging market stocks.”

          There’s a big wide world out there. Don’t get panicked into ignoring it by a sense of FOMO because the US has rebounded from its April lows.

          Send any feedback to jstepek2@bloomberg.net and I’ll print the best. Or ping any questions to merrynmoney@bloomberg.net.

          Looking at wider markets — the FTSE 100 is up 0.5% at around 8,670. The FTSE 250 is up 0.5% at 20,950. The 10-year gilt yield is sitting at 4.61%, lower on the day, as are yields on its German and French peers.

          Gold is down 2.5% at $3,160 an ounce, and oil (Brent crude) is up about 0.2% to $64.70 a barrel. Bitcoin is up 0.2% at $103,690 per coin, while Ethereum is up 3.3% at $2,620. The pound is down 0.1% against the US dollar at $1.328, and down 0.2% against the euro at €1.186.

          Follow UK Markets Today for up-to-the-minute news and analysis that move markets.

          Sign up for Bloomberg UK’s daily morning market newsletter, The London Rush. It’s all you need to get you up to date on the most important UK market-moving stories every morning. Get it delivered every day.

          The main stories to watch out for next week include:

          If you haven’t yet subscribed to the Merryn Talks Money podcast, I highly recommend you do so. Apple folk can subscribe here ; fellow Android users, you could go with Spotify , or just the podcast app of your choice.

          Source: Bloomberg Europe

          To stay updated on all economic events of today, please check out our Economic calendar
          Risk Warnings and Disclaimers
          You understand and acknowledge that there is a high degree of risk involved in trading. Following any strategies or investment methods may lead to potential losses. The content on the site is provided by our contributors and analysts for information purposes only. You are solely responsible for determining whether any trading assets, securities, strategy, or any other product is suitable for investing based on your own investment objectives and financial situation.
          Add to Favorites
          Share

          Is A Bitcoin Supercycle Imminent?

          Thomas

          Cryptocurrency

          Bitcoin is surging in 2025, igniting speculation about a historic Bitcoin supercycle. After a volatile start to the year, renewed momentum, recovering sentiment, and bullish metrics have analysts asking: Are we on the cusp of a 2017 Bitcoin bull run repeat? This Bitcoin price analysis explores cycle comparisons, investor behavior, and long-term holder trends to assess the likelihood of an explosive phase in this cryptocurrency market cycle.

          How the 2025 Bitcoin Cycle Compares to Past Bull Runs

          The latest Bitcoin price surge has reset expectations. According to the BTC Growth Since Cycle Low chart, Bitcoin’s trajectory aligns closely with the 2016–2017 and 2020–2021 cycles, despite macro challenges and drawdowns.

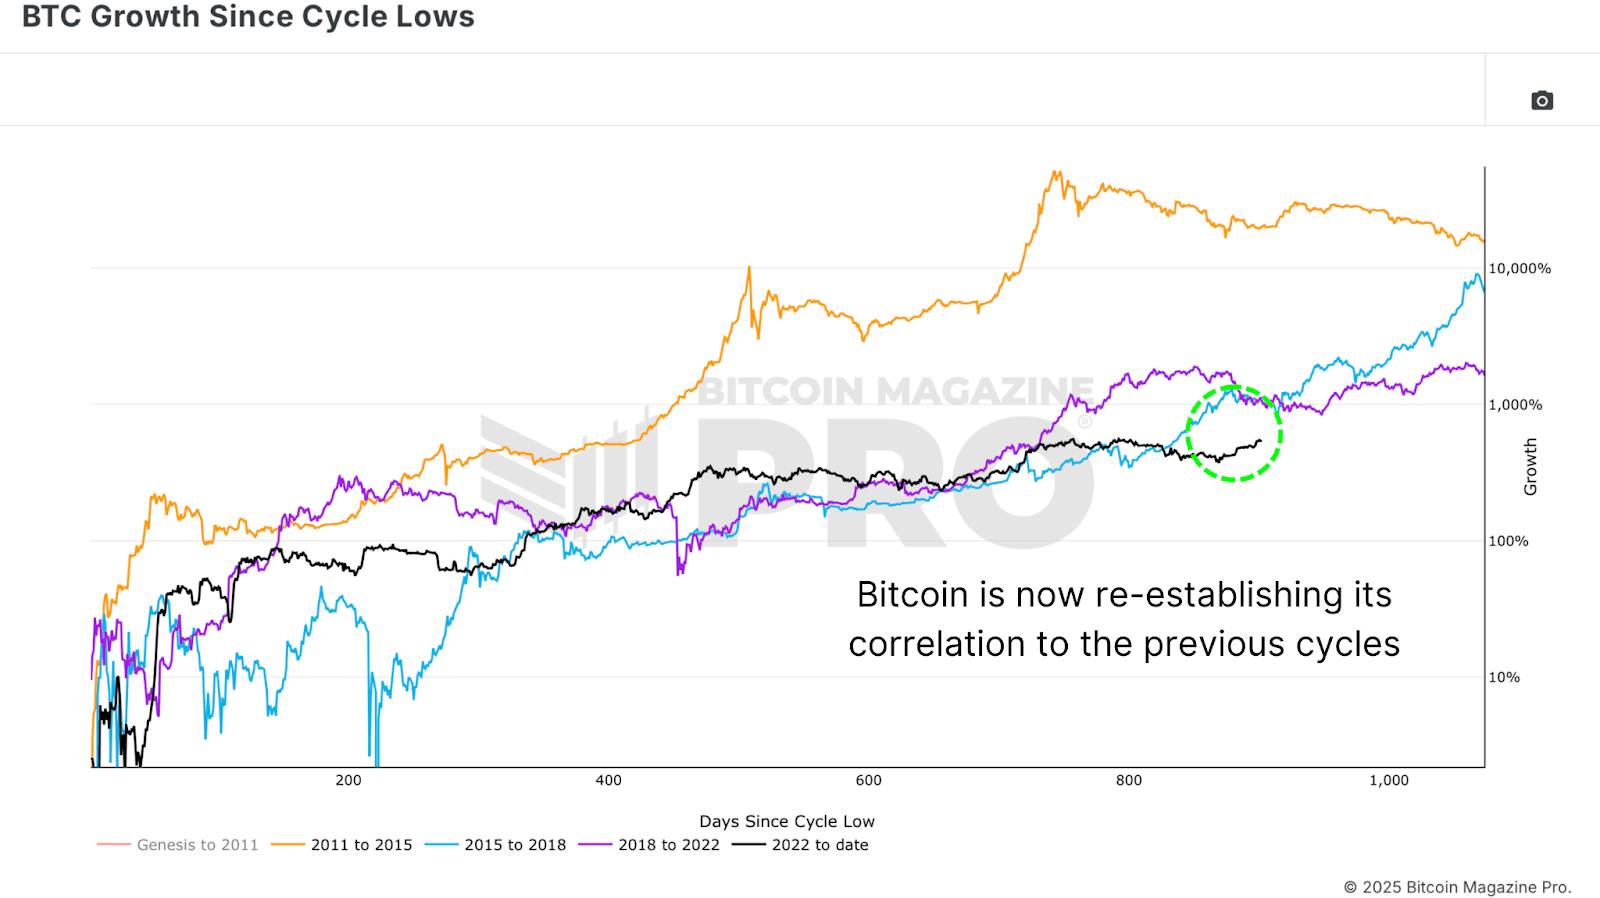
          Figure 1: Bitcoin’s 2025 bullish price action mirrors previous cycles.

          Historically, Bitcoin market cycles peak around 1,100 days from their lows. At approximately 900 days into the current cycle, there may be several hundred days left for potential explosive Bitcoin price growth. But do investor behaviors and market mechanics support a Bitcoin supercycle 2025?

          Bitcoin Investor Behavior: Echoes of the 2017 Bull Run

          To gauge cryptocurrency investor psychology, the 2-Year Rolling MVRV-Z Score provides critical insights. This advanced metric accounts for lost coins, illiquid supply, growing ETF and institutional holdings, and shifting long-term Bitcoin holder behaviors.

          Last year, when Bitcoin price hit ~$73,000, the MVRV-Z Score reached 3.39—a high but not unprecedented level. Retracements followed, mirroring mid-cycle consolidations seen in 2017. Notably, the 2017 cycle featured multiple high-score peaks before its final parabolic Bitcoin rally.

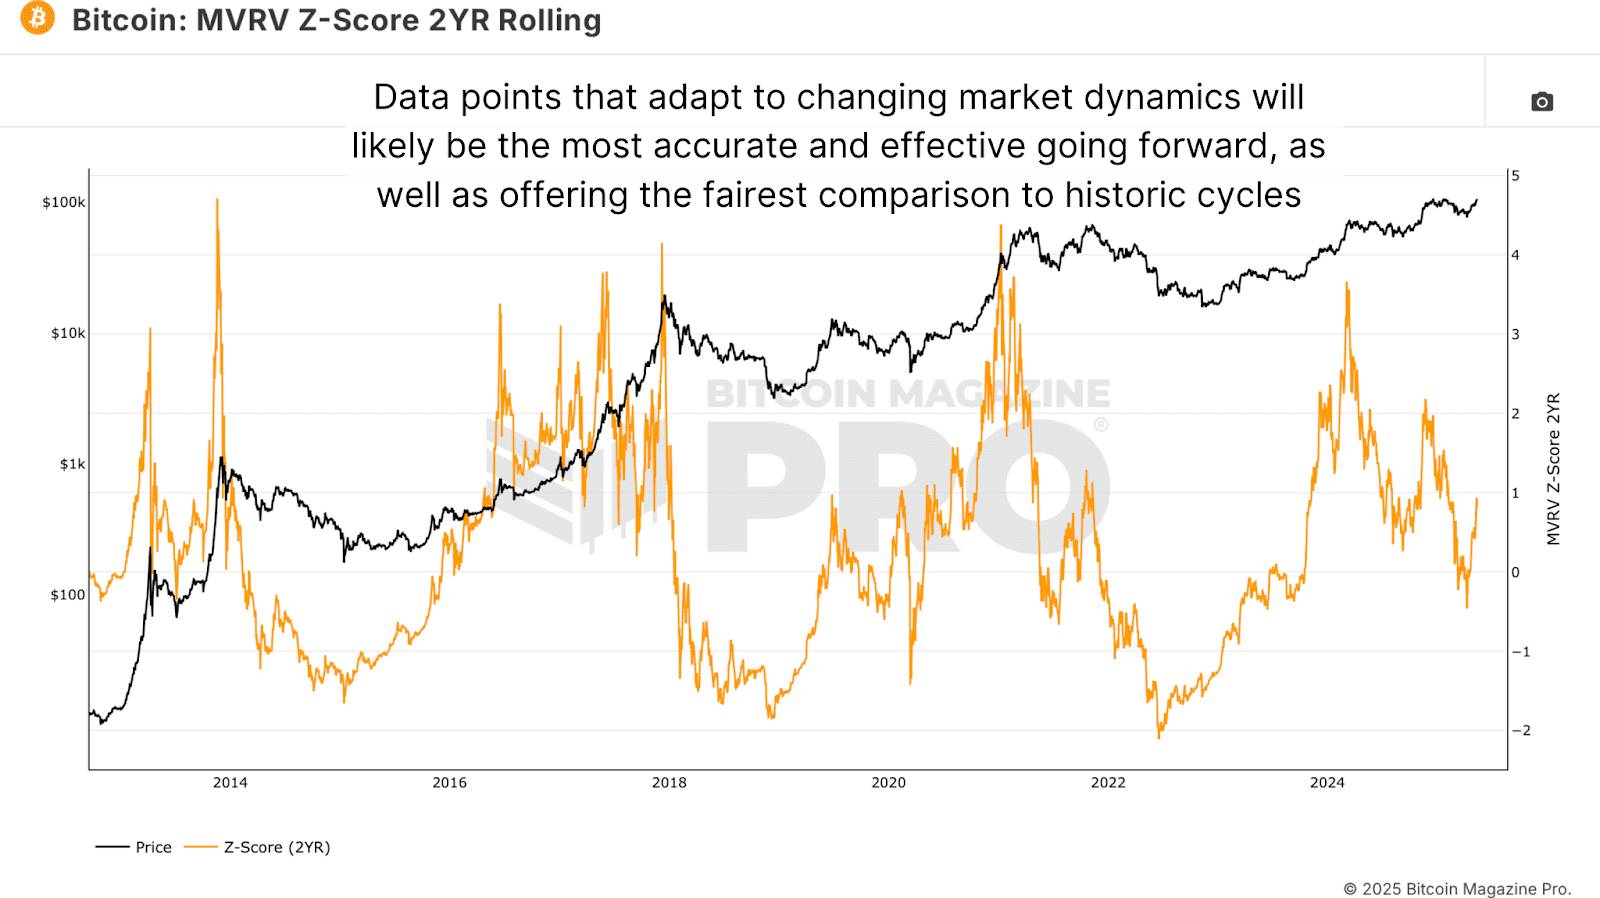
          Figure 2: MVRV-Z Score shows behavioral similarities to the 2017 Bitcoin bull run.

          Using the Bitcoin Magazine Pro API, a cross-cycle Bitcoin analysis reveals a striking 91.5% behavioral correlation with the 2013 double-peak cycle. With two major tops already—one pre-halving ($74k) and one post-halving ($100k+)—a third all-time high could mark Bitcoin’s first-ever triple-peak bull cycle, a potential hallmark of a Bitcoin supercycle.

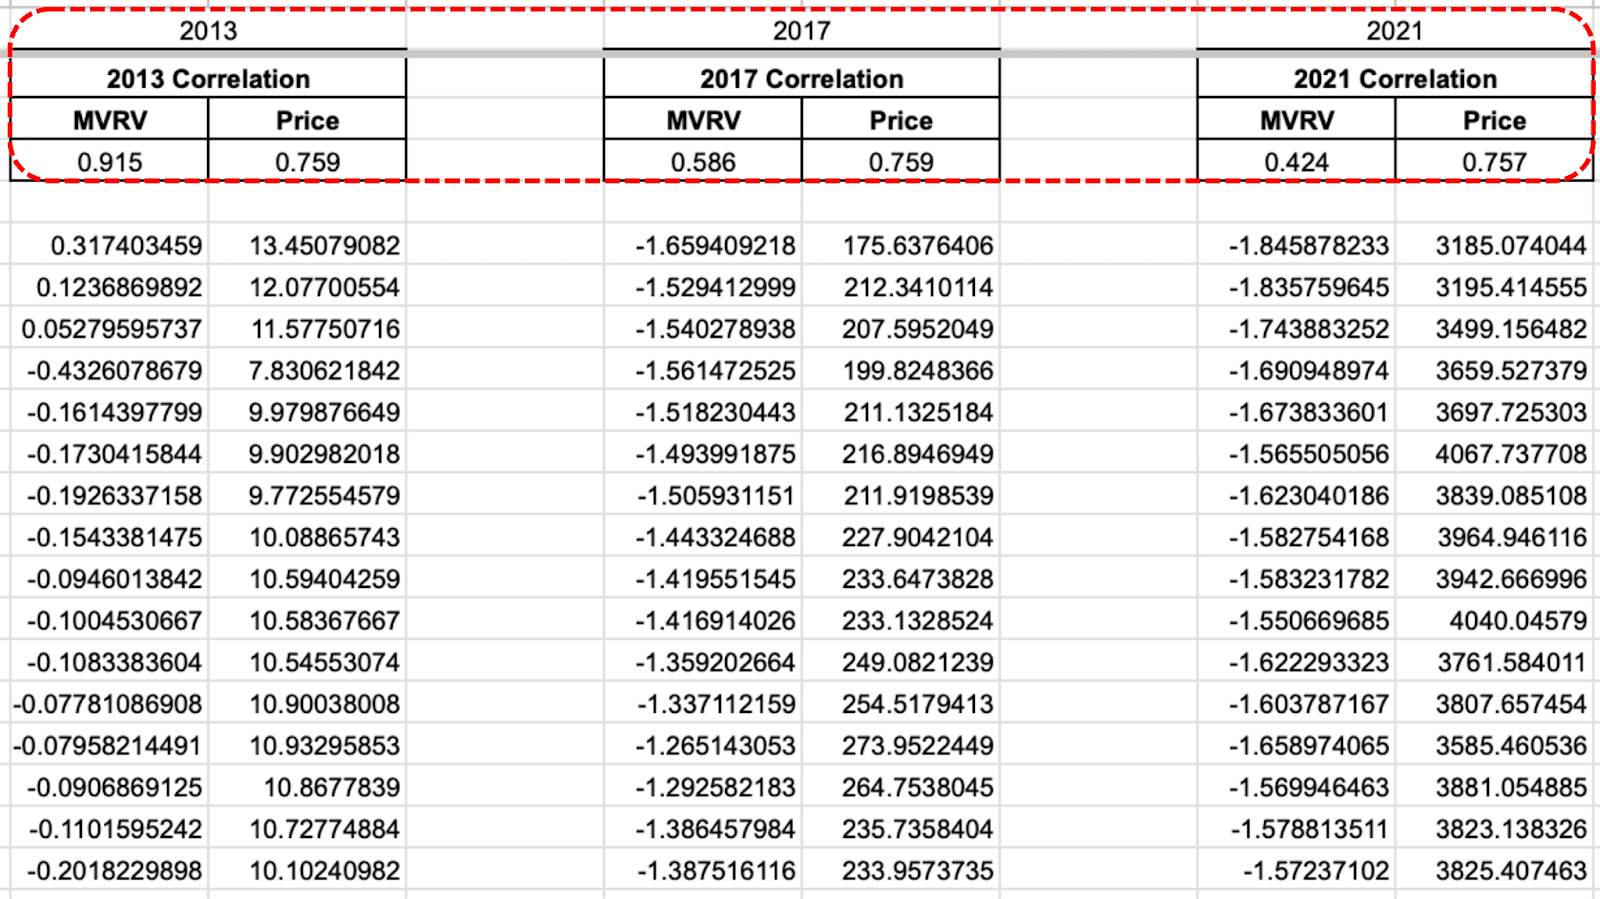
          Figure 3: Cross-cycle behavioral correlations using rolling MVRV-Z scores and price action.

          The 2017 cycle shows a 58.6% behavioral correlation, while 2021’s investor behavior is less similar, though its Bitcoin price action correlates at ~75%.

          Long-Term Bitcoin Holders Signal Strong Confidence

          The 1+ Year HODL Wave shows the percentage of BTC unmoved for a year or more continues to rise, even as prices climb—a rare trend in bull markets that reflects strong long-term holder conviction.

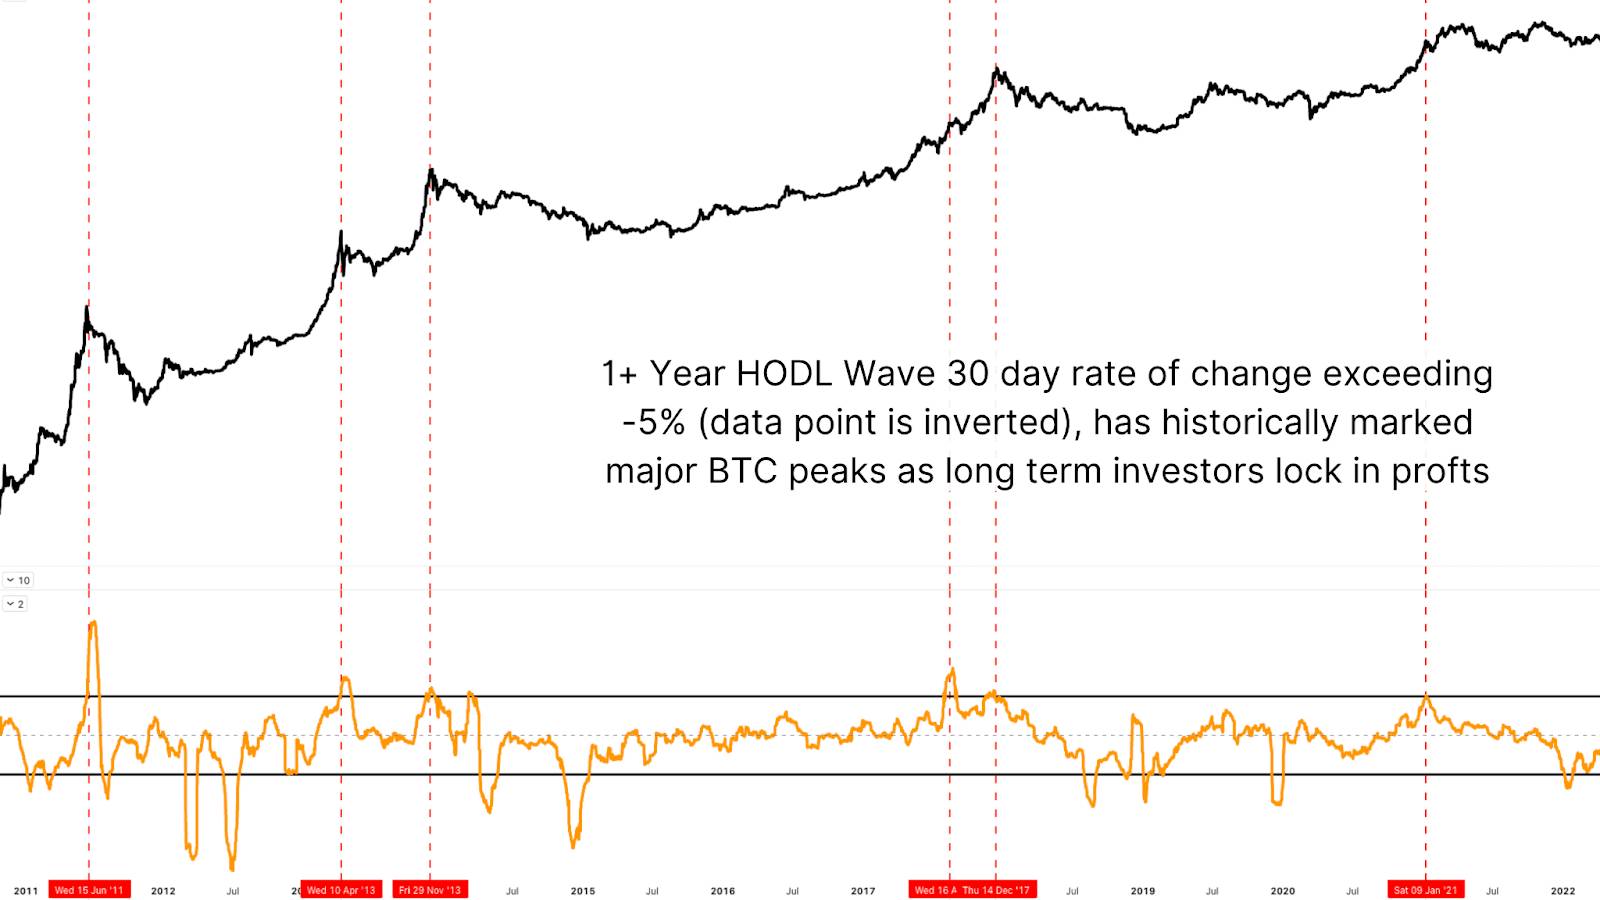
          Figure 4: The rate of change in the 1+ Year HODL Wave suggests confidence in future Bitcoin prices.

          Historically, sharp rises in the HODL wave’s rate of change signal major bottoms, while sharp declines mark tops. Currently, the metric is at a neutral inflection point, far from peak distribution, indicating long-term Bitcoin investors expect significantly higher prices.

          Bitcoin Supercycle or More Consolidation?

          Could Bitcoin replicate 2017’s euphoric parabolic rally? It’s possible, but this cycle may carve a unique path, blending historical patterns with modern cryptocurrency market dynamics.

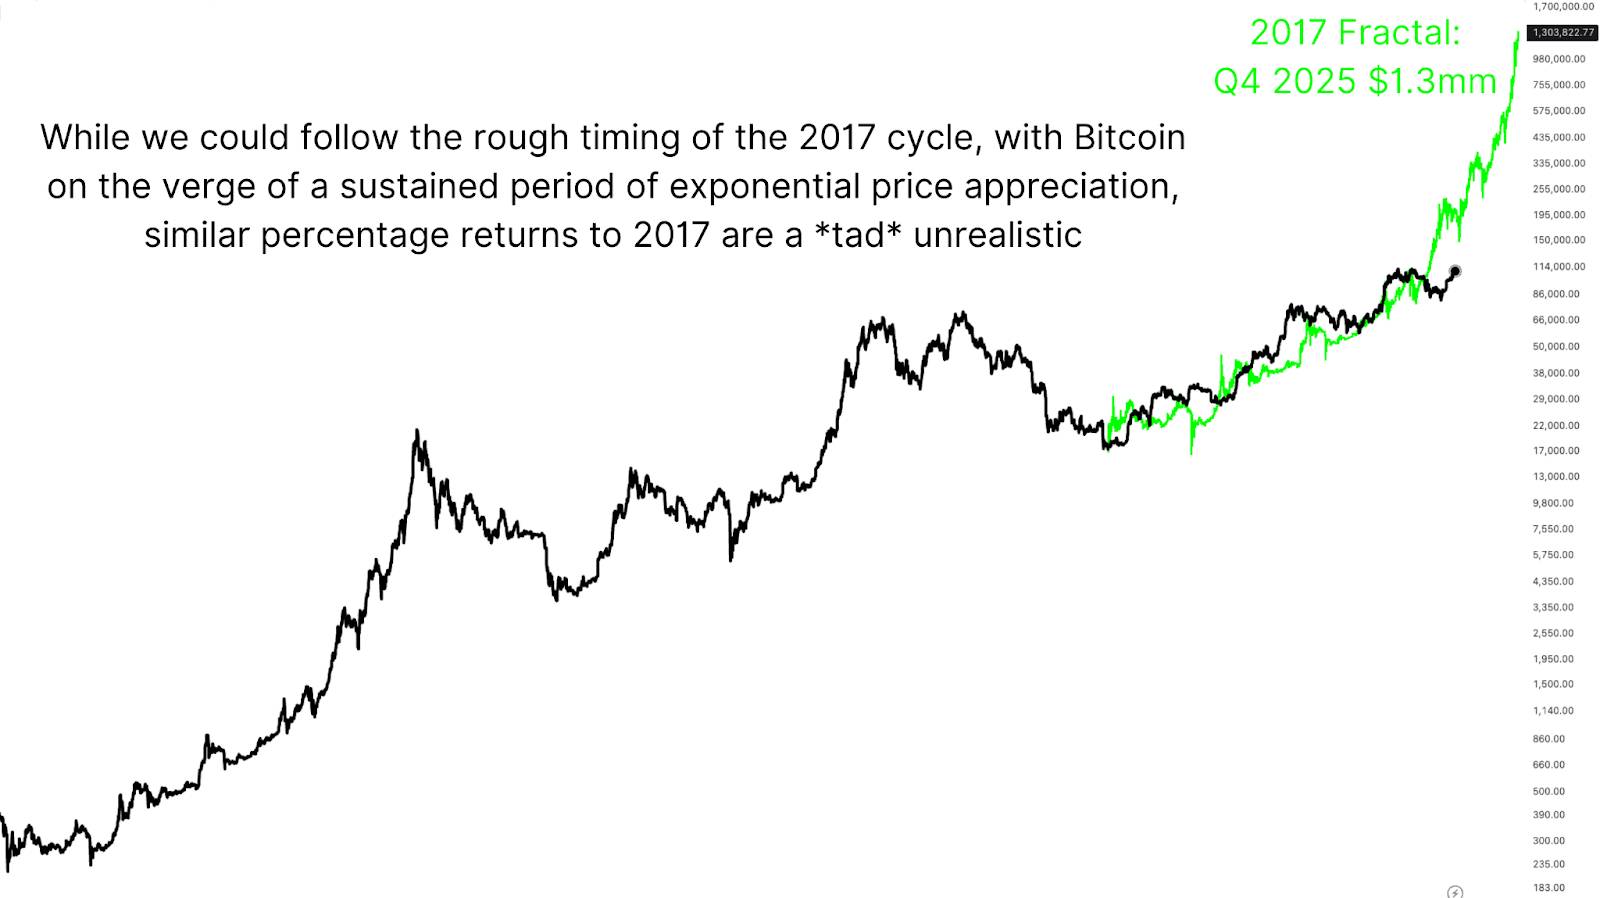
          Figure 5: A repeat of 2017’s exponential Bitcoin price growth may be ambitious.

          We may be approaching a third major peak within this cycle—a first in Bitcoin’s history. Whether this triggers a full Bitcoin supercycle melt-up remains uncertain, but key metrics suggest BTC is far from topping. Supply is tight, long-term holders remain steadfast, and demand is rising, driven by stablecoin growth, institutional Bitcoin investment, and ETF flows.

          Conclusion: Is a $150k Bitcoin Rally in Sight?

          Drawing direct parallels to 2017 or 2013 is tempting, but Bitcoin is no longer a fringe asset. As a maturing, institutionalized market, its behavior evolves, yet the potential for explosive Bitcoin growth persists.

          Historical Bitcoin cycle correlations remain high, investor behavior is healthy, and technical indicators signal room to run. With no major signs of capitulation, profit-taking, or macro exhaustion, the stage is set for sustained Bitcoin price expansion. Whether this delivers a $150k rally or beyond, the 2025 Bitcoin bull run could be one for the history books.

          Source: CoinGecko

          Risk Warnings and Disclaimers
          You understand and acknowledge that there is a high degree of risk involved in trading. Following any strategies or investment methods may lead to potential losses. The content on the site is provided by our contributors and analysts for information purposes only. You are solely responsible for determining whether any trading assets, securities, strategy, or any other product is suitable for investing based on your own investment objectives and financial situation.
          Add to Favorites
          Share

          Carbon Pricing Is Advancing Despite Trump

          Damon

          Economic

          Many fear that America’s withdrawal from the Paris climate agreement will undermine the international consensus to reduce greenhouse-gas emissions. Yet just in the last month, there have been two major steps toward widespread carbon pricing where it is needed most.

          To be sure, carbon pricing is not always the best policy, and not all sectors need to be subjected to schemes that require international consistency. If India electrifies its vehicle fleet more slowly than Europe, European industry suffers no competitive disadvantage. But the situation is different in long-distance shipping and aviation, and in heavy industries such as steel and chemicals, which account for around 25% of global emissions. Here, carbon pricing is key to cost-efficient decarbonization, and must be imposed on an internationally consistent basis.

          Fortunately, the technologies needed to achieve net-zero emissions by mid-century in each sector already exist. For example, methanol or ammonia can be used instead of fuel oil in ship engines, and hydrogen can replace coking coal in iron production. As matters stand, these technologies would impose a significant “green cost premium” at the intermediate product level, but with only a small impact on consumer prices. For example, even if shipping-freight rates doubled, the price of a pair of jeans made in Bangladesh and bought in London would rise less than 1%. If making zero-carbon steel costs 50% more per ton, that would add around 1% to the price of an automobile made from green steel.

          Carbon pricing is essential to overcome the green cost premium, and it could drive cost-efficient decarbonization at a trivial cost to consumers. But in each of these sectors, inherently international products (long-distance shipping) or the international trade in products (steel) make purely domestic approaches untenable. That is why the International Maritime Organization (IMO) agreed on April 11 to impose a carbon levy reaching $380 per metric ton on ship operators whose emissions intensity exceeds a defined threshold.

          The IMO agreement is not perfect. The organization aims to cut global shipping emissions by 20% by 2030, but the new pricing scheme would achieve only an 8% reduction. Still, concluding a new multilateral agreement despite a US boycott of the negotiations is a big step forward. China, India, and Brazil were among the 63 countries in favor.

          Carbon pricing could also drive decarbonization in heavy industry, but if it is imposed in only some countries, production and emissions will simply move to others. Though the ideal solution would be common carbon prices worldwide for these energy-intensive sectors, there is no international rule-making body like the IMO. The second-best solution, then, is for individual countries to impose domestic carbon prices combined with border carbon tariffs.

          The European Union is pursuing this approach. Not only will its emissions-trading scheme likely price carbon around $140 per metric ton by 2030; it is also removing the free allowances that heavy industry previously enjoyed and introducing a border carbon adjustment mechanism (CBAM) to subject imports to the same carbon pricing as domestic production. In principle, this creates strong incentives for decarbonization, while protecting domestic competitiveness.

          But the CBAM has been too weak, and heavy-industry decarbonization projects have been delayed. As a result, in March the European Commission committed to strengthening the regime in three respects: by ensuring a level playing field for exports as well as domestic sales; by widening the product coverage; and by improving the measurement of imports’ carbon intensity.

          The crucial question now is how developing countries will respond. In the past, several governments – in particular China and India – have criticized CBAMs as protectionist. But their arguments are unconvincing. Combining a domestic carbon price with a CBAM does not give domestic producers a competitive advantage. It simply maintains the competitive balance that existed before both were introduced. Moreover, it is the only way that developed countries can truly decarbonize their heavy industry, rather than hypocritically claiming to reduce emissions that have merely moved to other countries. The objective of the policy is not to raise tariff revenue, but to encourage other countries to impose carbon prices at home.

          These arguments are beginning to gain traction in developing countries. China’s own emissions-trading scheme has been extended to heavy-industry sectors, and prices are slowly increasing – though they still hover around $10-15 per metric ton. If carbon prices in China, India, and other developing countries gradually rose to European levels, and if CBAMs were imposed on those outside this low-carbon club, Chinese and Indian companies would also decarbonize. Even better, the impact on local consumer prices would be trivial, and governments would generate revenue.

          In this way, the EU’s approach could unleash a global wave of carbon pricing on heavy industry, matching the IMO’s progress in shipping. Ideally, policies would reflect internationally agreed standards for measuring the carbon intensity of production, and some of the revenues from CBAMs – and from the IMO’s carbon levies – would go toward supporting emissions reduction in lower-income countries. These ideas should be debated at COP30 in Brazil this November, regardless of whether an official US delegation attends.

          Source: Project Syndicate

          To stay updated on all economic events of today, please check out our Economic calendar
          Risk Warnings and Disclaimers
          You understand and acknowledge that there is a high degree of risk involved in trading. Following any strategies or investment methods may lead to potential losses. The content on the site is provided by our contributors and analysts for information purposes only. You are solely responsible for determining whether any trading assets, securities, strategy, or any other product is suitable for investing based on your own investment objectives and financial situation.
          Add to Favorites
          Share

          Wall Street Advances on Trade Hopes, Data Shows Investor Pessimism

          Manuel

          Stocks

          Economic

          Wall Street's main indexes rose on Friday for their fifth straight day, buoyed by the U.S.-China tariff truce earlier in the week even as economic survey data showed a deterioration in consumer sentiment.
          The S&P 500 steadily added to gains from late morning, while investors took weak data in their stride. The University of Michigan Surveys of Consumers said its Consumer Sentiment Index slumped further in May while one-year inflation expectations surged to 7.3% from 6.5% last month.
          All three main indexes boasted weekly gains after starting out with a steep rally on Monday - after Washington and Beijing agreed to a 90-day pause in their escalating trade war. This was days after the U.S. President and British Prime Minister announced a limited bilateral trade agreement.
          Lindsey Bell, chief market strategist at Clearnomics, New York, said Friday's advance was a "carry on from the de-escalation in the trade conflict."
          With a solid economy combined with pessimistic investors, Bell expects more volatility ahead as tariff headlines come out, and added that "data could change in coming months."
          "I don't think we're out of the woods yet. We're going to have to take it on a day-by-day, week-by-week basis," she said.
          Paul Christopher, head of global investment strategy at Wells Fargo Investment Institute, said the market is "cautiously optimistic" about the softening stance on trade, but waiting to see where the U.S. eventually lands on tariffs.
          "We haven't even begun to see what happens when those tariffs really bite, when firms have to raise their prices to consumers and consumers see fewer goods and less variety on the shelves," said Christopher.
          Investors were also left waiting for clarity on U.S. tax policy as Trump's sweeping tax bill failed to clear a key procedural hurdle as hardline Republicans demanding deeper spending cuts blocked the measure in a rare political setback for the Republican president in Congress.
          The Dow Jones Industrial Average (.DJI) rose 331.99 points, or 0.78%, to 42,654.74, the S&P 500 (.SPX) gained 41.45 points, or 0.70%, to 5,958.38 and the Nasdaq Composite (.IXIC) gained 98.78 points, or 0.52%, to 19,211.10. For the week, the S&P 500 gained about 5.3% while the Nasdaq rose 7.2% and the Dow added 3.4%.Wall Street Advances on Trade Hopes, Data Shows Investor Pessimism_1
          Among the S&P 500's 11 major industry indexes, most advanced with energy (.SPNY) the sole loser, down 0.18%.
          The biggest gainer was healthcare (.SPXHC), which ended up 1.96% for the day after a volatile week.
          One of its biggest index point boosts was from UnitedHealth Group Inc (UNH.N), which regained ground - rising 6.4% on Friday and leading S&P 500 percentage gains - after eight straight days of steep losses.
          Investors were warily expecting strategic changes at the insurer after the Wall Street Journal reported it was under a criminal probe by the Justice Department.
          Among other individual stocks, Applied Materials (AMAT.O) shares slipped 5.3% after the provider of equipment for chip manufacturing missed estimates for second-quarter revenue.
          Charter Communications (CHTR.O) shares rose 1.8% after the cable company said it would buy privately held rival Cox Communications for $21.9 billion.
          Shares in Verizon Communications (VZ.N) rose 1.7% after the Federal Communications Commission said Friday it was approving its $20 billion purchase of fiber-optic internet provider Frontier Communications (FYBR.O) after the largest U.S. telecom company agreed to end its diversity, equity and inclusion programs.
          Advancing issues outnumbered decliners by a 2.72-to-1 ratio on the NYSE where there were 207 new highs and 34 new lows.
          On the Nasdaq, 2792 stocks rose and 1,607 fell as advancing issues outnumbered decliners by a 1.74-to-1 ratio.
          The S&P 500 posted 28 new 52-week highs and no new lows while the Nasdaq Composite recorded 62 new highs and 73 new lows.
          On U.S. exchanges, 17.61 billion shares changed hands on Friday compared with the 17.04 billion average from the last 20 sessions.

          Source: Reuters

          To stay updated on all economic events of today, please check out our Economic calendar
          Risk Warnings and Disclaimers
          You understand and acknowledge that there is a high degree of risk involved in trading. Following any strategies or investment methods may lead to potential losses. The content on the site is provided by our contributors and analysts for information purposes only. You are solely responsible for determining whether any trading assets, securities, strategy, or any other product is suitable for investing based on your own investment objectives and financial situation.
          Add to Favorites
          Share
          FastBull
          Copyright © 2025 FastBull Ltd

          728 RM B 7/F GEE LOK IND BLDG NO 34 HUNG TO RD KWUN TONG KLN HONG KONG

          TelegramInstagramTwitterfacebooklinkedin
          App Store Google Play Google Play
          Products
          Charts

          Chats

          Q&A with Experts
          Screeners
          Economic Calendar
          Data
          Tools
          Membership
          Features
          Function
          Markets
          Copy Trading
          Latest Signals
          Contests
          News
          Analysis
          24/7
          Columns
          Education
          Company
          Careers
          About Us
          Contact Us
          Advertising
          Help Center
          Feedback
          User Agreement
          Privacy Policy
          Business

          White Label

          Data API

          Web Plug-ins

          Poster Maker

          Affiliate Program

          Risk Disclosure

          The risk of loss in trading financial instruments such as stocks, FX, commodities, futures, bonds, ETFs and crypto can be substantial. You may sustain a total loss of the funds that you deposit with your broker. Therefore, you should carefully consider whether such trading is suitable for you in light of your circumstances and financial resources.

          No decision to invest should be made without thoroughly conducting due diligence by yourself or consulting with your financial advisors. Our web content might not suit you since we don't know your financial conditions and investment needs. Our financial information might have latency or contain inaccuracy, so you should be fully responsible for any of your trading and investment decisions. The company will not be responsible for your capital loss.

          Without getting permission from the website, you are not allowed to copy the website's graphics, texts, or trademarks. Intellectual property rights in the content or data incorporated into this website belong to its providers and exchange merchants.

          Not Logged In

          Log in to access more features

          FastBull Membership

          Not yet

          Purchase

          Become a signal provider
          Help Center
          Customer Service
          Dark Mode
          Price Up/Down Colors

          Log In

          Sign Up

          Position
          Layout
          Fullscreen
          Default to Chart
          The chart page opens by default when you visit fastbull.com