- XAUUSD
- XAGUSD
- WTI
- USDX
Markets
Analysis
User
24/7
Economic Calendar
Education
Data
- Names
- Latest
- Prev


Signal Accounts for Members
All Signal Accounts
All Contests


Market News: The United States Has Added Some Individuals To Its Sanctions List Related To Sudan
U.S. Consumer Confidence In June Exceeded Initial Estimates, Boosted By A Decline In Gasoline Prices
The Final Reading Of U.S. Five- To Ten-year Inflation Expectations For June Was 3.3%, In Line With The Forecast Of 3.30% And Down From The Previous Reading Of 3.40%
The Final Reading Of U.S. One-year Inflation Expectations For June Was 4.6%, Matching The Forecast Of 4.60% And Unchanged From The Previous Reading Of 4.60%
According To Interfax News Agency, Sources Say No Decision Has Yet Been Made On Banning Russian Diesel Exports And Monitoring Will Continue
The Phone Call Between Mexican President Sheinbaum And Venezuelan Interim President Rodríguez Will Take Place At 12:00 P.m. Eastern Time (00:00 Beijing Time The Following Day)
Market News: Mexican President Sinbaum Will Hold Talks With Venezuelan Interim President Rodriguez
Barclays: (Regarding Oil) Due To The Lag In Supply Recovery, Inventories Are Expected To Continue To Decline For At Least The Next Few Weeks
Russian Presidential Press Secretary: The United States Is Not "absolutely Neutral" On The Russia-Ukraine Issue
Barclays: Lowered Its 2026 Brent Crude Oil Price Forecast To $96 Per Barrel And Its 2027 Forecast To $85 Per Barrel
According To The UAE's National News Agency, The UAE Foreign Minister Emphasized In A Telephone Conversation With The Iranian Foreign Minister That The Terms Of The US-Iran Agreement Must Be Fully Complied With
NHK (Japan Broadcasting Corporation) Reports That The Earthquake In Japan Did Not Pose A Tsunami Threat
According To The Financial Times, The EU Plans To Impose A 15% Tariff On Aluminum Scrap Exports
Citi/YOUGOV Survey: UK Long-term Inflation Expectations Are 3.9% In June, Down From 4.0% In May
Citi/YOUGOV Survey: UK One-year Inflation Expectations Are 3.8% In June, Down From 4.7% In May

U.S. Core PCE Price Index MoM (May)A:--
F: --
U.S. Durable Goods Orders MoM (May)A:--
F: --
U.S. PCE Price Index YoY (SA) (May)A:--
F: --
P: --
U.S. PCE Price Index MoM (May)A:--
F: --
P: --
U.S. Personal Income MoM (May)A:--
F: --
P: --
U.S. Real Personal Consumption Expenditures MoM (May)A:--
F: --
U.S. Initial Jobless Claims 4-Week Avg. (SA)A:--
F: --
U.S. Weekly Continued Jobless Claims (SA)A:--
F: --
U.S. Durable Goods Orders MoM (Excl.Transport) (May)A:--
F: --
U.S. Non-Defense Capital Durable Goods Orders MoM (Excl. Aircraft) (May)A:--
F: --
U.S. Chicago Fed National Activity Index (May)A:--
F: --
U.S. Durable Goods Orders MoM (Excl. Defense) (SA) (May)A:--
F: --
U.S. EIA Weekly Natural Gas Stocks ChangeA:--
F: --
P: --
U.S. Kansas Fed Manufacturing Composite Index (Jun)A:--
F: --
P: --
U.S. Kansas Fed Manufacturing Production Index (Jun)A:--
F: --
P: --
U.S. Dallas Fed PCE Price Index YoY (May)A:--
F: --
P: --
Mexico Policy Interest RateA:--
F: --
P: --
New York Federal Reserve President Williams delivered a speech.
U.S. Weekly Treasuries Held by Foreign Central BanksA:--
F: --
P: --
Japan Tokyo CPI MoM (Excl. Food & Energy) (Jun)A:--
F: --
P: --
Japan Tokyo CPI MoM (Jun)A:--
F: --
P: --
Japan Tokyo CPI YoY (Jun)A:--
F: --
P: --
Japan Tokyo Core CPI YoY (Jun)A:--
F: --
P: --
Italy 10-Year BTP Bond Auction Avg. YieldA:--
F: --
P: --
Italy 5-Year BTP Bond Auction Avg. YieldA:--
F: --
P: --
France Unemployment Class-A (May)A:--
F: --
P: --
India Deposit Gowth YoYA:--
F: --
P: --
Brazil Current Account (May)A:--
F: --
P: --
Brazil Unemployment Rate (May)A:--
F: --
P: --
Mexico Trade Balance (May)A:--
F: --
P: --
U.S. Wholesale Inventory MoM (SA) (May)A:--
F: --
U.S. Weekly Total Oil Rig Count--
F: --
P: --
U.S. Weekly Total Rig Count--
F: --
P: --
China, Mainland Industrial Profit YoY (YTD) (May)--
F: --
P: --
RBA Gov Bullock Speaks
Japan Retail Sales (May)--
F: --
P: --
Japan Retail Sales MoM (SA) (May)--
F: --
Japan Retail Sales YoY (May)--
F: --
Turkey Economic Sentiment Indicator (Jun)--
F: --
P: --
Euro Zone M3 Money Supply YoY (May)--
F: --
P: --
Euro Zone Private Sector Credit YoY (May)--
F: --
P: --
Euro Zone 3-Month M3 Money Supply YoY (May)--
F: --
P: --
U.K. Mortgage Approvals (May)--
F: --
P: --
U.K. Mortgage Lending (May)--
F: --
P: --
U.K. M4 Money Supply MoM (May)--
F: --
P: --
U.K. M4 Money Supply YoY (May)--
F: --
P: --
Euro Zone Selling Price Expectations (Jun)--
F: --
P: --
Euro Zone Consumer Inflation Expectations (Jun)--
F: --
P: --
Euro Zone Economic Sentiment Indicator (Jun)--
F: --
P: --
Euro Zone Industrial Climate Index (Jun)--
F: --
P: --
Euro Zone Services Sentiment Index (Jun)--
F: --
P: --
India Manufacturing Output MoM (May)--
F: --
P: --
India Industrial Production Index YoY (May)--
F: --
P: --
Canada National Economic Confidence Index--
F: --
P: --
U.S. Dallas Fed New Orders Index (Jun)--
F: --
P: --
U.S. Dallas Fed General Business Activity Index (Jun)--
F: --
P: --
South Korea Retail Sales MoM (May)--
F: --
P: --
South Korea Services Output MoM (May)--
F: --
P: --
South Korea Industrial Output MoM (SA) (May)--
F: --
P: --
U.K. BRC Shop Price Index YoY (Jun)--
F: --
P: --
Japan Jobs to Applicants Ratio (May)--
F: --
P: --


No matching data
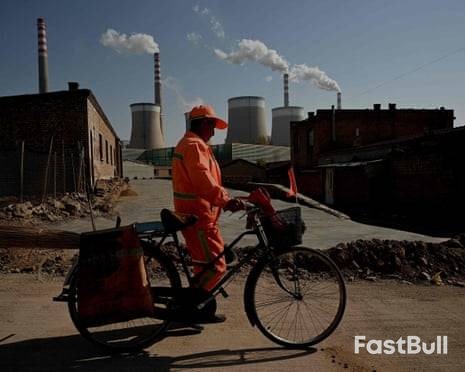
China and India's coal power simultaneously declined last year for the first time since the 1970s, driven by record clean energy growth, signaling a potential turning point for global emissions.
In a landmark development for global energy markets, coal-fired power generation in China and India fell simultaneously last year, an event not seen since the 1970s. According to new analysis, this historic shift was driven by a record-breaking expansion of clean energy, signaling a potential turning point for global carbon emissions.

Research from the Centre for Research on Energy and Clean Air, commissioned by Carbon Brief, reveals that electricity generated by coal plants dropped by 1.6% in China and 3% in India during the past year.
The simultaneous decline in the world's two largest coal-consuming nations is a significant milestone. The report describes the drop in coal power and the corresponding surge in clean energy as a "historic moment" that could be "a sign of things to come."
The global implications are substantial. Together, China and India accounted for over 90% of the increase in global carbon emissions between 2015 and 2024. A sustained reduction in their coal dependency could signal a peak in worldwide coal consumption and, consequently, global emissions.
The primary driver behind this downturn in coal use was the explosive growth in renewable energy capacity in both countries. The rollout of new clean energy projects was so extensive that it not only met rising electricity demand but also began to displace existing coal-fired generation.
China's Unprecedented Renewable Expansion
China led the charge with a massive build-out of renewable infrastructure. Last year, the country added over 300 gigawatts (GW) of solar power and 100 GW of wind power. To put this in perspective, this combined capacity is more than five times the total existing power generation capacity of the United Kingdom. The report notes these figures are "clear new records for China and, therefore, for any country ever."
India's Progress Aided by Multiple Factors
India also made significant strides, adding 35 GW of solar, 6 GW of wind, and 3.5 GW of hydropower. The analysis found that this growth in clean energy was responsible for 44% of the reduction in coal and gas power generation compared to the previous five years.
However, the reduction in India was also influenced by other factors. Milder weather contributed to 36% of the fossil fuel reduction, while slower growth in underlying energy demand accounted for another 20%. This suggests that a severe summer, which would increase demand for air-conditioning, could potentially reverse some of these gains.
This positive development comes after a period of uncertainty for global coal markets. Russia's war on Ukraine caused a spike in global gas prices, prompting many developing nations to turn to cheaper coal and delaying an anticipated peak in global coal power.
Just over a year ago, the International Energy Agency (IEA) projected that a rebound in coal use following the pandemic could keep consumption at near-record levels until 2027. The latest data from China and India presents a powerful counter-narrative, suggesting the global energy transition may be accelerating faster than previously expected.
The risk of loss in trading financial instruments such as stocks, FX, commodities, futures, bonds, ETFs and crypto can be substantial. You may sustain a total loss of the funds that you deposit with your broker. Therefore, you should carefully consider whether such trading is suitable for you in light of your circumstances and financial resources.
No decision to invest should be made without thoroughly conducting due diligence by yourself or consulting with your financial advisors. Our web content might not suit you since we don't know your financial conditions and investment needs. Our financial information might have latency or contain inaccuracy, so you should be fully responsible for any of your trading and investment decisions. The company will not be responsible for your capital loss.
Without getting permission from the website, you are not allowed to copy the website's graphics, texts, or trademarks. Intellectual property rights in the content or data incorporated into this website belong to its providers and exchange merchants.
Not Logged In
Log in to access more features
Log In
Sign Up