• Trade
  • Markets
  • Copy
  • Contests
  • News
  • 24/7
  • Calendar
  • Q&A
  • Chats
Screeners
SYMBOL
LAST
ASK
BID
HIGH
LOW
NET CHG.
%CHG.
SPREAD
SPX
S&P 500 Index
6950.22
6950.22
6950.22
6964.65
6921.61
+34.61
+ 0.50%
--
DJI
Dow Jones Industrial Average
49412.39
49412.39
49412.39
49488.81
49137.65
+313.69
+ 0.64%
--
IXIC
NASDAQ Composite Index
23601.35
23601.35
23601.35
23688.94
23486.08
+100.11
+ 0.43%
--
USDX
US Dollar Index
97.020
97.100
97.020
97.060
96.710
+0.190
+ 0.20%
--
EURUSD
Euro / US Dollar
1.18558
1.18566
1.18558
1.18991
1.18502
-0.00235
-0.20%
--
GBPUSD
Pound Sterling / US Dollar
1.36691
1.36700
1.36691
1.37003
1.36636
-0.00089
-0.07%
--
XAUUSD
Gold / US Dollar
5083.26
5083.67
5083.26
5100.65
5013.05
+72.99
+ 1.46%
--
WTI
Light Sweet Crude Oil
60.192
60.222
60.192
60.755
60.054
-0.556
-0.92%
--

Community Accounts

Signal Accounts
--
Profit Accounts
--
Loss Accounts
--
View More

Become a signal provider

Sell trading signals to earn additional income

View More

Guide to Copy Trading

Get started with ease and confidence

View More

Signal Accounts for Members

All Signal Accounts

Best Return
  • Best Return
  • Best P/L
  • Best MDD
Past 1W
  • Past 1W
  • Past 1M
  • Past 1Y

All Contests

  • All
  • Trump Updates
  • Recommend
  • Stocks
  • Cryptocurrencies
  • Central Banks
  • Featured News
Top News Only
Share

Deutsche Bank: "We Think $6000/Oz Is Achievable With A Weaker Dollar This Year"

Share

South Korea: USA Letter Not Directly Related To Trump's Announcement On Tariffs

Share

Statement: Zambia's 2025 Copper Production At 890346 Metric Tons

Share

Indian Refiners Say Offers Of Venezuelan Oil Limited, Most Going To US

Share

South Korea's Blue House: Have Received Letter From USA Asking Not To Discriminate Against USA Companies On Digital Matters

Share

Russia's Central Bank: Inflationary Expectations Among Households At 13.7% In January Versus 13.7% In December

Share

European Commission President Ursula Von Der Leyen: In A Context Of Trade Being "weaponized," The EU-India Free Trade Agreement Will Help Reduce Its Strategic Dependence

Share

Gail Cmd: More Natural Gas Availability Is Expected, Will Help India

Share

Hong Kong December Exports +26.1 Percent From A Year Earlier

Share

Hong Kong December Imports +30.6 Percent From A Year Earlier

Share

Romanian Broad Money (M3) At End-December At 795408 Million Lei, Up 7.2% Year-On-Year

Share

Russian Human Rights Commissioner: Russia And Ukraine Are Currently In Active Dialogue Regarding The Number Of Prisoners To Be Exchanged And Other Details

Share

Ukraine Grain Exports As Of January 26

Share

Indian Prime Minister Modi: We Need To Reform Global Institutions

Share

Indian Prime Minister Modi: Both India And The EU Believe In Multilateralism

Share

Indian Prime Minister Modi: Today We Discussed The Situation In Ukraine, West Asia, And The Indo-Pacific Region

Share

Spain's Quarterly Unemployment Rate Dips Below 10% For First Time In 18 Years

Share

India - EU: Costa Says Taking Partnership To Next Level

Share

India - EU: Modi Says Cooperation To Strengthen Global Order

Share

India - EU: Modi Says Defence Pact To Push Co-Development And Co-Production

TIME
ACT
FCST
PREV
U.S. IHS Markit Manufacturing PMI Prelim (SA) (Jan)

A:--

F: --

P: --

U.S. IHS Markit Services PMI Prelim (SA) (Jan)

A:--

F: --

P: --

U.S. IHS Markit Composite PMI Prelim (SA) (Jan)

A:--

F: --

P: --

U.S. UMich Consumer Sentiment Index Final (Jan)

A:--

F: --

P: --

U.S. UMich Current Economic Conditions Index Final (Jan)

A:--

F: --

P: --

U.S. UMich Consumer Expectations Index Final (Jan)

A:--

F: --

P: --

U.S. Conference Board Leading Economic Index MoM (Nov)

A:--

F: --

P: --

U.S. Conference Board Coincident Economic Index MoM (Nov)

A:--

F: --

P: --

U.S. Conference Board Lagging Economic Index MoM (Nov)

A:--

F: --

P: --

U.S. UMich 1-Year-Ahead Inflation Expectations Final (Jan)

A:--

F: --

P: --

U.S. Conference Board Leading Economic Index (Nov)

A:--

F: --

P: --

U.S. Weekly Total Rig Count

A:--

F: --

P: --

U.S. Weekly Total Oil Rig Count

A:--

F: --

P: --

Japanese Prime Minister Sanae Takaichi delivers a speech
Germany Ifo Business Expectations Index (SA) (Jan)

A:--

F: --

P: --

Germany IFO Business Climate Index (SA) (Jan)

A:--

F: --

P: --

Germany Ifo Current Business Situation Index (SA) (Jan)

A:--

F: --

P: --

Brazil Current Account (Dec)

A:--

F: --

P: --

Mexico Unemployment Rate (Not SA) (Dec)

A:--

F: --

P: --

Canada National Economic Confidence Index

A:--

F: --

P: --

U.S. Non-Defense Capital Durable Goods Orders MoM (Excl. Aircraft) (Nov)

A:--

F: --

P: --
U.S. Durable Goods Orders MoM (Excl. Defense) (SA) (Nov)

A:--

F: --

P: --
U.S. Durable Goods Orders MoM (Excl.Transport) (Nov)

A:--

F: --

P: --

U.S. Durable Goods Orders MoM (Nov)

A:--

F: --

P: --
U.S. Chicago Fed National Activity Index (Nov)

A:--

F: --

P: --
U.S. Dallas Fed New Orders Index (Jan)

A:--

F: --

P: --

U.S. Dallas Fed General Business Activity Index (Jan)

A:--

F: --

P: --
U.S. 2-Year Note Auction Avg. Yield

A:--

F: --

P: --

U.K. BRC Shop Price Index YoY (Jan)

A:--

F: --

P: --

China, Mainland Industrial Profit YoY (YTD) (Dec)

A:--

F: --

P: --

Germany 2-Year Schatz Auction Avg. Yield

--

F: --

P: --

Mexico Trade Balance (Dec)

--

F: --

P: --

U.S. Weekly Redbook Index YoY

--

F: --

P: --

U.S. S&P/CS 20-City Home Price Index YoY (Not SA) (Nov)

--

F: --

P: --

U.S. S&P/CS 20-City Home Price Index MoM (SA) (Nov)

--

F: --

P: --

U.S. FHFA House Price Index MoM (Nov)

--

F: --

P: --

U.S. FHFA House Price Index (Nov)

--

F: --

P: --

U.S. FHFA House Price Index YoY (Nov)

--

F: --

P: --

U.S. S&P/CS 10-City Home Price Index YoY (Nov)

--

F: --

P: --

U.S. S&P/CS 10-City Home Price Index MoM (Not SA) (Nov)

--

F: --

P: --

U.S. S&P/CS 20-City Home Price Index (Not SA) (Nov)

--

F: --

P: --

U.S. S&P/CS 20-City Home Price Index MoM (Not SA) (Nov)

--

F: --

P: --

U.S. Richmond Fed Manufacturing Composite Index (Jan)

--

F: --

P: --

U.S. Conference Board Present Situation Index (Jan)

--

F: --

P: --

U.S. Conference Board Consumer Expectations Index (Jan)

--

F: --

P: --

U.S. Richmond Fed Manufacturing Shipments Index (Jan)

--

F: --

P: --

U.S. Richmond Fed Services Revenue Index (Jan)

--

F: --

P: --

U.S. Conference Board Consumer Confidence Index (Jan)

--

F: --

P: --

U.S. 5-Year Note Auction Avg. Yield

--

F: --

P: --

U.S. API Weekly Refined Oil Stocks

--

F: --

P: --

U.S. API Weekly Crude Oil Stocks

--

F: --

P: --

U.S. API Weekly Gasoline Stocks

--

F: --

P: --

U.S. API Weekly Cushing Crude Oil Stocks

--

F: --

P: --

Australia RBA Trimmed Mean CPI YoY (Q4)

--

F: --

P: --

Australia CPI YoY (Q4)

--

F: --

P: --

Australia CPI QoQ (Q4)

--

F: --

P: --

Germany GfK Consumer Confidence Index (SA) (Feb)

--

F: --

P: --

Germany 10-Year Bund Auction Avg. Yield

--

F: --

P: --

India Industrial Production Index YoY (Dec)

--

F: --

P: --

India Manufacturing Output MoM (Dec)

--

F: --

P: --

Q&A with Experts
    • All
    • Chatrooms
    • Groups
    • Friends
    SlowBear ⛅ flag
    3444482
    Where can we watch FOMC live?
    @3444482You can watch on CNBC on Youtube or just tune in on Bloomberg on Youtube or yout cable
    john flag
    3444482
    Where can we watch FOMC live?
    @Visitor3444482FastBull 24/7 but this will happen tomorrow
    SlowBear ⛅ flag
    @Sarkar
    @@SarkarNot bad bro, 5055 target from the short sell it might playout real fast if the current sell off is actual
    Mohamed Ja flag
    Brothers, can you analyze NZD?
    @Sarkar flag
    SlowBear ⛅
    @SlowBear ⛅GOOD 👍
    marsgents flag
    john
    @johni see it can go to 100 or 94 zone,from where it drop is mystery
    john flag
    marsgents
    @marsgentsso what is your current move on gold at the moment
    rawa ronte flag
    hello.. hello
    john flag
    marsgents
    @marsgentsdo you have active trade at the moment
    marsgents flag
    john
    @johnnow none,managing my long from below,already long 2 short 1 on early asia
    @Sarkar flag
    SlowBear ⛅
    @SlowBear ⛅I think
    Mohamed Ja flag
    What are the nzduss predictions?
    marsgents flag
    john
    @johnim watching 4985 or below,or atleast asia low before going long
    SlowBear ⛅ flag
    @Sarkar
    @@Sarkar So do you trade another instrument or you only trade Gold?
    SlowBear ⛅ flag
    rawa ronte
    hello.. hello
    @rawa ronteHi mate how are you doing today?
    marsgents flag
    john
    @john4 long on gold collecting long from last 2 friday
    3444482 flag
    What factors are currently affecting gold? If not, I'll be scalping and making money during the fluctuations.
    SlowBear ⛅ flag
    @Sarkar
    @@SarkarWell the clarity will come soon enough so lets just wait for it
    @Sarkar flag
    SlowBear ⛅
    I think the gold market is going to go down a lot in ten minutes.@SlowBear ⛅
    SlowBear ⛅ flag
    @Sarkar
    @@Sarkar wow in just 10min Gold will go down a lot? that is something i would love to see happen though
    Type here...
    Add Symbol or Code

      No matching data

      All
      Trump Updates
      Recommend
      Stocks
      Cryptocurrencies
      Central Banks
      Featured News
      • All
      • Russia-Ukraine Conflict
      • Middle East Flashpoint
      • All
      • Russia-Ukraine Conflict
      • Middle East Flashpoint
      Search
      Products

      Charts Free Forever

      Chats Q&A with Experts
      Screeners Economic Calendar Data Tools
      Membership Features
      Data Warehouse Market Trends Institutional Data Policy Rates Macro

      Market Trends

      Market Sentiment Order Book Forex Correlations

      Top Indicators

      Charts Free Forever
      Markets

      News

      News Analysis 24/7 Columns Education
      From Institutions From Analysts
      Topics Columnists

      Latest Views

      Latest Views

      Trending Topics

      Top Columnists

      Latest Update

      Signals

      Copy Rankings Latest Signals Become a signal provider AI Rating
      Contests
      Brokers

      Overview Brokers Assessment Rankings Regulators News Claims
      Broker listing Forex Brokers Comparison Tool Live Spread Comparison Scam
      Q&A Complaint Scam Alert Videos Tips to Detect Scam
      More

      Business
      Events
      Careers About Us Advertising Help Center

      White Label

      Data API

      Web Plug-ins

      Affiliate Program

      Awards Institution Evaluation IB Seminar Salon Event Exhibition
      Vietnam Thailand Singapore Dubai
      Fans Party Investment Sharing Session
      FastBull Summit BrokersView Expo
      Recent Searches
        Top Searches
          Markets
          News
          Analysis
          User
          24/7
          Economic Calendar
          Education
          Data
          • Names
          • Latest
          • Prev

          View All

          No data

          Scan to Download

          Faster Charts, Chat Faster!

          Download App
          English
          • English
          • Español
          • العربية
          • Bahasa Indonesia
          • Bahasa Melayu
          • Tiếng Việt
          • ภาษาไทย
          • Français
          • Italiano
          • Türkçe
          • Русский язык
          • 简中
          • 繁中
          Open Account
          Search
          Products
          Charts Free Forever
          Markets
          News
          Signals

          Copy Rankings Latest Signals Become a signal provider AI Rating
          Contests
          Brokers

          Overview Brokers Assessment Rankings Regulators News Claims
          Broker listing Forex Brokers Comparison Tool Live Spread Comparison Scam
          Q&A Complaint Scam Alert Videos Tips to Detect Scam
          More

          Business
          Events
          Careers About Us Advertising Help Center

          White Label

          Data API

          Web Plug-ins

          Affiliate Program

          Awards Institution Evaluation IB Seminar Salon Event Exhibition
          Vietnam Thailand Singapore Dubai
          Fans Party Investment Sharing Session
          FastBull Summit BrokersView Expo

          Yen Stabilization Signals Mask High Bar For Japan–U.S. Coordinated Intervention

          Gerik

          Forex

          Economic

          Summary:

          A rare rate check by the New York Federal Reserve has eased pressure on the yen and raised market expectations for intervention, but structural, political, and financial constraints suggest coordinated Japan–U.S. dollar selling remains unlikely in the near term....

          Rate Check Sends Strong Signal But Stops Short Of Intervention

          The yen’s recent rebound was sparked by an unusual rate check conducted by the New York Federal Reserve, a move widely interpreted as a signal of closer coordination between Japanese and U.S. authorities. The action pushed the yen away from 18-month lows and lowered the perceived threshold for market intervention, offering temporary relief to policymakers concerned about the inflationary effects of a persistently weak currency.
          Despite the market reaction, analysts caution that a rate check should not be confused with imminent joint action. Historically, coordinated intervention has been reserved for exceptional circumstances such as financial crises or major natural disasters. As JPMorgan strategist Junya Tanase noted, the distance between rate checks and full-scale coordinated intervention remains substantial.

          Political Alignment Exists But Policy Limits Persist

          The Fed’s move did not occur in isolation. It followed years of diplomatic effort by Japan to secure U.S. backing for intervention against excessive currency volatility, culminating in a bilateral statement signed last year. Japanese Finance Minister Satsuki Katayama has repeatedly emphasized alignment with U.S. Treasury Secretary Scott Bessent on currency issues, reinforcing the perception of shared concern over disorderly market moves.
          However, alignment on rhetoric does not automatically translate into action. Domestic considerations in the United States significantly constrain the scope for coordinated dollar selling. U.S. officials appear willing to support Japan through signaling mechanisms such as rate checks, but remain reluctant to engage in measures that could materially weaken the dollar or disrupt U.S. financial markets.

          Market Impact Reflects Fear More Than Action

          For now, the threat of intervention alone has proven effective. The yen strengthened to a two-month high near 153.89 per dollar, well above levels around 160 that markets view as a line in the sand for intervention. Japanese government bond yields also eased modestly, helping contain spillover risks into U.S. Treasury markets.
          This reaction underscores a causal relationship between policy signaling and market behavior. Expectations of action, even without execution, can stabilize currency markets in the short term. Yet this effect tends to fade unless reinforced by concrete measures.

          Washington’s Reluctance To Sell Dollars

          From the U.S. perspective, coordinated intervention presents several drawbacks. Sustained yen-buying would require Japan to sell part of its U.S. Treasury holdings, potentially pushing up U.S. yields at a time when markets remain sensitive to funding costs. Moreover, further dollar weakness could revive the so-called “Sell America” trade, something Washington is keen to avoid amid concerns about global de-dollarization.
          Analysts at Mitsubishi UFJ Morgan Stanley Securities argue that even if the U.S. were to cooperate in a limited intervention, it would be unlikely to reverse a five-year downtrend in the yen. Any cooperation would therefore be tactical rather than transformational.
          G7 Protocol And Historical Constraints
          Even with U.S. backing, Japan faces procedural hurdles. Under established protocol, Tokyo would need to consult with other G7 nations before entering the market. The last coordinated G7 intervention on the yen occurred in 2011 following Japan’s earthquake and tsunami, a context fundamentally different from today’s policy driven currency weakness.
          Former Japanese finance minister Yoshihiko Noda has emphasized that current yen depreciation reflects market concerns over fiscal policy and interest rate differentials rather than an exogenous shock, raising the bar for multilateral action.

          Bank Of Japan Caught Between Yen And Yields

          The Bank of Japan remains constrained by conflicting objectives. On one hand, it must prevent excessive yen weakness that fuels imported inflation. On the other, aggressive signaling or intervention risks pushing up bond yields, undermining financial stability.
          Governor Kazuo Ueda has acknowledged that long-term rates are rising quickly, yet has avoided committing to emergency bond buying or adjustments to tapering plans. This deliberate ambiguity reflects the delicate balance policymakers are trying to maintain.
          As analysts at ANZ note, aggressive bond buying to cap yields would likely weaken the yen further, counteracting efforts to stabilize the currency. Combined with domestic political pressure for tax cuts, these dynamics continue to bias the yen toward weakness.

          Stability Without Resolution

          The latest rate check has calmed markets, but it has not resolved the structural forces weighing on the yen. While Japan and the U.S. appear aligned in their desire to prevent disorderly moves, the political, financial, and institutional hurdles to coordinated intervention remain high.
          For now, markets are likely to remain driven by expectations rather than action. Without a clear catalyst such as a crisis or extreme volatility, coordinated yen intervention looks more like a contingency plan than an imminent policy choice.

          Source: Reuters

          To stay updated on all economic events of today, please check out our Economic calendar
          Risk Warnings and Disclaimers
          You understand and acknowledge that there is a high degree of risk involved in trading. Following any strategies or investment methods may lead to potential losses. The content on the site is provided by our contributors and analysts for information purposes only. You are solely responsible for determining whether any trading assets, securities, strategy, or any other product is suitable for investing based on your own investment objectives and financial situation.
          Add to Favorites
          Share

          Durable Goods Orders Rebound, Natural Gas Prices Experience Sharp Volatility

          FastBull Featured

          Daily News

          [Quick Facts]

          1. Zelenskyy: Ukraine, the U.S., and Russia may hold Trilateral Talks again on February 1st.
          2. Trump: Tariffs on some South Korean goods to be raised to 25%.
          3. U.S. may demand Japan increase defense spending to 5% of GDP.
          4. Poll shows Trump's immigration policy approval hits a new low during his current term.
          5. U.S. November Durable Goods Orders post largest gain in six months.
          6. U.S. natural gas prices break the $7 mark, and some spot prices surge past $200.

          [News Details]

          Zelenskyy: Ukraine, the U.S., and Russia may hold Trilateral Talks again on February 1st
          In a video address on the evening of January 26th, Ukrainian President Volodymyr Zelenskyy said that Ukraine, the United States, and Russia may hold trilateral talks again on February 1st. He noted that teams had discussed resuming talks this past Sunday and expressed hope that progress could be accelerated to make such a meeting happen sooner.
          Trump: Tariffs on some South Korean goods to be raised to 25%
          On social media, Trump stated that trade agreements are vital for the United States. In every agreement, the United States acts swiftly to reduce tariffs per established terms. Naturally, he expects trading partners to do the same. "South Korea's Legislature is not living up to its Deal with the United States," Trump said. "Because the Korean Legislature hasn't enacted our Historic Trade Agreement, which is their prerogative, I am hereby increasing South Korean TARIFFS on Autos, Lumber, Pharma, and all other Reciprocal TARIFFS, from 15% to 25%."
          U.S. may demand Japan increase defense spending to 5% of GDP
          According to Kyodo News, the U.S. Department of Defense recently announced that Deputy Secretary of Defense Elbridge Colby will visit Japan and may directly urge Tokyo to raise defense spending as a share of GDP to 5%. Japanese media reported that last June, the U.S. government proposed increasing Japan's defense spending ratio to 3.5%, but Japan at the time found it difficult to agree.
          However, since Takaichi Sanae took office last October, Japan has rapidly pushed to achieve a 2% defense spending target two years ahead of schedule. This approach, prioritizing military expansion over public welfare, has drawn criticism from various sectors in Japan.
          Poll shows Trump's immigration policy approval hits a new low during his current term
          Based on a new poll released on January 26th, President Trump's public support on immigration issues has fallen to its lowest level since taking office. Most respondents believe his administration has gone too far in immigration enforcement. Only 39% of American adults approve of Trump's handling of immigration, down from 41% earlier this month. 53% respondents disapprove.
          By contrast, immigration was once a relative strength early in his term, and support reached 50% in February last year. The poll also found that about 58% of respondents think U.S. Immigration and Customs Enforcement (ICE) actions have gone too far. Among Democrats, roughly 90% see enforcement as excessive, while about 60% of independent voters share that view. Overall, Trump's job approval rating stands at 38%, matching his lowest point during this term and below the 41% recorded in the January 12–13 poll.
          U.S. November Durable Goods Orders post largest gain in six months
          U.S. durable goods orders in November 2025 recorded their biggest monthly rise in six months, driven mainly by orders for commercial aircraft and other capital equipment. According to the U.S. Commerce Department, durable goods orders rose 5.3%, following a revised decline of 2.1% the previous month. Data released Monday also showed that core capital goods orders excluding aircraft and military equipment, an indicator of business equipment investment, rose 0.7% month-on-month, beating expectations.
          U.S. natural gas prices break the $7 mark, and some spot prices surge past $200
          Reports indicate that severe cold weather across much of the U.S. has sharply increased heating demand while supply disruptions occurred, pushing natural gas prices higher. At 12:45 p.m. Eastern Time on Monday, the front-month natural gas futures contract broke above $7 per million British thermal units (MMBtu), the first time since 2022, rising 40% from Friday's close.
          Meanwhile, traders reported spot prices at Louisiana's Henry Hub delivery point spiked to as high as $53/MMBtu. In the frigid Northeast, spot prices at the Iroquois Zone 2 hub exceeded $200/MMBtu. The winter storm is estimated to disrupt about 12% of U.S. natural gas production. Traders are closely watching how long these output interruptions will persist.

          [Today's Focus]

          UTC+8 22:00 U.S. November FHFA House Price Index (MoM)
          UTC+8 23:00 U.S. January Conference Board Consumer Confidence Index
          Risk Warnings and Disclaimers
          You understand and acknowledge that there is a high degree of risk involved in trading. Following any strategies or investment methods may lead to potential losses. The content on the site is provided by our contributors and analysts for information purposes only. You are solely responsible for determining whether any trading assets, securities, strategy, or any other product is suitable for investing based on your own investment objectives and financial situation.
          Add to Favorites
          Share

          AI's Power Thirst: A Threat to the US Grid?

          George Anderson

          Energy

          Political

          Economic

          Remarks of Officials

          After two decades of flat electricity demand, artificial intelligence has appeared as both a massive opportunity and a potential crisis for the US power industry. The surge in energy consumption from AI and data centers dominated the conversation at the annual BloombergNEF summit in San Francisco, revealing deep concerns about cost, infrastructure, and policy.

          The data center boom is already a powerful force in the American economy, influencing local elections in New Jersey, Virginia, and Georgia last November. Its growing impact is now expected to be a significant factor in this fall's congressional midterms.

          Here are five key issues shaping the intersection of AI and the nation's power grid.

          Who Foots the Bill for AI's Energy Boom?

          As energy affordability becomes a major concern, data centers face growing pressure to cover the costs of their immense power needs without passing the burden onto the public.

          "Consumers may end up holding the bag," warned Amory Lovins, co-founder and chairman emeritus of RMI.

          Ryan Wiser, a senior scientist at Lawrence Berkeley National Laboratory, argued that since data centers are the primary driver of rising utility costs, "they also need to be the ones to cover that."

          In response, President Donald Trump and a group of governors from the Northeast and Mid-Atlantic have proposed an emergency wholesale electricity auction. This plan would compel tech companies to fund the construction of new power plants, aiming to both secure the energy data centers need and control rising utility bills for everyone else.

          The Nuclear Option: Clean Power on a Slow Timeline

          Tech companies have been clear about their preferred energy source: nuclear power. Valued for its ability to provide clean, reliable, round-the-clock electricity, it has attracted major investment. Meta Platforms Inc. has made significant deals with nuclear startups, and Microsoft Corp. has spearheaded efforts to restart a closed power plant.

          Despite this enthusiasm, the reality on the ground is stark. Not a single new small modular reactor (SMR) has been built in the US, and only one design has received approval from the US Nuclear Regulatory Commission. A traditional nuclear plant takes roughly a decade to bring online—a timeline completely out of sync with the rapid growth of AI.

          The core challenge remains unchanged. The question, according to BNEF analyst Musfika Mishi, is whether reactors can "be built on time, on budget and actually be competitive with natural gas." Currently, nuclear energy in the US is three times more expensive than natural gas. While SMR developers promise to lower costs, it remains to be seen if they can deliver.

          How Big is the AI Power Bubble?

          Beyond the debate over which technology is best, a more fundamental uncertainty looms: just how much electricity will AI actually require?

          Forecasts for data center demand vary dramatically. PJM Interconnection, the operator of the largest US grid, recently revised its 2027 summer forecast downward after analyzing connection requests more closely. However, the overall trend is one of explosive growth.

          • BNEF projects US data center demand will reach around 400 terawatt-hours by 2030.

          • Other forecasts are far more aggressive, with some predicting demand could exceed 1,000 terawatt-hours by the end of the decade.

          Lovins cautioned investors to consider the significant financial risks of building a fleet of new natural-gas power plants based on these projections. He pointed to the possibility that data centers could become much more energy-efficient or that the AI boom itself could deflate.

          "Demand uncertainty and financial risk rise deeply when artificial intelligence meets natural stupidity," Lovins said.

          Conflicting Signals in US Energy Policy

          The Trump administration's energy policy has been marked by contradictions. While the president has pushed for a data center boom that requires vast amounts of new energy, he has also made it more difficult to build wind power projects.

          Simultaneously, the US withdrawal from multiple climate agreements has allowed China to extend its already dominant lead in clean technology. Former Energy Secretary Jennifer Granholm described this as a major problem.

          "Our economic competitors like China are so happy that the US has pulled back," she stated.

          A Look Ahead: Lessons from Past Policy Shifts

          Reflecting on her time in the Biden administration, Granholm recalled overseeing the allocation of tens of billions of dollars in loans and grants for clean technologies like hydrogen and carbon removal. Much of that funding was later reversed or eliminated by the Trump administration.

          Granholm believes Democrats should learn from this aggressive approach when pursuing their own clean energy agenda.

          "The cancellation of all of these loans and grants was stunning to a lot of people who had worked on those because we thought we had commitments, we had obligations," she said. "Had we known that there would be such a slash-and-burn mentality about it, I think we would've done things differently."

          Her advice to the next Democrat in the White House was simple: "Don't be afraid to break some eggs."

          To stay updated on all economic events of today, please check out our Economic calendar
          Risk Warnings and Disclaimers
          You understand and acknowledge that there is a high degree of risk involved in trading. Following any strategies or investment methods may lead to potential losses. The content on the site is provided by our contributors and analysts for information purposes only. You are solely responsible for determining whether any trading assets, securities, strategy, or any other product is suitable for investing based on your own investment objectives and financial situation.
          Add to Favorites
          Share

          Oil Prices Slip Despite Major US Supply Shock

          Dark Current

          Energy

          Commodity

          Daily News

          Oil prices edged lower on Tuesday, defying a major supply disruption as a massive winter storm swept across the United States, impacting both crude production and refinery operations.

          Brent crude futures registered a 0.4% decline, falling 28 cents to US$65.31 a barrel by 0145 GMT. Similarly, US West Texas Intermediate (WTI) crude dropped 24 cents, or 0.4%, to trade at US$60.39 a barrel.

          US Winter Storm Halts Oil Production

          The price dip comes as a severe winter storm strained energy infrastructure across the US. According to analysts and traders, the extreme weather knocked out up to two million barrels of daily crude production over the weekend, accounting for roughly 15% of the nation's total output.

          The freezing conditions also created significant operational issues for several refineries located along the US Gulf Coast. Daniel Hynes, an analyst at ANZ, noted that these disruptions have raised concerns about potential fuel supply shortages.

          Global Supply Factors in Play

          Beyond the immediate weather impact, traders are also watching geopolitical and policy developments that could influence the market.

          Middle East Tensions Add Risk

          Supply risks in the Middle East remain a key factor. According to two US officials, an American aircraft carrier and its supporting warships arrived in the region on Monday. This deployment expands President Donald Trump's military capabilities to either defend US forces or take potential action against Iran.

          "Supply risks haven't totally evaporated," said Hynes, adding that "Tension in the Middle East persists after President Trump dispatched naval assets to the region."

          OPEC+ Poised to Hold Production Steady

          Meanwhile, key members of the Organization of the Petroleum Exporting Countries and their allies (OPEC+) are expected to maintain their current pause on oil output increases for March.

          Three OPEC+ delegates indicated that the decision is likely to be confirmed at a meeting on February 1. The group's stance is supported by rising oil prices, which have been partly driven by a recent drop in Kazakhstan's oil production.

          The eight OPEC+ members participating in the meeting are:

          • Saudi Arabia

          • Russia

          • UAE

          • Kazakhstan

          • Kuwait

          • Iraq

          • Algeria

          • Oman

          Risk Warnings and Disclaimers
          You understand and acknowledge that there is a high degree of risk involved in trading. Following any strategies or investment methods may lead to potential losses. The content on the site is provided by our contributors and analysts for information purposes only. You are solely responsible for determining whether any trading assets, securities, strategy, or any other product is suitable for investing based on your own investment objectives and financial situation.
          Add to Favorites
          Share

          China's Industrial Profit Rises in 2025, Ending 4-Year Slump

          Thomas

          Data Interpretation

          Economic

          China–U.S. Trade War

          China's industrial sector posted its first annual profit increase in four years in 2025, signaling a potential stabilization for businesses in the $19 trillion economy. The turnaround was supported by a government-led effort to curb damaging price wars and a significant boom in exports that helped compensate for weaker consumption at home.

          A Strong Finish to the Year

          Data from the National Bureau of Statistics reveals a marked improvement in the final month of the year. In December, industrial firm profits climbed 5.3% compared to the same month a year prior, a sharp reversal from the 13.1% year-on-year decline recorded in November.

          This late surge pushed the full-year profit growth for 2025 to 0.6%. This figure represents a slight acceleration from the 0.1% increase seen over the first 11 months of the year and marks the first time since 2021 that annual profits have risen.

          Exports and Auto Sector Fuel Growth

          The recovery was not evenly distributed, with specific industries and factors driving the positive results.

          One of the most critical drivers was the auto industry, which ended 2025 with a 0.6% profit increase. This performance marks a significant turnaround from the 8% profit decline the sector experienced in 2024, largely buoyed by robust export performance.

          More broadly, China's strategy of diversifying its export markets away from the United States helped cushion the economic blow from tariffs imposed by U.S. President Donald Trump, allowing for sustained overseas sales.

          Performance by Ownership Type

          An analysis of the data shows varied outcomes across different types of companies:

          • Foreign Firms: Recorded a 4.2% gain in profit.

          • Private-Sector Firms: Profits remained flat for the year.

          • State-Owned Firms: Saw profits decline by 3.9%.

          The official industrial profit data covers firms with a minimum annual revenue of 20 million yuan ($2.88 million) from their primary operations. The exchange rate used for conversion was $1 to 6.9542 Chinese yuan.

          To stay updated on all economic events of today, please check out our Economic calendar
          Risk Warnings and Disclaimers
          You understand and acknowledge that there is a high degree of risk involved in trading. Following any strategies or investment methods may lead to potential losses. The content on the site is provided by our contributors and analysts for information purposes only. You are solely responsible for determining whether any trading assets, securities, strategy, or any other product is suitable for investing based on your own investment objectives and financial situation.
          Add to Favorites
          Share

          Seoul Rushes Bill as Trump Warns of 25% Auto Tariffs

          James Riley

          Remarks of Officials

          Stocks

          Daily News

          Political

          Economic

          South Korea’s Finance Minister, Koo Yun-cheol, is set to urge lawmakers to fast-track a $350 billion U.S. investment bill following a threat from President Donald Trump to increase tariffs on South Korean automobiles.

          The move comes just hours after Trump announced potential tariff hikes not only on cars but also on South Korean lumber and pharmaceuticals, citing the country's failure to ratify a trade agreement with Washington.

          Trump Signals Higher Tariffs on Korean Imports

          In a social media post, President Trump declared his intention to raise tariffs on a range of South Korean goods. He specifically flagged an increase on auto tariffs from 15% to 25%.

          "South Korea's Legislature is not living up to its Deal with the United States," Trump wrote. He stated that because the legislature had not enacted their "Historic Trade Agreement," he was increasing tariffs on autos, lumber, and pharmaceuticals to 25%.

          South Korea's Plan to Address US Concerns

          In response, South Korea's Finance Ministry announced that Minister Koo Yun-cheol will meet with Lim Lee-ja, the head of the National Assembly's finance committee, to push for the bill's passage. The proposed legislation has been stalled in the committee since its submission in December.

          "We are currently assessing the U.S. side's intentions," the finance ministry said in a statement. "We will communicate with the U.S. government, including by explaining the status of the bill's discussion in the National Assembly."

          The ministry added that it would continue to actively consult with the National Assembly on the matter.

          Automakers Tumble on Tariff News

          The threat from Washington sent immediate ripples through South Korea's stock market. In morning trading, shares of Hyundai Motor fell by more than 2%, while Kia's stock price dropped by over 3%.

          To stay updated on all economic events of today, please check out our Economic calendar
          Risk Warnings and Disclaimers
          You understand and acknowledge that there is a high degree of risk involved in trading. Following any strategies or investment methods may lead to potential losses. The content on the site is provided by our contributors and analysts for information purposes only. You are solely responsible for determining whether any trading assets, securities, strategy, or any other product is suitable for investing based on your own investment objectives and financial situation.
          Add to Favorites
          Share

          Advanced Micro Devices (AMD) Price Forecast: Bullish Structure Holds Near Record Highs

          Samantha Luan

          Stocks

          Key Points:

          · AMD remains near record highs following a strong multi-month rally
          · Weekly structure shows bullish continuation despite recent hesitation
          · Rising moving averages support the broader uptrend
          · Key support zones defined by Fibonacci and prior consolidation
          · Breakout above $267 could open the door to new highs

          AMD Maintains Strength Near Record Highs

          The stock of Advanced Micro Devices (AMD) has been a market leader and remains strong. It is hovering near prior highs around $267. AMD is a leading semiconductor firm specializing in high-performance CPUs, GPUs, and adaptive computer solutions for data centers and gaming. The company competes with Intel (INTC) and Nvidia (NVDA) with innovations like MI300 AI accelerators. In 2025, AMD stock advanced by 77%, and as of Monday's closing price, it was up by 17.3% year-to-date. Earnings are reported next week.

          Weekly Chart Shows Bullish Structure After Breakout

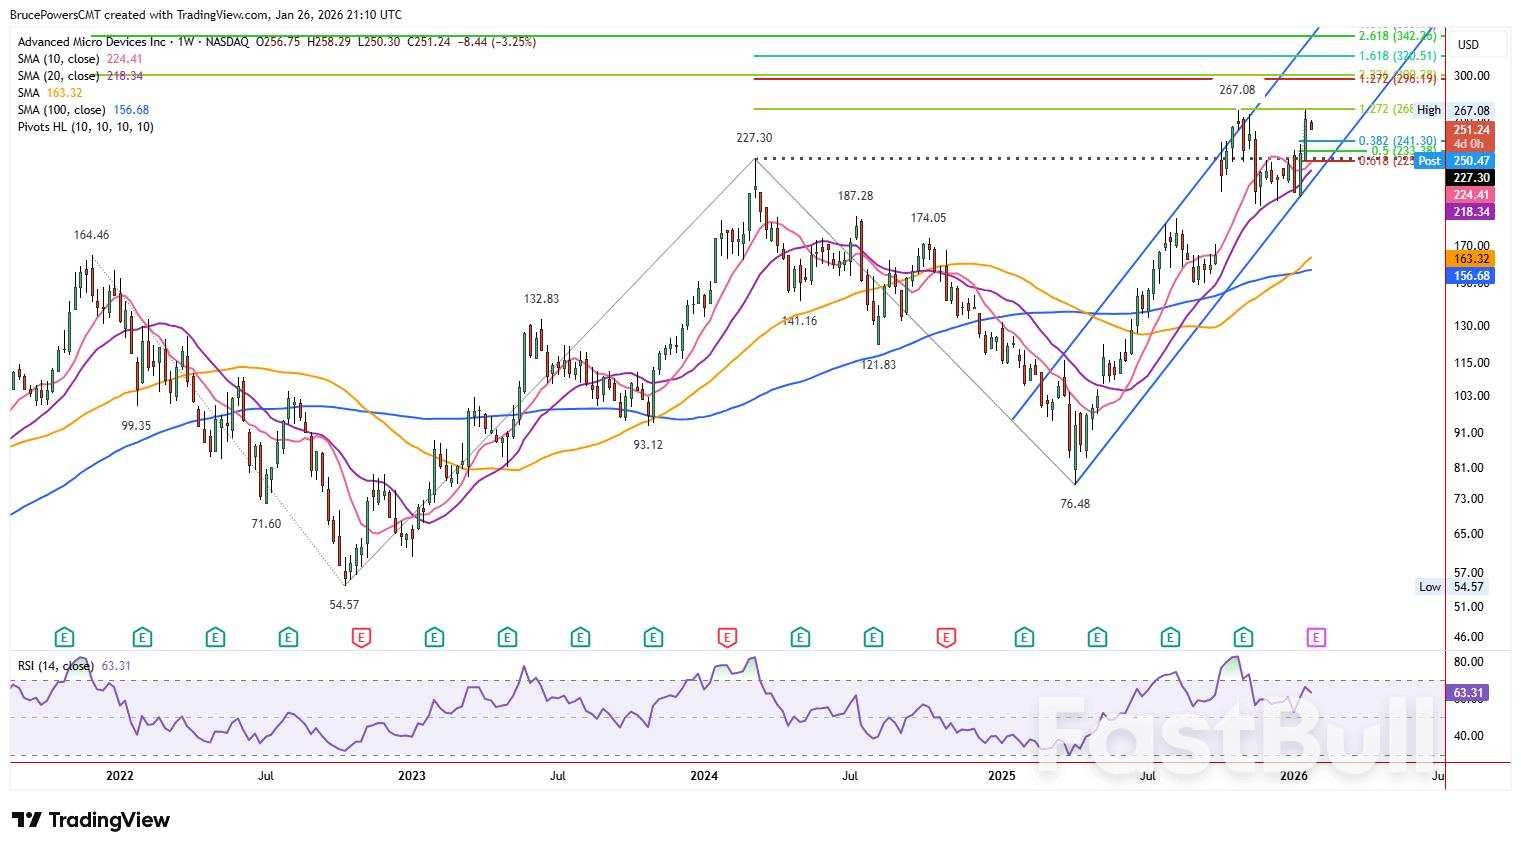
          AMD weekly chart showing that a long term base breakout attempt remains in progress. Source: TradingView as of Jan 26, 2026.

          An attempt to further the advance in AMD stock has been underway following a new record high breakout to $267.08 in October. The first pullback culminated with a higher swing low of $194.28 and a seven-month consolidation bottom phase. During the related consolidation period trend support was recognized near the 20-week average. Last week's the bulls failed to breakout to a new record high as a top was hit at $266.96, very close to the prior high, before weakening on Monday.

          Daily Chart Confirms Trend Strength and Channel Support

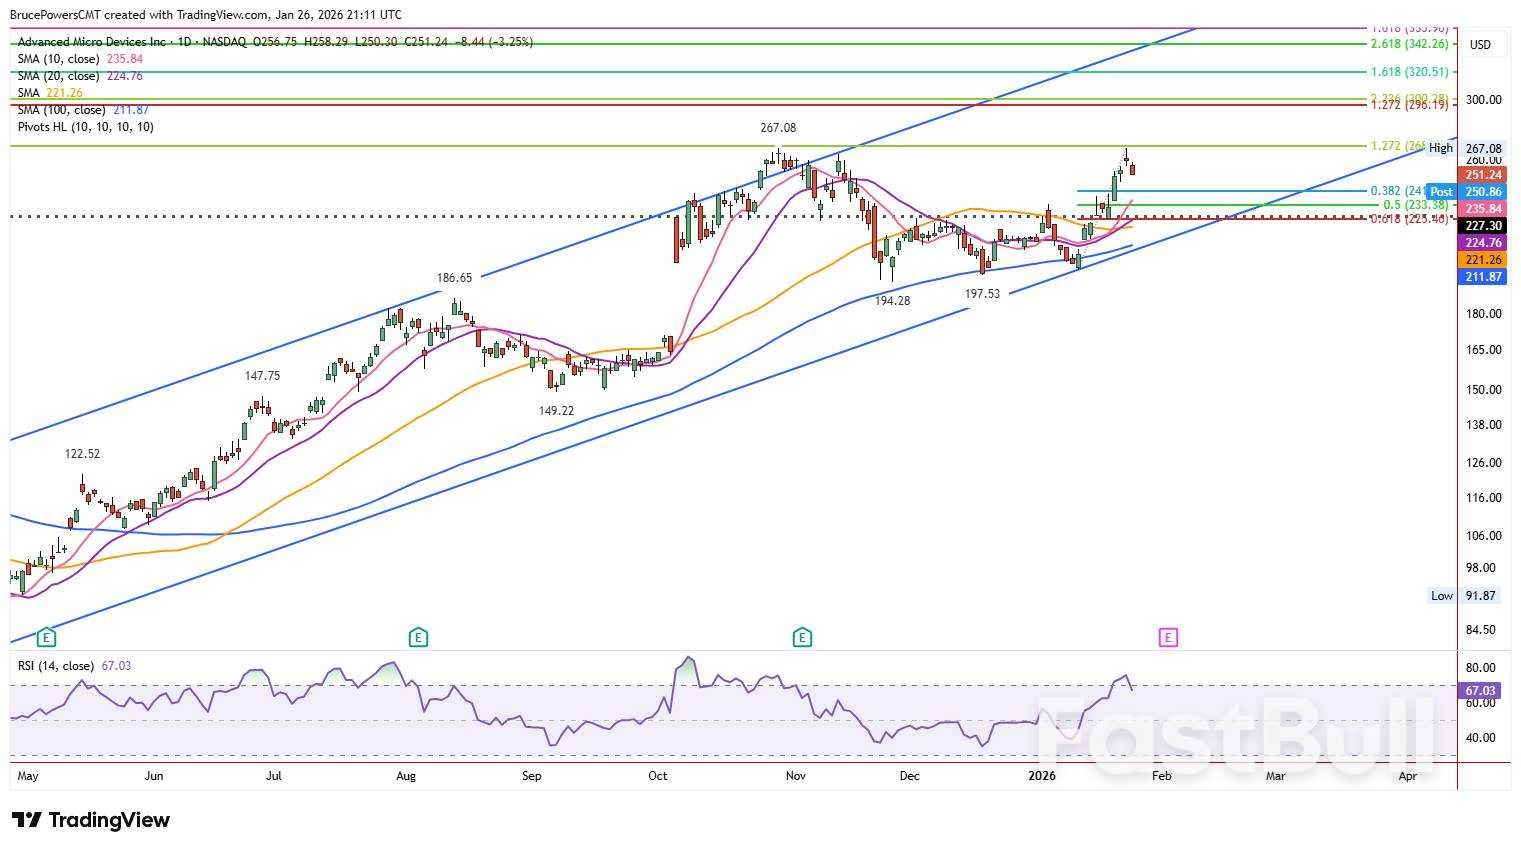
          AMD daily chart showing a bounce off solid dynamic support. Source: TradingView as of Jan 26, 2026.

          Following a pullback from last week's high, the bull structure in AMD shows a likely continuation into new highs. The daily chart confirms underlying strength with faster moving averages rising above the 50-day average recently. Support for the recent pullback was confirmed near the long-term 200-day average. Moreover, a rising channel outlines the price movement within the uptrend, showing the potential for higher prices as the top of the channel is a potential target. A bounce from the lower boundary of the channel improves the possibility of AMD eventually approaching the top boundary line.

          Key Support Levels Define Near-Term Risk

          Last week's low of $225.41 is considered the maximum downside for support to hold while maintaining a short-term bullish structure. It remains possible that AMD trades range-bound for a period before another breakout attempt. However, signs of strength following tests of key support levels may signal the potential for a renewed advance toward the $267.08 high.

          Fibonacci Levels Highlight Deeper Support Zone

          The 38.2% Fibonacci retracement of the prior advance is located at $241.30, while the rising 10-day average is currently near $236. A deeper pullback would bring the 50% retracement into focus at $233.48, which closely aligns with the top of a seven-week consolidation range near $234.02, reinforcing that zone as an important area of technical support.

          Source: FX Empire

          Risk Warnings and Disclaimers
          You understand and acknowledge that there is a high degree of risk involved in trading. Following any strategies or investment methods may lead to potential losses. The content on the site is provided by our contributors and analysts for information purposes only. You are solely responsible for determining whether any trading assets, securities, strategy, or any other product is suitable for investing based on your own investment objectives and financial situation.
          Add to Favorites
          Share
          FastBull
          Copyright © 2026 FastBull Ltd

          728 RM B 7/F GEE LOK IND BLDG NO 34 HUNG TO RD KWUN TONG KLN HONG KONG

          TelegramInstagramTwitterfacebooklinkedin
          App Store Google Play Google Play
          Products
          Charts

          Chats

          Q&A with Experts
          Screeners
          Economic Calendar
          Data
          Tools
          Membership
          Features
          Function
          Markets
          Copy Trading
          Latest Signals
          Contests
          News
          Analysis
          24/7
          Columns
          Education
          Company
          Careers
          About Us
          Contact Us
          Advertising
          Help Center
          Feedback
          User Agreement
          Privacy Policy
          Personal Information Protection Statement
          Business

          White Label

          Data API

          Web Plug-ins

          Poster Maker

          Affiliate Program

          Risk Disclosure

          The risk of loss in trading financial instruments such as stocks, FX, commodities, futures, bonds, ETFs and crypto can be substantial. You may sustain a total loss of the funds that you deposit with your broker. Therefore, you should carefully consider whether such trading is suitable for you in light of your circumstances and financial resources.

          No decision to invest should be made without thoroughly conducting due diligence by yourself or consulting with your financial advisors. Our web content might not suit you since we don't know your financial conditions and investment needs. Our financial information might have latency or contain inaccuracy, so you should be fully responsible for any of your trading and investment decisions. The company will not be responsible for your capital loss.

          Without getting permission from the website, you are not allowed to copy the website's graphics, texts, or trademarks. Intellectual property rights in the content or data incorporated into this website belong to its providers and exchange merchants.

          Not Logged In

          Log in to access more features

          Connect Broker
          Become a signal provider
          Help Center
          Customer Service
          Dark Mode
          Price Up/Down Colors

          Log In

          Sign Up

          Position
          Layout
          Fullscreen
          Default to Chart
          The chart page opens by default when you visit fastbull.com