• Trade
  • Markets
  • Copy
  • Contests
  • News
  • 24/7
  • Calendar
  • Q&A
  • Chats
Screeners
SYMBOL
LAST
ASK
BID
HIGH
LOW
NET CHG.
%CHG.
SPREAD
SPX
S&P 500 Index
6917.82
6917.82
6917.82
6993.09
6862.05
-58.62
-0.84%
--
DJI
Dow Jones Industrial Average
49240.98
49240.98
49240.98
49653.13
48832.78
-166.67
-0.34%
--
IXIC
NASDAQ Composite Index
23255.18
23255.18
23255.18
23691.60
23027.21
-336.92
-1.43%
--
USDX
US Dollar Index
97.160
97.240
97.160
97.300
97.140
-0.040
-0.04%
--
EURUSD
Euro / US Dollar
1.18337
1.18344
1.18337
1.18360
1.18075
+0.00162
+ 0.14%
--
GBPUSD
Pound Sterling / US Dollar
1.37167
1.37177
1.37167
1.37194
1.36821
+0.00203
+ 0.15%
--
XAUUSD
Gold / US Dollar
5075.87
5076.30
5075.87
5090.35
4910.07
+129.62
+ 2.62%
--
WTI
Light Sweet Crude Oil
63.475
63.505
63.475
63.865
63.180
-0.159
-0.25%
--

Community Accounts

Signal Accounts
--
Profit Accounts
--
Loss Accounts
--
View More

Become a signal provider

Sell trading signals to earn additional income

View More

Guide to Copy Trading

Get started with ease and confidence

View More

Signal Accounts for Members

All Signal Accounts

Best Return
  • Best Return
  • Best P/L
  • Best MDD
Past 1W
  • Past 1W
  • Past 1M
  • Past 1Y

All Contests

  • All
  • Trump Updates
  • Recommend
  • Stocks
  • Cryptocurrencies
  • Central Banks
  • Featured News
Top News Only
Share

Azeri Central Bank Sets Key Refinancing Rate At 6.50% (Previously 6.75%)

Share

Eni Sees 2026 LNG Market 'Finely Balanced' On Thin Supply, Asian Demand

Share

Malaysia's Ringgit Continues To Strengthen On Hefty Capital Inflows - Minister Amir

Share

Equinor - Q4 Equity Production At 2198 Mboe/Day (Equinor Poll 2170 Mboe/Day)

Share

UBS CEO: As We Approach End Of Integration, Confident In Ability To Capture Remaining Synergies By Year-End, Which We Increased By $500 Million To $13.5 Billion

Share

UBS: Remain On Track To Complete Integration By Year-End, With Greater Proportion Of Net Saves Weighted To H2 2026

Share

UBS: Net New Asset Inflows In Global Wealth Management For The Year Reached $101 Billion

Share

UBS: Continued Wind-Down Of Non-Core And Legacy Risk-Weighted Asset, Reducing Rwa To $28.8 Billion

Share

UBS: Q4 Full-Time Equivalent Personnel At 103177 Versus 104427 As Of September 30, 2025

Share

Kazakhstan's Kaztransoil: Supplies Of 1.017 Million Tons Of Oil, Including 863000 Tons Of Russian Oil, To China In January Via Kazakhstan

Share

Bank Of Japan Won't Come To The Rescue Of A Takaichi-Driven Bond Rout

Share

New York Gold Futures Broke Through $5,100 Per Ounce, Up 3.34% On The Day

Share

Spot Gold Broke Through $5,080 Per Ounce, Up 2.71% On The Day

Share

Petronas Sets January Malaysian Crude Oil Price At $74.35

Share

Hsi Closes Midday At 26724, Down 109 Pts, Hsti Closes Midday At 5347, Down 119 Pts, Tencent Down Over 3%, Xinyi Glass, Techtronic Ind, Wharf Reic, Yankuang Energy, China East Air Hit New Highs

Share

India's Nifty 50 Index Turns Positive, Last Up 0.2%

Share

India's NIFTY IT Index Extends Losses, Last Down 6%

Share

《Hibor》1-Month Hibor Down To 2.49%, Sinking For 9 Days Logging 1-Month Low

Share

India's Nifty Bank Index Futures Down 0.05% In Pre-Open Trade

Share

Spot Gold Broke Through $5,070 Per Ounce, Up 2.49% On The Day

TIME
ACT
FCST
PREV
US President Trump delivered a speech
South Korea CPI YoY (Jan)

A:--

F: --

P: --

Japan Monetary Base YoY (SA) (Jan)

A:--

F: --

P: --

Australia Building Approval Total YoY (Dec)

A:--

F: --

P: --
Australia Building Permits MoM (SA) (Dec)

A:--

F: --

P: --
Australia Building Permits YoY (SA) (Dec)

A:--

F: --

P: --

Australia Private Building Permits MoM (SA) (Dec)

A:--

F: --

P: --
Australia Overnight (Borrowing) Key Rate

A:--

F: --

P: --

RBA Rate Statement
Japan 10-Year Note Auction Yield

A:--

F: --

P: --

The U.S. House of Representatives voted on a short-term spending bill to end the partial government shutdown.
Saudi Arabia IHS Markit Composite PMI (Jan)

A:--

F: --

P: --

RBA Press Conference
Turkey PPI YoY (Jan)

A:--

F: --

P: --

Turkey CPI YoY (Jan)

A:--

F: --

P: --

Turkey CPI YoY (Excl. Energy, Food, Beverage, Tobacco & Gold) (Jan)

A:--

F: --

P: --

U.K. 10-Year Note Auction Yield

A:--

F: --

P: --

Richmond Federal Reserve President Barkin delivered a speech.
U.S. Weekly Redbook Index YoY

A:--

F: --

P: --

Mexico Manufacturing PMI (Jan)

A:--

F: --

P: --

U.S. API Weekly Refined Oil Stocks

A:--

F: --

P: --

U.S. API Weekly Gasoline Stocks

A:--

F: --

P: --

U.S. API Weekly Cushing Crude Oil Stocks

A:--

F: --

P: --

U.S. API Weekly Crude Oil Stocks

A:--

F: --

P: --

Japan IHS Markit Services PMI (Jan)

A:--

F: --

P: --

Japan IHS Markit Composite PMI (Jan)

A:--

F: --

P: --

China, Mainland Caixin Services PMI (Jan)

A:--

F: --

P: --

China, Mainland Caixin Composite PMI (Jan)

A:--

F: --

P: --

India HSBC Services PMI Final (Jan)

A:--

F: --

P: --

India IHS Markit Composite PMI (Jan)

A:--

F: --

P: --

Russia IHS Markit Services PMI (Jan)

A:--

F: --

P: --

South Africa IHS Markit Composite PMI (SA) (Jan)

--

F: --

P: --

Italy Services PMI (SA) (Jan)

--

F: --

P: --

Italy Composite PMI (Jan)

--

F: --

P: --

Germany Composite PMI Final (SA) (Jan)

--

F: --

P: --

Euro Zone Composite PMI Final (Jan)

--

F: --

P: --

Euro Zone Services PMI Final (Jan)

--

F: --

P: --

U.K. Composite PMI Final (Jan)

--

F: --

P: --

U.K. Total Reserve Assets (Jan)

--

F: --

P: --

U.K. Services PMI Final (Jan)

--

F: --

P: --

U.K. Official Reserves Changes (Jan)

--

F: --

P: --

Euro Zone Core CPI Prelim YoY (Jan)

--

F: --

P: --

Euro Zone Core HICP Prelim YoY (Jan)

--

F: --

P: --

Euro Zone PPI MoM (Dec)

--

F: --

P: --

Euro Zone HICP Prelim YoY (Jan)

--

F: --

P: --

Euro Zone Core HICP Prelim MoM (Jan)

--

F: --

P: --

Italy HICP Prelim YoY (Jan)

--

F: --

P: --

Euro Zone Core CPI Prelim MoM (Jan)

--

F: --

P: --

Euro Zone PPI YoY (Dec)

--

F: --

P: --

U.S. MBA Mortgage Application Activity Index WoW

--

F: --

P: --

Brazil IHS Markit Composite PMI (Jan)

--

F: --

P: --

Brazil IHS Markit Services PMI (Jan)

--

F: --

P: --

U.S. ADP Employment (Jan)

--

F: --

P: --

The U.S. Treasury Department released its quarterly refinancing statement.
U.S. IHS Markit Composite PMI Final (Jan)

--

F: --

P: --

U.S. IHS Markit Services PMI Final (Jan)

--

F: --

P: --

U.S. ISM Non-Manufacturing Price Index (Jan)

--

F: --

P: --

U.S. ISM Non-Manufacturing Employment Index (Jan)

--

F: --

P: --

U.S. ISM Non-Manufacturing New Orders Index (Jan)

--

F: --

P: --

U.S. ISM Non-Manufacturing PMI (Jan)

--

F: --

P: --

U.S. ISM Non-Manufacturing Inventories Index (Jan)

--

F: --

P: --

Q&A with Experts
    • All
    • Chatrooms
    • Groups
    • Friends
    Brendon Urie flag
    Brendon Urie
    gold sell now 5088/5090 target 5085/ target 5082/ target 5070/5060 stop loss 5102
    xauusd Sell tp1 5085 Hit 🎯 running Profits +30 Pips ❤️‍🔥 pro Entry Clean Execution 💥💥
    Brendon Urie flag
    Brendon Urie flag
    who want accurate trades daily 7/10
    SlowBear ⛅ flag
    marsgents
    @marsgents Oh that is clean bro, you milk front back and centre, i was not in the mood to tade Gold that way yesterday i just took one and slept on it
    Issy Nakam flag
    USDJPY has reached its 61.8 fib retrasement , verry exited to see what will happen , looking at a drop to 155.030 before continuation of the intended bulish direction .
    Issy Nakam flag
    Brendon Urie flag
    Brendon Urie
    gold sell now 4988/4990 target 4985/ target 4982/ target 4970/4960 stop loss 5002
    xauusd Sell. Tp2 5081 Hit Successfully running Profits +70 Pip's ❤️‍🔥 pro Entry Clean Execution ❤️‍🔥 let's Close All
    Brendon Urie flag
    Brendon Urie flag
    who want accurate trades daily 7/10
    marsgents flag
    SlowBear ⛅
    @SlowBear ⛅it need retest low,but keep refusing boss🤣
    SlowBear ⛅ flag
    Issy Nakam
    USDJPY has reached its 61.8 fib retrasement , verry exited to see what will happen , looking at a drop to 155.030 before continuation of the intended bulish direction .
    @Issy Nakam i am looking for a drop on UJ towards 149 before i run a buy back on it
    SlowBear ⛅ flag
    Issy Nakam
    @Issy NakamThis is decent though, if we are focusing on that trend and the trendline, but i am sleeping on the daily trend! Ans that needs a 3wave corrective move!
    SlowBear ⛅ flag
    marsgents
    @marsgents Yes we know what happen when Gold refuse to retest low, it runs up, ten crash down!
    marsgents flag
    SlowBear ⛅
    @SlowBear ⛅we need careful on her,she wipe 2 weeks gain in 2 days when her period came😂
    marsgents flag
    SlowBear ⛅
    @SlowBear ⛅4h base on recent rally look weak boss
    SlowBear ⛅ flag
    marsgents
    @marsgents Oh yes, and lets hope the next pain does not have anything to do with her labouring
    SlowBear ⛅ flag
    marsgents
    @marsgentsI am seeing that bos, you can tune it done to 15min ans see a real weakness
    SlowBear ⛅ flag
    marsgents
    @marsgentsOn 15min the candles looks like a minions doji - very weird bro, i wil not be running into this just hold and shill!
    Issy Nakam flag
    SlowBear ⛅
    @SlowBear ⛅ Highly looking for a break and retest for a potential bearish to the trendline , than counter trade for the week . HOW IS GOLD still sending people to the village ..
    marsgents flag
    SlowBear ⛅
    @SlowBear ⛅papoy candle
    Type here...
    Add Symbol or Code

      No matching data

      All
      Trump Updates
      Recommend
      Stocks
      Cryptocurrencies
      Central Banks
      Featured News
      • All
      • Russia-Ukraine Conflict
      • Middle East Flashpoint
      • All
      • Russia-Ukraine Conflict
      • Middle East Flashpoint
      Search
      Products

      Charts Free Forever

      Chats Q&A with Experts
      Screeners Economic Calendar Data Tools
      Membership Features
      Data Warehouse Market Trends Institutional Data Policy Rates Macro

      Market Trends

      Market Sentiment Order Book Forex Correlations

      Top Indicators

      Charts Free Forever
      Markets

      News

      News Analysis 24/7 Columns Education
      From Institutions From Analysts
      Topics Columnists

      Latest Views

      Latest Views

      Trending Topics

      Top Columnists

      Latest Update

      Signals

      Copy Rankings Latest Signals Become a signal provider AI Rating
      Contests
      Brokers

      Overview Brokers Assessment Rankings Regulators News Claims
      Broker listing Forex Brokers Comparison Tool Live Spread Comparison Scam
      Q&A Complaint Scam Alert Videos Tips to Detect Scam
      More

      Business
      Events
      Careers About Us Advertising Help Center

      White Label

      Broker API

      Data API

      Web Plug-ins

      Affiliate Program

      Awards Institution Evaluation IB Seminar Salon Event Exhibition
      Vietnam Thailand Singapore Dubai
      Fans Party Investment Sharing Session
      FastBull Summit BrokersView Expo
      Recent Searches
        Top Searches
          Markets
          News
          Analysis
          User
          24/7
          Economic Calendar
          Education
          Data
          • Names
          • Latest
          • Prev

          View All

          No data

          Scan to Download

          Faster Charts, Chat Faster!

          Download App
          English
          • English
          • Español
          • العربية
          • Bahasa Indonesia
          • Bahasa Melayu
          • Tiếng Việt
          • ภาษาไทย
          • Français
          • Italiano
          • Türkçe
          • Русский язык
          • 简中
          • 繁中
          Open Account
          Search
          Products
          Charts Free Forever
          Markets
          News
          Signals

          Copy Rankings Latest Signals Become a signal provider AI Rating
          Contests
          Brokers

          Overview Brokers Assessment Rankings Regulators News Claims
          Broker listing Forex Brokers Comparison Tool Live Spread Comparison Scam
          Q&A Complaint Scam Alert Videos Tips to Detect Scam
          More

          Business
          Events
          Careers About Us Advertising Help Center

          White Label

          Broker API

          Data API

          Web Plug-ins

          Affiliate Program

          Awards Institution Evaluation IB Seminar Salon Event Exhibition
          Vietnam Thailand Singapore Dubai
          Fans Party Investment Sharing Session
          FastBull Summit BrokersView Expo

          Thai Markets Unloved as Election Stokes Investor Fears

          Thomas

          Remarks of Officials

          Data Interpretation

          Stocks

          Economic

          Central Bank

          Political

          Bond

          Summary:

          Thailand's cheap assets are overlooked as global investors doubt its election will reform a struggling economy.

          Thailand's sluggish economy has pushed its stocks and bonds into a precarious position: cheap, overlooked, and increasingly off the radar for global capital. With a general election this weekend, major money managers are signaling caution, viewing the vote as more likely to worsen existing challenges than to solve them.

          Persistent issues like high household debt and weak growth have already taken their toll. In the past year, Thai stocks were among the world's worst performers, while its bonds lagged most emerging market peers in 2026. Investors see little reason to believe the country's fourth leader in three years can deliver the reforms needed to fix poor governance and policy drift.

          The market consensus points to a steeper yield curve, driven by potential interest rate cuts and government spending, while equities remain depressed as capital seeks opportunities elsewhere.

          "Thailand does look cheap in terms of valuations," said Christopher Leow, chief investment officer at Principal Asset Management in Singapore. "But looking cheap is probably not enough."

          Global Fund Managers Keep Their Distance

          The sentiment is clear among institutional investors, who are limiting their exposure ahead of the election.

          • T Rowe Price Group Inc. has reduced its bond holdings and remains cautious on local currency debt, waiting for clear policy direction before committing more capital.

          • Allianz Global Investors holds a broadly underweight allocation but is considering a shift into longer-duration bonds.

          • Aberdeen is favoring defensive stocks and exporters to minimize exposure to the domestic Thai economy, warning that a fragile coalition government could lead to uneven policy execution.

          "For lasting investor confidence, the election is only the starting point," said Nattanont Arunyakananda, an investment manager at Aberdeen in Bangkok. He stressed that the outlook depends on credible reforms and sustained fiscal and monetary support. "Without reforms that lift productivity and improve the investment climate, any post-election bounce is likely to remain tactical rather than structural."

          History Suggests a Short-Lived Rally

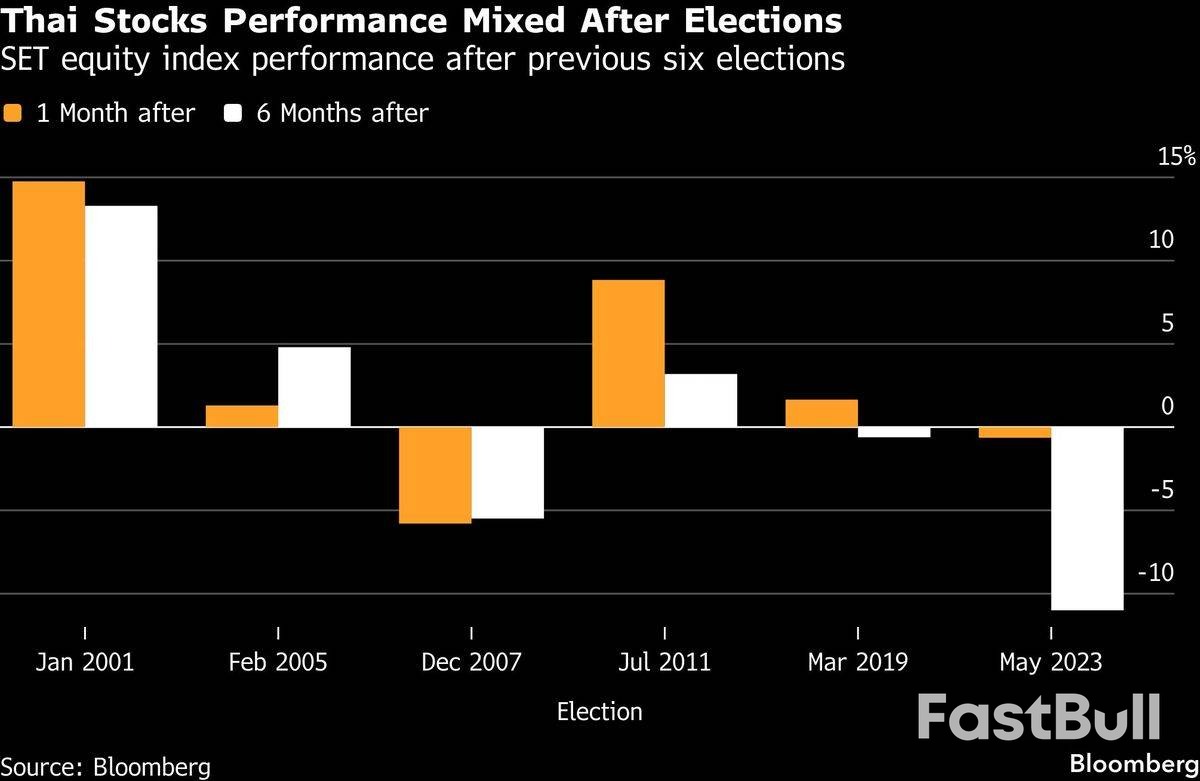
          Historically, Thai markets have seen a brief lift after elections. Over the past three votes, the benchmark Stock Exchange of Thailand (SET) Index gained an average of 3.3% in the month following the polls. However, these rallies often fade as political realities set in.

          A chart showing mixed results for the Thai SET index one and six months after elections from 2001 to 2023.

          The ongoing worries are forcing a rethink of Thai assets in international portfolios. Once valued for their exposure to global growth, they have lost appeal due to a stagnant economy, weak tourism, and recurring political instability.

          Debt and Spending Promises Weigh on Markets

          A key concern is the expected rise in debt issuance needed to fund campaign promises from leading political parties. With the central bank forecasting economic growth of just 2.2% in 2025—trailing regional peers—the government has already approved a US$1.4 billion food and services subsidy program.

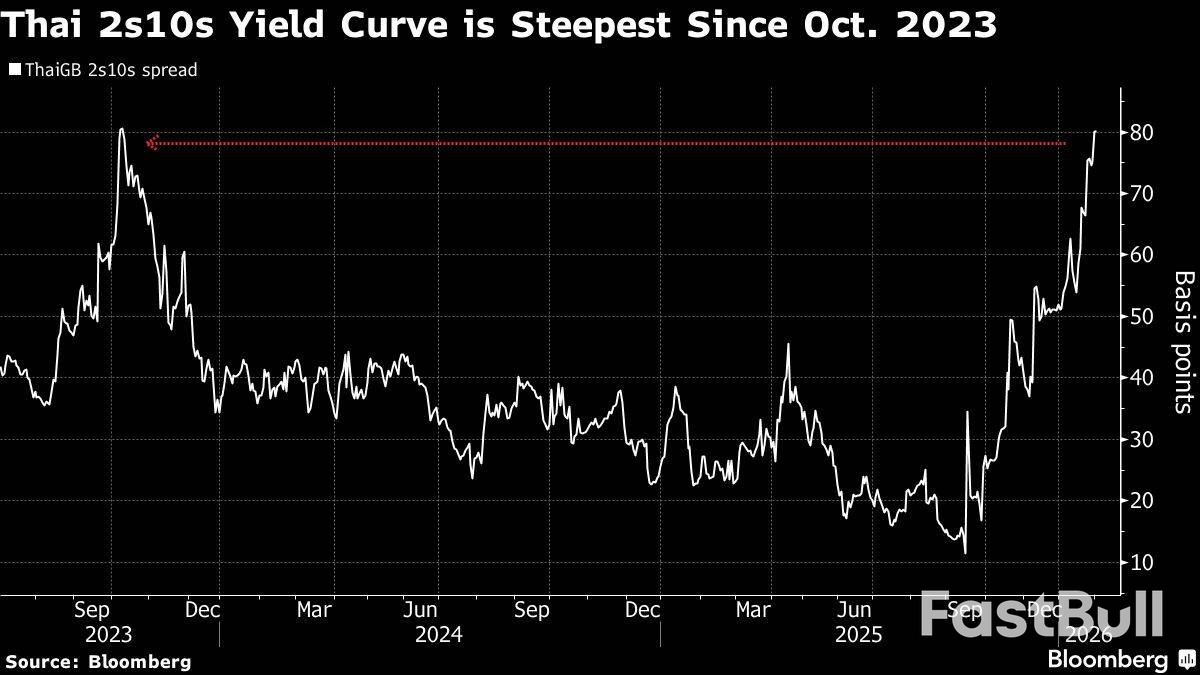
          These additional spending pledges have helped push the spread between Thailand's two- and 10-year bond yields to its widest point since October 2023.

          A line graph showing the spread between Thailand's 2-year and 10-year government bonds steepening to its highest level since October 2023.

          "We'll be looking for them to invest into unleashing the potential of the economy," said Leonard Kwan, a portfolio manager at T Rowe Price in Hong Kong. While Thailand has some fiscal capacity, he added, "the key question is effectiveness in how they utilize it."

          Finding Value Amid the Gloom

          Despite the bearish outlook, some signs of value are emerging. Thai stocks are trading at around 14 times forward earnings, which is below both their five-year average and a gauge of regional peers. The steepening yield curve, with expectations of higher fiscal spending already priced in, may also present opportunities at the long end.

          BlackRock Inc., while holding less exposure than a year ago, has recently begun buying more bonds with longer maturities, according to Navin Saigal, its Asia Pacific head of fundamental fixed income in Singapore.

          The Verdict: A 'Muddle-Through' Scenario

          Ultimately, investors are watching to see if the election will be followed by meaningful reforms or if policy will be watered down by the compromises needed to form a government. The frequent turnover in political leadership is also dimming hopes for lasting change.

          "With no clear majority for any single party in sight, it's hard to envisage a sharp turn in investor confidence," said Wai Kiat Soh, a portfolio manager at Ninety One in Singapore. "The 'muddle-through' scenario will likely play out once again."

          To stay updated on all economic events of today, please check out our Economic calendar
          Risk Warnings and Disclaimers
          You understand and acknowledge that there is a high degree of risk involved in trading. Following any strategies or investment methods may lead to potential losses. The content on the site is provided by our contributors and analysts for information purposes only. You are solely responsible for determining whether any trading assets, securities, strategy, or any other product is suitable for investing based on your own investment objectives and financial situation.
          Add to Favorites
          Share

          Big Oil’s Payout Model Under Strain As Lower Crude Prices Bite

          Gerik

          Economic

          Commodity

          A Tough Earnings Backdrop For European Majors

          European energy giants are bracing for a difficult round of earnings, with market expectations pointing to sharply weaker fourth-quarter results. Companies such as Shell and TotalEnergies are forecast to report their lowest quarterly profits in almost five years, according to analyst consensus compiled by LSEG. This deterioration reflects a prolonged period of softer crude prices, which has eroded cash generation across the sector.
          The pressure is particularly acute in Europe, where oil and gas firms face a combination of cyclical commodity weakness and structural challenges linked to energy transition commitments. Lower earnings are translating into reduced free cash flow, forcing management teams to reassess how capital is allocated between shareholders, core operations, and future investment.

          Why Shareholder Returns Are Now At Risk

          For years, Western oil majors have relied on dividends and share buybacks to maintain investor confidence. In the current environment, however, analysts see these commitments becoming harder to sustain in their existing form. According to S&P Global Energy’s chief energy strategist Atul Arya, European companies are unlikely to cut dividends, which are widely viewed as a cornerstone of capital discipline. Instead, they are more likely to reduce share buybacks and potentially slow capital spending.
          This dynamic highlights a clear hierarchy in payout decisions. Dividends are treated as a long-term signal of financial stability, while buybacks are more flexible and cyclical. The relationship here is one of prioritization rather than direct causation, with weaker oil prices correlating with reduced financial headroom and prompting firms to pull the least reputationally damaging lever first.

          Capital Spending And The Energy Transition Trade-Off

          Any effort to preserve shareholder payouts by cutting costs raises difficult questions about investment priorities. Arya noted that trimming capital programs would most likely affect low-carbon projects rather than traditional oil and gas exploration and development. Reducing spending on core hydrocarbon projects could undermine future production and send negative signals to investors about long-term value creation.
          At the same time, taking on additional debt to fund payouts appears unattractive. Many European energy majors already carry relatively high leverage, limiting their willingness to borrow simply to maintain buybacks. This constraint reinforces the likelihood that shareholder returns will be adjusted downward rather than defended at all costs.

          Europe Versus The United States

          The contrast with US oil majors is striking. Exxon Mobil and Chevron recently reported stronger-than-expected fourth-quarter profits, even as oil prices recorded their steepest annual decline in years due to oversupply. These results have helped ease concerns about the sustainability of shareholder payouts in the US, where balance sheets and asset portfolios appear better positioned to absorb price volatility.
          European firms such as Equinor and BP do not enjoy the same margin of safety. BP has already demonstrated how quickly buybacks can be adjusted, cutting its quarterly share repurchase program to $750 million from $1.75 billion previously after disappointing earnings. TotalEnergies has similarly signaled a willingness to moderate buybacks in response to economic and geopolitical uncertainty.

          Why Buybacks Are The First Lever Pulled

          Market analysts broadly agree that buybacks are the most vulnerable component of shareholder returns. Dividends are often described as “sacrosanct” because they anchor investor expectations and restrain excessive spending. Buybacks, by contrast, are explicitly designed to be opportunistic, expanding during boom periods and contracting when conditions deteriorate.
          A prolonged phase of lower crude prices increases the temptation to scale back repurchases, particularly when management teams are under pressure to protect balance sheets. This reflects a cyclical adjustment rather than a fundamental shift away from shareholder-friendly policies, although the duration of the downturn will determine how deep those adjustments become.

          From Windfall Profits To Capital Restraint

          The current mood marks a sharp reversal from the extraordinary conditions of 2022, when soaring fossil fuel prices following Russia’s invasion of Ukraine delivered nearly $200 billion in combined profits to the world’s five largest oil companies. That windfall enabled generous dividends and aggressive buyback programs, drawing political criticism even as investors were rewarded.
          Today, the industry is operating in a far less forgiving environment. While dividends are likely to be defended, the outlook for buybacks appears fragile. As earnings season unfolds, the key question for investors is not whether payouts will be cut immediately, but how long European oil majors can balance shareholder expectations against weaker prices, high leverage, and competing demands on capital.

          Source: CNBC

          To stay updated on all economic events of today, please check out our Economic calendar
          Risk Warnings and Disclaimers
          You understand and acknowledge that there is a high degree of risk involved in trading. Following any strategies or investment methods may lead to potential losses. The content on the site is provided by our contributors and analysts for information purposes only. You are solely responsible for determining whether any trading assets, securities, strategy, or any other product is suitable for investing based on your own investment objectives and financial situation.
          Add to Favorites
          Share

          China Services Activity Picks Up In January, Hiring Hits 6‑month High, Survey Shows

          Justin

          Economic

          China's services activity expanded at its quickest pace in three months in January, buoyed by stronger new orders and pushing hiring to its highest since July last year, a private-sector survey showed on Wednesday.

          The RatingDog China General Services PMI, compiled by S&P Global, edged up to 52.3 in January from 52.0 the previous month, the highest reading since October. The 50-point mark separates expansion from contraction.

          The reading, coupled with the manufacturing survey, points to a tentative improvement for some businesses at the start of the year. However, they contrast with an official survey which showed both factory and services activity losing momentum. Barclays analysts say recent readings suggest the front-loaded measures may be insufficient, or may still need time to translate into improved sentiment and activity.

          According to the RatingDog survey, the Composite Output Index, which combines manufacturing and services performance, rose to 51.6, compared with 51.3 in December.

          Growth in new orders in the services sector picked up from December. New product launches also lifted export business.

          To cope with rising workload, service providers hired more full-time and temporary staff at the start of the year. Although marginal, the increase marked the first rise in headcount since July 2025.

          Average input costs increased at a slower pace in January, while output charges fell as some service providers lowered prices to support sales.

          Business sentiment remained positive as companies were hopeful that expansion plans and better market conditions would lift growth in sales and activity this year. However, confidence slipped from December and was below the 2025 average, reflecting concerns over the global economic outlook.

          Looking ahead to February, Yao Yu, founder of RatingDog, said consumption-oriented services such as culture and tourism, catering, and instant retail may see growth driven by the extended nine-day Spring Festival holiday. Producer services, by contrast, are likely to enter a seasonal lull due to factory closures.

          According to data by China's Tujia, an online holiday rental portal, booking of homestays grew 48% week-on-week from January, with February 17-19 being the most popular period.

          The Spring Festival holidays, as the new year celebrations are known in China, run from February 15 to 23.

          This year's Lunar New Year travel rush, the world's biggest annual human migration, kicked off on Monday and will last for 40 days.

          Authorities expect a record 9.5 billion passenger trips to be made during the travel period, surpassing the 9.02 billion trips made last year.

          Source: TradingView

          To stay updated on all economic events of today, please check out our Economic calendar
          Risk Warnings and Disclaimers
          You understand and acknowledge that there is a high degree of risk involved in trading. Following any strategies or investment methods may lead to potential losses. The content on the site is provided by our contributors and analysts for information purposes only. You are solely responsible for determining whether any trading assets, securities, strategy, or any other product is suitable for investing based on your own investment objectives and financial situation.
          Add to Favorites
          Share

          Singapore’s High-Tech Answer To A Global Construction Cost Crunch

          Gerik

          Economic

          A Post-Pandemic Construction Surge

          Construction activity in Singapore has accelerated sharply since the pandemic, driven by a wave of large-scale infrastructure and commercial developments. Mega projects such as the new terminal at Changi Airport, an $8 billion Las Vegas Sands expansion, and the Tengah General and Community Hospital are reshaping the city-state’s physical landscape. The hospital alone is expected to add 4,000 patient beds by 2030, underlining the scale and long-term nature of current investment.
          In January, the Building and Construction Authority projected construction demand of up to 53 billion Singapore dollars this year, equivalent to about $42 billion, representing a 15% upward revision from earlier estimates. This surge reflects sustained confidence in public and private sector spending rather than a short-lived rebound.

          Why Costs Remain Among The World’s Highest

          While the boom supports economic growth, it has intensified cost pressures in an already expensive market. Construction consultancy Turner and Townsend estimates that building costs could rise by as much as 5% this year. This increase is associated with ongoing supply chain disruptions affecting materials such as cement and ready-mixed concrete, extended lead times for plumbing and electrical systems, and sharply higher prices for semiconductors embedded in modern building infrastructure.
          Labor constraints add another layer of complexity. Beyond shortages of general workers, Singapore faces a particularly tight market for professionals, managers, executives, and technicians. These capability gaps tend to affect project timelines and quality, especially for specialist subcontractors on large developments. The pressure on skilled labor is correlated with rising costs and delivery risk, rather than being the sole cause of delays, but it remains a persistent structural challenge.

          Redesigning The Workforce Model

          To cope with labor shortages, firms are rethinking how human capital is deployed. One emerging response is “double hatting,” where employees are trained to take on multiple roles. Engineers, for example, are increasingly expected to operate digital tools that reduce repetitive tasks, allowing them to focus on higher-value execution and coordination work.
          This approach enables companies to deliver projects with smaller teams while maintaining output levels. Analysts expect strong contract awards to continue through 2026, followed by four years of elevated construction activity, suggesting that workforce flexibility will remain central to sustaining the upcycle.

          Technology As A Cost-Control Lever

          Technology adoption has become a defining feature of Singapore’s construction response. Contractors are shifting away from labor-intensive building toward high-specification industrial and infrastructure projects, supported by prefabrication and enterprise-level digital systems. These changes aim to improve cost efficiency and reduce dependence on scarce labor.
          Robots and drones are playing an expanding role. Some firms already use drones combined with artificial intelligence to inspect building facades, while new models are being developed to wash and paint exteriors, cutting the need for scaffolding and reducing safety risks. Painting robots offer a stark productivity comparison, with one machine capable of covering up to 1,500 square meters per day, compared with around 200 square meters for a human worker.
          Although such equipment can cost between $70,000 and $120,000 per unit, the investment is expected to improve margins over time. From April, the Building and Construction Authority will introduce new grants for smaller firms to invest in automation and robotics, targeting manpower savings of up to 50%. These measures are designed to address efficiency challenges rather than directly suppress costs, yet they influence long-term competitiveness.

          A Prolonged Upcycle, Not A Peak

          Despite the scale of current projects, industry analysts believe Singapore’s construction cycle has not yet reached its peak. Estimates now suggest contractor earnings will crest in the 2028 to 2029 financial years, later than previously forecast. Earnings per share growth across covered firms is projected to range between 16% and 41% from 2026 to 2028, reflecting sustained demand and operational leverage from technology adoption.
          Looking further ahead, Singapore’s master plan over the next 10 to 15 years includes new parks, residential developments, and subway lines. With land scarcity intensifying planning trade-offs, decisions about what to build and what to preserve are becoming more complex, reinforcing the need for precision and efficiency rather than expansion alone.

          Building Beyond Economics

          Rising construction costs inevitably feed into a higher cost of living, particularly in private housing, which has become increasingly expensive. Yet Singapore’s infrastructure projects are often delivered on time and within budget, a result of long-term planning focused on functional needs rather than short-term political cycles.
          Increasingly, construction is seen as a tool for shaping urban quality rather than simply adding capacity. New developments emphasize integration with surrounding neighborhoods, environmental features such as rainwater harvesting, and broader goals of livability. This approach reflects a strategic evolution from building for growth to designing for resilience, positioning Singapore as a case study in how technology and governance can partially offset the pressures of one of the world’s costliest construction environments.

          Source: CNBC

          To stay updated on all economic events of today, please check out our Economic calendar
          Risk Warnings and Disclaimers
          You understand and acknowledge that there is a high degree of risk involved in trading. Following any strategies or investment methods may lead to potential losses. The content on the site is provided by our contributors and analysts for information purposes only. You are solely responsible for determining whether any trading assets, securities, strategy, or any other product is suitable for investing based on your own investment objectives and financial situation.
          Add to Favorites
          Share

          U.S. Government Shutdown Ends; Bank of Japan Sells ETFs, Signaling Exit

          FastBull Featured

          Daily News

          [Quick Facts]

          1. Iran's Foreign Ministry says it is consulting on a venue for Talks with the U.S.
          2. The meeting between the Israeli PM and the U.S. Envoy lasted over three hours to discuss the Iran issue.
          3. Trump signs Appropriations Bill, ending partial U.S. government shutdown.
          4. Bank of Japan starts selling ETFs.
          5. Barkin: The Fed focuses on returning inflation to the target level.

          [News Details]

          Iran's Foreign Ministry says it is consulting on a venue for Talks with the U.S.
          On February 3rd, local time, Iranian Foreign Ministry spokesperson Baghaei commented on the coordination process for potential talks between Iran and the United States, stating that a negotiation plan has been formulated and talks are expected in the coming days. Consultations are underway to determine the venue, which will be announced immediately once finalized.
          Baghaei said that, in principle, the location and timing of the talks are not complex issues; Turkey, Oman, and several other countries in the region have expressed willingness to host the talks, which Iran finds very valuable.
          The meeting between the Israeli PM and the U.S. Envoy lasted over three hours to discuss the Iran issue
          On February 3rd, local time, Israeli Prime Minister Benjamin Netanyahu met with visiting U.S. Special Envoy for Middle East Affairs Steve Witkoff. The meeting lasted more than three hours. Also present were U.S. Ambassador to Israel Mike Huckabee, Israeli Defense Minister Yoav Katz, IDF Chief of Staff Herzi Halevi, Mossad Director David Barnea, the head of Israeli Military Intelligence, Air Force Commander, and others. A statement from the Israeli Prime Minister's Office said Netanyahu told the U.S. side during the meeting that Iran has repeatedly proven itself untrustworthy and incapable of honoring any commitments.
          Trump signs Appropriations Bill, ending partial U.S. government shutdown
          On February 3rd, local time, U.S. President Donald Trump formally signed the government funding bill in the Oval Office, ending the partial federal government shutdown that began on January 31st. The resolution came after the House of Representatives earlier voted to pass an appropriations bill funding several federal departments. The bill provides budgets for these departments through September 30th (the end of the current fiscal year), and also grants the Department of Homeland Security — recently embroiled in controversy over immigration enforcement actions — a two‑week temporary funding extension, allowing Congress to continue negotiating improvements to the department's operations.
          Bank of Japan starts selling ETFs
          Kyodo News reported that data released by the Bank of Japan on February 3rd, showing its balance sheet as of January 31st, indicates the central bank has begun selling exchangetraded funds (ETFs). The sale amounted to about ¥5.37 billion in book value, and the Bank also sold approximately ¥100 million in real estate investment trusts (REITs).
          The Bank of Japan had previously acquired large amounts of ETFs under its massive monetary easing program and currently holds around ¥37 trillion in ETFs. To avoid a sharp drop in stock prices, it will adopt a strategy of selling in small tranches to gradually exit from monetary easing.
          At its monetary policy meeting last September, the Bank decided to sell ETFs at an annual pace of about ¥330 billion. Governor Kazuo Ueda has said that, if calculated simply, it would take more than 100 years to complete the sales.
          Barkin: The Fed focuses on returning inflation to the target level
          Richmond Fed President Thomas Barkin said in a speech on Tuesday that last year's interest rate cuts by the Federal Reserve stimulated the labor market, and officials are now focused on bringing inflation back to the central bank's target level. He believed that in the effort to complete the final mile toward our inflation goal, those rate cuts served as insurance to support the labor market.
          As uncertainties fade, the economic outlook is improving, but risks remain because hiring is concentrated in a few industries and inflation remains above the Fed's 2% target.
          Although overall demand in the U.S. economy has proven resilient, this is largely due to the construction of AI infrastructure and spending by wealthy consumers. If the AI sector cools, it could hit business investment and the stock market, and when wealthy households see their net worth decline, their consumption may weaken.

          [Today's Focus]

          UTC+8 18:00 Eurozone January HICP
          UTC+8 21:15 U.S. January ADP Employment Change
          UTC+8 23:00 U.S. January ISM Non-Manufacturing PMI
          Risk Warnings and Disclaimers
          You understand and acknowledge that there is a high degree of risk involved in trading. Following any strategies or investment methods may lead to potential losses. The content on the site is provided by our contributors and analysts for information purposes only. You are solely responsible for determining whether any trading assets, securities, strategy, or any other product is suitable for investing based on your own investment objectives and financial situation.
          Add to Favorites
          Share

          China’s Bid To Weaken Dollar Dominance Faces Structural Limits

          Gerik

          Economic

          Forex

          A Window Created By Dollar Volatility

          China is attempting to capitalize on a rare moment of vulnerability in the global monetary system. Heightened geopolitical uncertainty linked to the economic policies of Donald Trump has unsettled markets, pushing the US dollar to four-year lows while driving investors toward traditional safe havens. Gold prices have surged to record highs above $5,500 an ounce, reflecting a broad reassessment of risk rather than a sudden loss of faith in the dollar itself. This environment has nevertheless created space for China to argue that reliance on a single dominant currency exposes the world to political and financial shocks.
          Against this backdrop, China’s Communist Party journal Qiushi released previously private remarks by Xi Jinping, outlining ambitions for the renminbi to evolve into a currency widely used in international trade, foreign exchange, and global pricing. While no immediate shift in the monetary order is expected, the sharp decline in the dollar since Trump’s return to office has altered perceptions about whether alternatives can gain incremental ground.

          Why Reserve Currency Status Matters

          The dollar’s dominance has shaped the global economy since World War II and the Bretton Woods system, granting the United States enduring advantages in borrowing costs, financial influence, and sanctions power. Today, the International Monetary Fund recognizes several reserve currencies beyond the dollar, including the euro, yen, pound sterling, and the renminbi, yet their roles are not equal. According to IMF data, the dollar still accounted for roughly 57 percent of global foreign exchange reserves last year, compared with about 20 percent for the euro and only around 2 percent for the renminbi.
          For Beijing, expanding the renminbi’s role is less about outright replacement and more about reducing exposure to US financial pressure while increasing strategic autonomy. This reflects a correlation between geopolitical tension and currency diversification rather than a direct causal shift away from the dollar driven by market fundamentals alone.

          Policy Moves To Elevate The Renminbi

          China has spent more than a decade laying the groundwork for broader renminbi use. Authorities have expanded foreign access to domestic stocks, bonds, and commodity markets, streamlined cross-border payment systems, and encouraged settlement of trade in renminbi rather than dollars. These efforts gained momentum after Western sanctions on Russia following the invasion of Ukraine, as China remained a key trading partner and renminbi-denominated transactions surged to record levels.
          Officials at the People's Bank of China have framed this strategy as part of a transition toward a multipolar currency system. Last summer, central bank governor Pan Gongsheng stated that the renminbi had become the world’s largest trade finance currency and the third-largest payment currency. This growth reflects practical usage in trade corridors linked to China rather than a wholesale shift in global reserve preferences.

          Global Reactions And Strategic Hedging

          Concerns over US trade policy and sanctions have encouraged some countries to reduce reliance on the dollar at the margin. European Central Bank President Christine Lagarde has argued for a stronger international role for the euro, while emerging economies increasingly view currency diversification as a form of risk management. Within the BRICS grouping, discussions about alternative reserve arrangements have further unsettled Washington, prompting Trump to warn of punitive tariffs should such initiatives materialize.
          These developments illustrate a growing desire among states to hedge rather than abandon the dollar. The behavior is driven by correlation between political risk and diversification strategies, not by a clear causal loss of confidence in the dollar’s underlying liquidity and institutional support.

          Why The Dollar Remains Hard To Displace

          Despite Beijing’s ambitions, major obstacles limit how far the renminbi can advance. Capital controls remain a central constraint, restricting the free movement of money into and out of China and discouraging global investors from holding large renminbi reserves. Financial institutions also remain wary of regulatory opacity and political intervention, factors that contrast sharply with the transparency and depth of US financial markets.
          China’s own economic priorities further complicate the picture. Maintaining a relatively weaker currency supports export competitiveness, creating tension between domestic policy goals and the requirements of a widely trusted reserve asset. These structural realities suggest that while the renminbi’s international role can expand, it is unlikely to approach the scale of the dollar or even the euro in the foreseeable future.

          An Incremental Shift Rather Than A Revolution

          China’s strategy reflects a calculated assessment of global trends rather than an expectation of imminent dominance. The weakening dollar and rising geopolitical fragmentation offer an opportunity to gain incremental influence, particularly in trade finance and bilateral settlements. However, the foundations of dollar dominance remain intact, supported by deep capital markets, institutional credibility, and network effects that cannot be replicated quickly.
          In this sense, Beijing’s push is best understood as an effort to narrow the gap rather than overturn the system. The global financial order may become more diversified over time, but the renminbi’s rise is likely to be gradual, constrained, and complementary rather than transformational.

          Source: CNN

          To stay updated on all economic events of today, please check out our Economic calendar
          Risk Warnings and Disclaimers
          You understand and acknowledge that there is a high degree of risk involved in trading. Following any strategies or investment methods may lead to potential losses. The content on the site is provided by our contributors and analysts for information purposes only. You are solely responsible for determining whether any trading assets, securities, strategy, or any other product is suitable for investing based on your own investment objectives and financial situation.
          Add to Favorites
          Share

          Miran’s Exit From the White House Signals Deeper Shifts Inside the Federal Reserve

          Gerik

          Economic

          A Controversial Dual Role Comes To An End

          Stephen Miran has stepped down as chair of the White House’s Council of Economic Advisers, ending an unusual period in which he simultaneously held a senior White House position and served as a governor at the Federal Reserve. The resignation was confirmed late Tuesday by White House spokesperson Kush Desai and follows a commitment Miran made during his Senate confirmation process. His decision aligns with long-standing norms designed to preserve the Fed’s independence from direct political influence, even though no formal rule explicitly barred his dual role.
          Miran was appointed to the Fed’s seven-member Board of Governors by Donald Trump in September, after Adriana Kugler resigned unexpectedly. He completed Kugler’s term, which officially ended on January 31, but under existing rules, he is permitted to remain on the board until a successor is confirmed by the Senate. While previous administrations have appointed White House aides to the Fed, it has been customary for those individuals to fully relinquish executive branch roles before assuming monetary policymaking responsibilities. Miran instead took an unpaid leave, a choice that drew criticism and intensified scrutiny.

          Implications For Monetary Policy Governance

          The episode matters because Fed governors play a direct role in interest rate decisions and bank regulatory policy, areas where institutional independence is closely guarded. Miran had stated when appointed that he would resign from the Council of Economic Advisers if he stayed on the Fed board beyond January 31, and his resignation fulfills that pledge. The situation illustrates the delicate balance between political appointment power and the expectation of nonpartisan economic governance, highlighting how even temporary overlaps can raise concerns about perceived influence rather than direct causation over policy outcomes.
          Miran’s departure also adds momentum to speculation surrounding upcoming changes at the top of the Fed. Trump has nominated Kevin Warsh to replace current Fed chair Jerome Powell, whose term as chair expires on May 15. Due to a structural quirk, Powell could remain on the Fed’s board even after stepping down as chair, limiting Trump’s ability to immediately appoint an additional governor. As a result, many analysts expect a sequence in which Warsh first fills Miran’s seat and is then elevated to chair in May, although this pathway has not yet been officially confirmed.
          While Miran’s resignation does not directly alter monetary policy in the short term, it reinforces the sensitivity surrounding Fed governance at a moment of leadership transition. The situation reflects correlation rather than direct policy causation between political maneuvering and central bank decisions, yet it underscores how personnel shifts can shape expectations in financial markets. As confirmation battles and succession plans unfold, attention is likely to remain focused on whether the Fed’s institutional independence is preserved in both form and practice.

          Source: AP

          To stay updated on all economic events of today, please check out our Economic calendar
          Risk Warnings and Disclaimers
          You understand and acknowledge that there is a high degree of risk involved in trading. Following any strategies or investment methods may lead to potential losses. The content on the site is provided by our contributors and analysts for information purposes only. You are solely responsible for determining whether any trading assets, securities, strategy, or any other product is suitable for investing based on your own investment objectives and financial situation.
          Add to Favorites
          Share
          FastBull
          Copyright © 2026 FastBull Ltd

          728 RM B 7/F GEE LOK IND BLDG NO 34 HUNG TO RD KWUN TONG KLN HONG KONG

          TelegramInstagramTwitterfacebooklinkedin
          App Store Google Play Google Play
          Products
          Charts

          Chats

          Q&A with Experts
          Screeners
          Economic Calendar
          Data
          Tools
          Membership
          Features
          Function
          Markets
          Copy Trading
          Latest Signals
          Contests
          News
          Analysis
          24/7
          Columns
          Education
          Company
          Careers
          About Us
          Contact Us
          Advertising
          Help Center
          Feedback
          User Agreement
          Privacy Policy
          Personal Information Protection Statement
          Business

          White Label

          Broker API

          Data API

          Web Plug-ins

          Poster Maker

          Affiliate Program

          Risk Disclosure

          The risk of loss in trading financial instruments such as stocks, FX, commodities, futures, bonds, ETFs and crypto can be substantial. You may sustain a total loss of the funds that you deposit with your broker. Therefore, you should carefully consider whether such trading is suitable for you in light of your circumstances and financial resources.

          No decision to invest should be made without thoroughly conducting due diligence by yourself or consulting with your financial advisors. Our web content might not suit you since we don't know your financial conditions and investment needs. Our financial information might have latency or contain inaccuracy, so you should be fully responsible for any of your trading and investment decisions. The company will not be responsible for your capital loss.

          Without getting permission from the website, you are not allowed to copy the website's graphics, texts, or trademarks. Intellectual property rights in the content or data incorporated into this website belong to its providers and exchange merchants.

          Not Logged In

          Log in to access more features

          Connect Broker
          Become a signal provider
          Help Center
          Customer Service
          Dark Mode
          Price Up/Down Colors

          Log In

          Sign Up

          Position
          Layout
          Fullscreen
          Default to Chart
          The chart page opens by default when you visit fastbull.com