Markets
News
Analysis
User
24/7
Economic Calendar
Education
Data
- Names
- Latest
- Prev


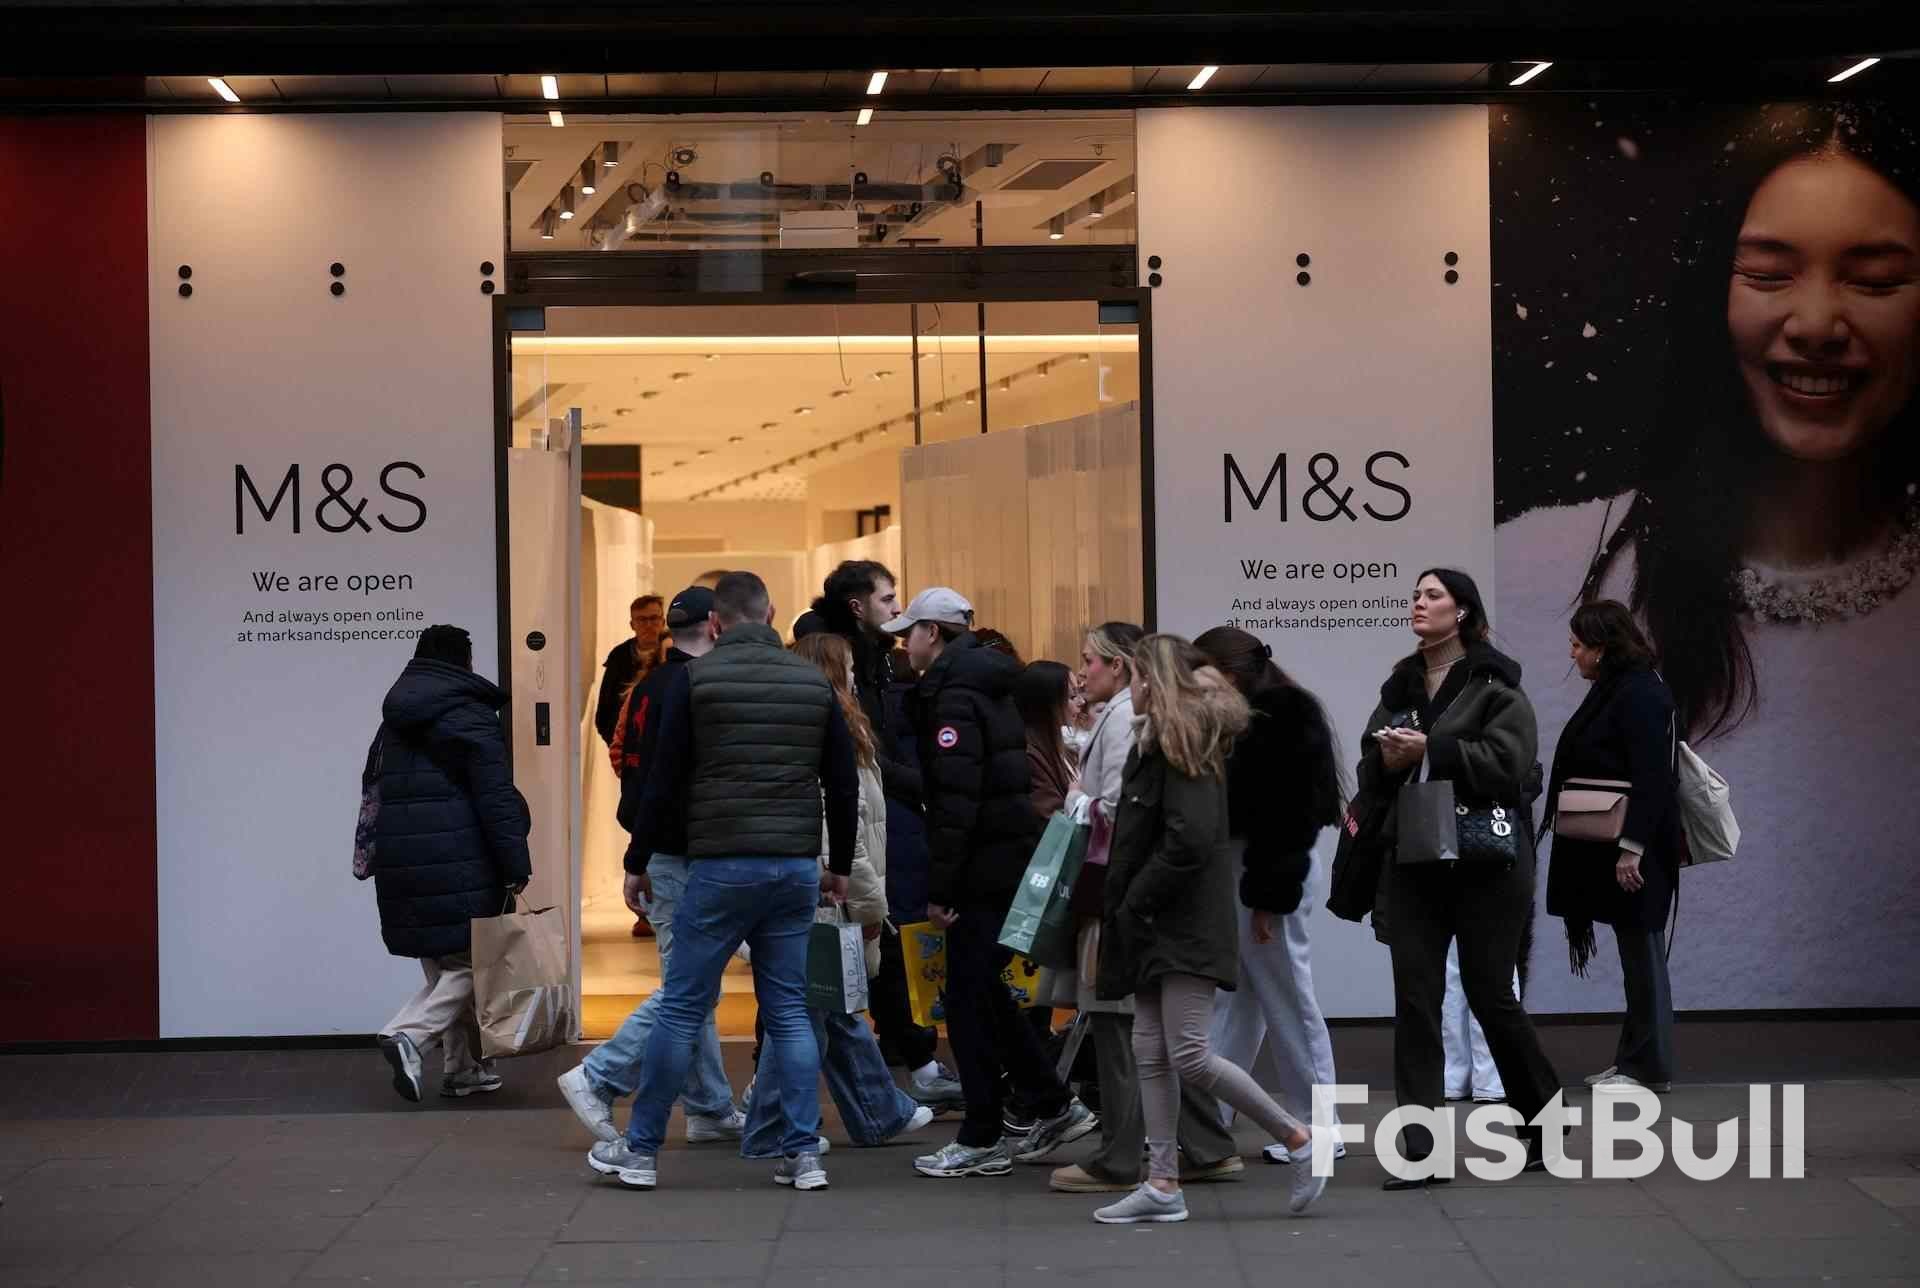
British retail sales rose unexpectedly last month, helped by strong online shopping, according to data published on Friday which added to signs of a pickup in the economy after finance minister Rachel Reeves' budget.
British retail sales rose unexpectedly last month, helped by strong online shopping, according to data published on Friday which added to signs of a pickup in the economy after finance minister Rachel Reeves' budget.
Sales volumes rose by 0.4% in December from November, the Office for National Statistics said. This was the first increase since September and marked a brighter end to an otherwise drab final quarter for shops.
Economists polled by Reuters had expected sales to fall by 0.1% in month-on-month terms.
Earlier, market research firm GfK said consumer confidence rose to its highest level since August 2024 as households became more positive about their own finances.
Friday's data added to tentatively positive readings for economic activity for Reeves after her tax-raising November budget, despite more signs of cooling in the labour market and still-high inflation.
"The budget was tough, but people's worst fears weren't met," said Neil Birrell, chief investment officer at Premier Miton, a wealth management company.
"This does suggest the UK consumer is in better shape than expected, and if that follows through in the wider economy, maybe there is room for a bit more optimism for the UK."
For the fourth quarter as a whole, retail sales fell by 0.3%, reflecting declines in November and October, which the ONS said would exert a 0.01 percentage-point drag on overall economic output.
Thomas Pugh, chief economist at RSM UK, said the outlook for spending hinged on whether consumers stuck to their high levels of savings or used them to boost spending, and on the possibility of fresh political turmoil with Prime Minister Keir Starmer under pressure ahead of local elections in May.
"A disruptive leadership contest, which opens the door to another round of tax increases, is a significant downside risk to confidence continuing to recover," Pugh said.
The ONS said online jewellers saw renewed demand for precious metals in December - against a backdrop of rising gold prices.
Compared with December a year ago, overall retail sales volumes were 2.5% higher, marking the strongest such reading since April.
Still, sales volumes remained 2.2% lower last month than their level six years ago, before the COVID-19 pandemic.
Major British retailers were generally cautious about 2026 prospects in their post-Christmas trading updates.
728 RM B 7/F GEE LOK IND BLDG NO 34 HUNG TO RD KWUN TONG KLN HONG KONG


The risk of loss in trading financial instruments such as stocks, FX, commodities, futures, bonds, ETFs and crypto can be substantial. You may sustain a total loss of the funds that you deposit with your broker. Therefore, you should carefully consider whether such trading is suitable for you in light of your circumstances and financial resources.
No decision to invest should be made without thoroughly conducting due diligence by yourself or consulting with your financial advisors. Our web content might not suit you since we don't know your financial conditions and investment needs. Our financial information might have latency or contain inaccuracy, so you should be fully responsible for any of your trading and investment decisions. The company will not be responsible for your capital loss.
Without getting permission from the website, you are not allowed to copy the website's graphics, texts, or trademarks. Intellectual property rights in the content or data incorporated into this website belong to its providers and exchange merchants.
Not Logged In
Log in to access more features

FastBull Membership
Not yet
Purchase


Log In
Sign Up