• Trade
  • Markets
  • Copy
  • Contests
  • News
  • 24/7
  • Calendar
  • Q&A
  • Chats
Screeners
SYMBOL
LAST
ASK
BID
HIGH
LOW
NET CHG.
%CHG.
SPREAD
SPX
S&P 500 Index
6882.71
6882.71
6882.71
6936.08
6838.79
-35.10
-0.51%
--
DJI
Dow Jones Industrial Average
49501.29
49501.29
49501.29
49649.86
49112.43
+260.29
+ 0.53%
--
IXIC
NASDAQ Composite Index
22904.57
22904.57
22904.57
23270.07
22684.51
-350.61
-1.51%
--
USDX
US Dollar Index
97.640
97.720
97.640
97.750
97.470
+0.160
+ 0.16%
--
EURUSD
Euro / US Dollar
1.17940
1.17947
1.17940
1.18086
1.17800
-0.00105
-0.09%
--
GBPUSD
Pound Sterling / US Dollar
1.35700
1.35708
1.35700
1.36537
1.35398
-0.00819
-0.60%
--
XAUUSD
Gold / US Dollar
4855.36
4855.77
4855.36
5023.58
4788.42
-110.20
-2.22%
--
WTI
Light Sweet Crude Oil
63.551
63.581
63.551
64.398
63.245
-0.691
-1.08%
--

Community Accounts

Signal Accounts
--
Profit Accounts
--
Loss Accounts
--
View More

Become a signal provider

Sell trading signals to earn additional income

View More

Guide to Copy Trading

Get started with ease and confidence

View More

Signal Accounts for Members

All Signal Accounts

Best Return
  • Best Return
  • Best P/L
  • Best MDD
Past 1W
  • Past 1W
  • Past 1M
  • Past 1Y

All Contests

  • All
  • Trump Updates
  • Recommend
  • Stocks
  • Cryptocurrencies
  • Central Banks
  • Featured News
Top News Only
Share

BOE Governor Bailey: On Peter Mandelson Affair, Says I Am Shocked By What We Are Hearing

Share

Indonesia Central Bank Says Moody's Outlook Cut Doesn't Mean Economic Fundamentals Weakening

Share

BOE Governor Bailey: Falling Inflation Should Feed Into Expectations, That Should Give Me Confidence

Share

Indonesia Central Bank: To Work With Government To Strengthen Communication With Markets, Maintain Market Confidence

Share

Indonesia Central Bank: Financial Market Stability Is Also Expected To Remain Stable, Supported By Adequate Liquidity, Strong Banking Capital, Low Credit Risk

Share

US News Website Axios Reports That The United States And Russia Are Close To Reaching An Agreement To Continue To Abide By The New START Treaty After It Expires On Thursday

Share

Indonesia Central Bank: Rupiah Exchange Rate Is Expected To Remain Stable, Supported By Economic Prospects, Central Bank Stabilisation Commitment

Share

BOE Governor Bailey: We Have To Be Very Focused On Underlying Story On Inflation

Share

BOE Governor Bailey: We Need To See More Evidence That We Are Going To Get Sustainable Return To Inflation Target

Share

Indonesia Central Bank: Expects Indonesian Economic Prospects To Remain Solid With Improving Trend, Inflation Under Control

Share

The US News Website Axios Reports That The US And Russia Are Negotiating An Extension Of The New START Treaty

Share

Thomson Reuters: Continue To Assess Acquisition Candidates

Share

Bank Of England Governor Bailey: If The Outlook Develops As We Expect, There Is Still Room For Further Easing In The Near Future

Share

BOE Governor Bailey: For Every Rate Cut, How Much Further To Go Becomes Closer Call

Share

Bank Of England Governor Bailey: More Spare Capacity Could Lead To Inflation Falling Below Target

Share

Bank Of England Governor Bailey: Risk Consumption Will Be Slower Than We Expected

Share

BOE Governor Bailey: On Other Hand, Waiting Too Long Could Cause Sharper Downturn In Activity

Share

BOE Governor Bailey: On One Hand, Cutting Bank Rate Too Quickly Or Too Much Could Lead To Inflation Pressure Persisting

Share

Bank Of England Governor Bailey: Institutions Expect Growth To Remain Sluggish Throughout The Year

Share

Bank Of England Governor Bailey: Official Data Shows A Slight Increase In The Layoff Rate

TIME
ACT
FCST
PREV
U.S. ISM Non-Manufacturing Inventories Index (Jan)

A:--

F: --

P: --

U.S. EIA Weekly Crude Oil Imports Changes

A:--

F: --

P: --

U.S. EIA Weekly Heating Oil Stock Changes

A:--

F: --

P: --

U.S. EIA Weekly Crude Demand Projected by Production

A:--

F: --

P: --

U.S. EIA Weekly Gasoline Stocks Change

A:--

F: --

P: --

U.S. EIA Weekly Crude Stocks Change

A:--

F: --

P: --

U.S. EIA Weekly Cushing, Oklahoma Crude Oil Stocks Change

A:--

F: --

P: --

Australia Trade Balance (SA) (Dec)

A:--

F: --

P: --
Australia Exports MoM (SA) (Dec)

A:--

F: --

P: --
Japan 30-Year JGB Auction Yield

A:--

F: --

P: --

Indonesia Annual GDP Growth

A:--

F: --

P: --

Indonesia GDP YoY (Q4)

A:--

F: --

P: --

France Industrial Output MoM (SA) (Dec)

A:--

F: --

P: --
Italy IHS Markit Construction PMI (Jan)

A:--

F: --

P: --

Euro Zone IHS Markit Construction PMI (Jan)

A:--

F: --

P: --

Germany Construction PMI (SA) (Jan)

A:--

F: --

P: --

Italy Retail Sales MoM (SA) (Dec)

A:--

F: --

P: --

U.K. Markit/CIPS Construction PMI (Jan)

A:--

F: --

P: --

France 10-Year OAT Auction Avg. Yield

A:--

F: --

P: --

Euro Zone Retail Sales YoY (Dec)

A:--

F: --

P: --
Euro Zone Retail Sales MoM (Dec)

A:--

F: --

P: --
U.K. BOE MPC Vote Cut (Feb)

A:--

F: --

P: --

U.K. BOE MPC Vote Hike (Feb)

A:--

F: --

P: --

U.K. BOE MPC Vote Unchanged (Feb)

A:--

F: --

P: --

U.K. Benchmark Interest Rate

A:--

F: --

P: --

MPC Rate Statement
U.S. Challenger Job Cuts (Jan)

A:--

F: --

P: --

U.S. Challenger Job Cuts MoM (Jan)

A:--

F: --

P: --

U.S. Challenger Job Cuts YoY (Jan)

A:--

F: --

P: --

Bank of England Governor Bailey held a press conference on monetary policy.
Euro Zone ECB Marginal Lending Rate

--

F: --

P: --

Euro Zone ECB Deposit Rate

--

F: --

P: --

Euro Zone ECB Main Refinancing Rate

--

F: --

P: --

ECB Monetary Policy Statement
U.S. Weekly Initial Jobless Claims (SA)

--

F: --

P: --

U.S. Initial Jobless Claims 4-Week Avg. (SA)

--

F: --

P: --

U.S. Weekly Continued Jobless Claims (SA)

--

F: --

P: --

ECB Press Conference
U.S. JOLTS Job Openings (SA) (Dec)

--

F: --

P: --

U.S. EIA Weekly Natural Gas Stocks Change

--

F: --

P: --

BOC Gov Macklem Speaks
Mexico Policy Interest Rate

--

F: --

P: --

U.S. Weekly Treasuries Held by Foreign Central Banks

--

F: --

P: --

Reserve Bank of Australia Governor Bullock testified before Parliament.
India Benchmark Interest Rate

--

F: --

P: --

India Cash Reserve Ratio

--

F: --

P: --

India Repo Rate

--

F: --

P: --

India Reverse Repo Rate

--

F: --

P: --

Japan Leading Indicators Prelim (Dec)

--

F: --

P: --

Germany Industrial Output MoM (SA) (Dec)

--

F: --

P: --

Germany Exports MoM (SA) (Dec)

--

F: --

P: --

U.K. Halifax House Price Index YoY (SA) (Jan)

--

F: --

P: --

U.K. Halifax House Price Index MoM (SA) (Jan)

--

F: --

P: --

France Trade Balance (SA) (Dec)

--

F: --

P: --

Canada Leading Index MoM (Jan)

--

F: --

P: --

India Deposit Gowth YoY

--

F: --

P: --

Canada Employment (SA) (Jan)

--

F: --

P: --
Canada Full-time Employment (SA) (Jan)

--

F: --

P: --
Canada Part-Time Employment (SA) (Jan)

--

F: --

P: --
Canada Unemployment Rate (SA) (Jan)

--

F: --

P: --

Canada Labor Force Participation Rate (SA) (Jan)

--

F: --

P: --

Q&A with Experts
    • All
    • Chatrooms
    • Groups
    • Friends
    EuroTrader flag
    3548582
    im kinda new on the stock market
    @3548582you are welcome on board, what they mostly do here is talk about the markets and share trading kowledge with each other
    EuroTrader flag
    3548582
    guys what do i do here
    @3548582Do you trade the currency markets or you work on just the stock markets alone my friend
    3548582 flag
    idk i rlly jst started
    3548582 flag
    im checking eurusd
    3548582 flag
    and idrk abt that much
    EuroTrader flag
    3548582
    im checking eurusd
    @3548582okay, thats a good pair to start with, its not very volatile and pretty stable to trade as a beginner
    EuroTrader flag
    3548582
    im checking eurusd
    @3548582Have you learnt technical and fundamantal analysis or price action you make use of in analysing the markets
    3548490 flag
    Sanjeev Ku
    So you haven't seen the whole news report from the past few days, which is about margin trading on exchanges, including the US, China, and India.
    4RZD3WD38X flag
    @Sanjeev Kuwhat level I'd safe to sell on gold it's not moving towards 4935
    4RZD3WD38X flag
    @EuroTraderwhat level are you shorting on gold buddy?
    favour flag
    EuroTrader
    @EuroTraderyeah man and it's likely to repeat itself but on a different pair this time
    EuroTrader flag
    4RZD3WD38X
    @EuroTraderwhat level are you shorting on gold buddy?
    @4RZD3WD38Xi dont have a running sell trade on gold at the moment. still waiting for some further confirmation s
    3426137 flag
    Be patient, friend.
    EuroTrader flag
    favour
    @favourwhat pair is that, can you actually share with me, lets look at it together brotherly
    favour flag
    favour
    @EuroTraderhow's the trade on gold going man
    Sanjeev Ku flag
    Sanjeev Ku
    69629 done now 69335.if 68690 breaks 65676
    favour flag
    EuroTrader
    @EuroTradergold
    favour flag
    favour flag
    EuroTrader flag
    favour
    @favourclosed already on that retracement and i would have to wait for the start of the new york session
    Type here...
    Add Symbol or Code

      No matching data

      All
      Trump Updates
      Recommend
      Stocks
      Cryptocurrencies
      Central Banks
      Featured News
      • All
      • Russia-Ukraine Conflict
      • Middle East Flashpoint
      • All
      • Russia-Ukraine Conflict
      • Middle East Flashpoint
      Search
      Products

      Charts Free Forever

      Chats Q&A with Experts
      Screeners Economic Calendar Data Tools
      Membership Features
      Data Warehouse Market Trends Institutional Data Policy Rates Macro

      Market Trends

      Market Sentiment Order Book Forex Correlations

      Top Indicators

      Charts Free Forever
      Markets

      News

      News Analysis 24/7 Columns Education
      From Institutions From Analysts
      Topics Columnists

      Latest Views

      Latest Views

      Trending Topics

      Top Columnists

      Latest Update

      Signals

      Copy Rankings Latest Signals Become a signal provider AI Rating
      Contests
      Brokers

      Overview Brokers Assessment Rankings Regulators News Claims
      Broker listing Forex Brokers Comparison Tool Live Spread Comparison Scam
      Q&A Complaint Scam Alert Videos Tips to Detect Scam
      More

      Business
      Events
      Careers About Us Advertising Help Center

      White Label

      Broker API

      Data API

      Web Plug-ins

      Affiliate Program

      Awards Institution Evaluation IB Seminar Salon Event Exhibition
      Vietnam Thailand Singapore Dubai
      Fans Party Investment Sharing Session
      FastBull Summit BrokersView Expo
      Recent Searches
        Top Searches
          Markets
          News
          Analysis
          User
          24/7
          Economic Calendar
          Education
          Data
          • Names
          • Latest
          • Prev

          View All

          No data

          Scan to Download

          Faster Charts, Chat Faster!

          Download App
          English
          • English
          • Español
          • العربية
          • Bahasa Indonesia
          • Bahasa Melayu
          • Tiếng Việt
          • ภาษาไทย
          • Français
          • Italiano
          • Türkçe
          • Русский язык
          • 简中
          • 繁中
          Open Account
          Search
          Products
          Charts Free Forever
          Markets
          News
          Signals

          Copy Rankings Latest Signals Become a signal provider AI Rating
          Contests
          Brokers

          Overview Brokers Assessment Rankings Regulators News Claims
          Broker listing Forex Brokers Comparison Tool Live Spread Comparison Scam
          Q&A Complaint Scam Alert Videos Tips to Detect Scam
          More

          Business
          Events
          Careers About Us Advertising Help Center

          White Label

          Broker API

          Data API

          Web Plug-ins

          Affiliate Program

          Awards Institution Evaluation IB Seminar Salon Event Exhibition
          Vietnam Thailand Singapore Dubai
          Fans Party Investment Sharing Session
          FastBull Summit BrokersView Expo

          Starmer's Political Crisis Sinks Pound and Gilts

          Hannah Ellis

          Traders' Opinions

          Central Bank

          Political

          Bond

          Data Interpretation

          Daily News

          Forex

          Economic

          Summary:

          Political instability over PM Starmer's leadership rattles UK markets, causing bond yields to surge and the pound to fall.

          Political turbulence is rattling UK markets, with fresh doubts over Prime Minister Keir Starmer’s leadership sending the pound and long-term government bonds tumbling on Thursday.

          Investors are increasingly pricing in a political risk premium as Starmer faces mounting pressure over his decision to appoint Peter Mandelson as US ambassador, despite his known connection to the disgraced financier Jeffrey Epstein. The market fallout signals growing concern that the Prime Minister’s grasp on power is weakening.

          UK Yield Curve Steepens as Pound Falters

          The market reaction was swift and clear. Sterling dropped as much as 0.4% to a near two-week low of US$1.36, making it the worst-performing currency among its peers.

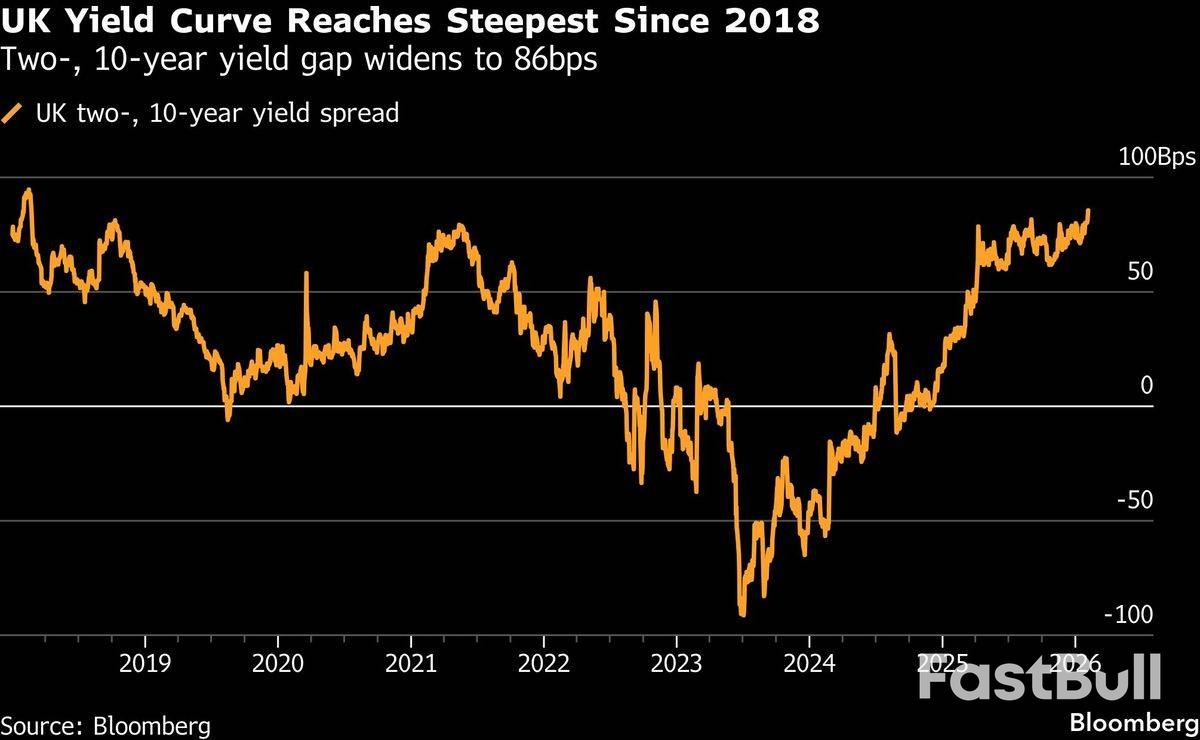
          In the bond market, the yield on 10-year government bonds, or gilts, climbed by four basis points to 4.59%. Because shorter-term rates remained relatively stable, the gap between the two-year and 10-year gilt yields widened to 86 basis points—its most substantial spread since 2018.

          Figure 1: The spread between UK 2-year and 10-year gilt yields surged to 86 basis points, its highest level since 2018, as political uncertainty spooked investors in long-term debt.

          "It's worth keeping a closer eye on the UK with PM Starmer under considerable domestic pressure," noted Jim Reid, global head of macro research at Deutsche Bank AG. He added that the weakness in gilts reflects investor concern that "he could be replaced."

          Monetary Policy vs. Political Risk

          The divergence in bond yields highlights where investors are focusing their attention. Longer-dated debt is highly sensitive to political and fiscal risk, while shorter-dated notes are primarily driven by central bank policy.

          With the Bank of England expected to hold interest rates steady on Thursday, the front end of the yield curve has been anchored. "While gilts are watching politics, the front-end will be paying attention to today's BOE meeting," said Jamie Searle, a strategist at Citigroup Inc.

          Searle explained that with recent UK data surprising to the upside, there is little pressure on the Monetary Policy Committee to act. "Yesterday's rise in political uncertainty adds to the cheapening," he added, referring to the sell-off in longer-term gilts.

          Market Anxiety Over a Post-Starmer UK

          For investors, the instability is not just about a potential leadership change but what might follow. The market consensus is that any replacement for Starmer or his chancellor, Rachel Reeves, would be less committed to the UK's current fiscal rules.

          "This is negative for the currency not simply because political instability is undesirable, but because any change in leadership is likely to be interpreted as fiscally expansionary," one analyst noted. "Given the UK's long-standing challenges around debt financing, markets will undoubtedly react negatively to such developments."

          This sensitivity has been tested before. Just two weeks ago, gilts sold off after a potential path opened for Greater Manchester Mayor Andy Burnham, a left-wing rival of Starmer, to return to Parliament. Burnham, who has criticized the UK's deference to financial markets, is seen as a potential challenger for the premiership.

          The political headwinds arrive at a difficult time for Starmer, whose Labour party is struggling with dire polling numbers and who faces a record disapproval rating himself ahead of local elections in May.

          To stay updated on all economic events of today, please check out our Economic calendar
          Risk Warnings and Disclaimers
          You understand and acknowledge that there is a high degree of risk involved in trading. Following any strategies or investment methods may lead to potential losses. The content on the site is provided by our contributors and analysts for information purposes only. You are solely responsible for determining whether any trading assets, securities, strategy, or any other product is suitable for investing based on your own investment objectives and financial situation.
          Add to Favorites
          Share

          Czech Inflation Hits 9-Year Low, Rate Cut Debate Ignites

          King Ten

          Data Interpretation

          Remarks of Officials

          Central Bank

          Economic

          Czech headline inflation plunged to a nine-year low of 1.6% year-on-year in January, a development fueled by falling energy costs that has intensified the debate over future interest rate cuts.

          The preliminary data was released just as the Czech National Bank (CNB) convened for a policy meeting. The central bank has kept its main interest rate on hold at 3.50% since May 2025. That decision followed an easing cycle that began in 2023, which halved the rate from its 7.00% peak reached during the 2022-2023 inflation surge.

          Inflation Plunges Below Expectations

          According to the statistics office's flash estimate, the 1.6% annual inflation rate for January was slightly below the 1.7% forecast in a Reuters poll. Month-on-month, prices rose by an expected 0.9%.

          Inflation has remained close to the central bank's 2% target since 2024, following a period where price growth reached double-digit levels.

          Figure 1: Czech year-on-year inflation peaked near 18% in 2023 before a rapid descent brought the rate to its current multi-year low, stabilizing near the central bank's 2% target since 2024.

          Sticky Service Prices Complicate CNB's Decision

          Despite the sharp drop in the headline number, policymakers remain cautious due to underlying price pressures. A key concern is inflation in the services sector, which remained high at 4.7% year-on-year. Analysts agree that elevated core inflation and persistent price growth in services give the central bank reasons to remain vigilant.

          The recent decline in energy costs was significantly influenced by a government policy decision. The administration of Prime Minister Andrej Babis shifted the burden of payments for renewable energy from households and companies to the state budget. The central bank typically does not adjust policy based on the primary impact of such regulatory changes.

          In December, Governor Ales Michl confirmed the bank would not react to the measure and noted that inflation could fall below its target.

          Rate Cut Outlook: A Shift in Tone?

          Analysts believe price growth will likely remain below 2% for a sustained period. While most expect the central bank to hold rates steady at Thursday's meeting, the probability of a rate cut later this year is growing.

          The discussion has gained momentum after some policymakers floated the possibility. In a late January interview with Reuters, Vice-Governor Jan Frait said the bank could discuss slight monetary easing, citing external factors that might lead other major central banks to cut rates.

          This sentiment was echoed in market analysis following the latest inflation data.

          "The probability of a further decrease in CNB interest rates this year has increased significantly," said Jan Bures, an economist at CSOB bank.

          To stay updated on all economic events of today, please check out our Economic calendar
          Risk Warnings and Disclaimers
          You understand and acknowledge that there is a high degree of risk involved in trading. Following any strategies or investment methods may lead to potential losses. The content on the site is provided by our contributors and analysts for information purposes only. You are solely responsible for determining whether any trading assets, securities, strategy, or any other product is suitable for investing based on your own investment objectives and financial situation.
          Add to Favorites
          Share

          India Clarifies Terms of New US Trade Pact

          Devin

          Political

          Remarks of Officials

          Economic

          India has confirmed its exports will benefit from a sharply lower 18% U.S. tariff, but the change is not immediate as previously announced by Washington.

          Commerce Minister Piyush Goyal clarified that the new rate, a significant drop from 50%, will only take effect after both nations sign a joint statement and the U.S. issues an executive order. This timeline differs from President Donald Trump's earlier statement that the reduction was "effective immediately."

          Implementation Hinges on Formal Agreement

          Goyal stated that the joint statement is expected to be signed within the next four to five days. Following the U.S. action, New Delhi will reciprocate by lowering its own duties on American goods around mid-March, but only once the formal agreement is officially in place.

          While financial markets in India initially reacted positively to the news, the absence of official documentation has created confusion, even as leaders portray the deal as a reset in trade relations.

          Uncertainty Lingers Over Deal's Full Scope

          Prime Minister Narendra Modi’s government has confirmed the core tariff reduction on Indian goods but has not yet verified several other commitments outlined by President Trump. These unconfirmed claims include India agreeing to:

          • Halt Russian crude oil purchases

          • Import oil from Venezuela

          • Reduce tariffs on some American products to zero

          Deconstructing the $500 Billion Purchase Pledge

          A key point of clarification from Indian officials concerns the announced $500 billion in purchases of U.S. goods. They explained that this figure is not entirely new business but is spread over a five-year period and incorporates deals that were already in the pipeline.

          Goyal noted that existing aircraft orders from the U.S. could account for over $100 billion of that total. In recent years, major carriers including Air India Ltd., Akasa Air operator SNV Aviation Pvt., and SpiceJet Ltd. have collectively ordered 590 planes from Boeing Co.

          Beyond aviation, Goyal added that India plans to increase its purchases of American energy, semiconductors, and electronic goods over the next five years.

          To stay updated on all economic events of today, please check out our Economic calendar
          Risk Warnings and Disclaimers
          You understand and acknowledge that there is a high degree of risk involved in trading. Following any strategies or investment methods may lead to potential losses. The content on the site is provided by our contributors and analysts for information purposes only. You are solely responsible for determining whether any trading assets, securities, strategy, or any other product is suitable for investing based on your own investment objectives and financial situation.
          Add to Favorites
          Share

          France's Factory Output Slips, But Is a Rebound Coming?

          King Ten

          Data Interpretation

          Economic

          French manufacturing output registered a 0.8% decline in December, a reversal from the 0.5% growth seen in November. However, a closer look reveals the drop was concentrated in specific, highly volatile sectors and does not signal a broader industrial slowdown.

          Unpacking the December Decline

          The negative headline figure was primarily driven by weaker production in transport equipment, a sector that makes up 13% of France's total manufacturing output. The aerospace segment, in particular, saw a sharp drop that erased the gains from the previous three months.

          Such volatility is typical for the aerospace industry, and this one-month dip is not considered a cause for alarm. In fact, on a yearly basis, production of transport equipment is still up by a strong 12.4%.

          While coke production also fell by 0.9% over the month, every other industrial sector reported an increase in output, underscoring the narrow scope of the December downturn.

          A Positive Outlook for 2026

          Despite the monthly dip, the forecast for French industry in the first half of 2026 remains optimistic. A cyclical improvement is expected, supported by several key factors:

          • Regional Recovery: A broader European economic recovery is gaining momentum.

          • German Stimulus: Germany's stimulus plan is anticipated to boost regional demand.

          • Business Confidence: Improving business sentiment and healthier order books point to higher industrial production in the coming months.

          • Defense Spending: Rising defense budgets will continue to support the industrial sector.

          • Aerospace Strength: Aerospace production is projected to remain a significant driver of growth.

          Potential Risks on the Horizon

          However, the path forward is not without challenges. Several factors could weigh on economic activity and exports:

          • Stronger Euro: The recent appreciation of the euro poses a risk to export competitiveness. The European Central Bank estimates that a further 4.3% rise in the euro against the dollar could reduce eurozone GDP growth by 0.1 percentage points.

          • High Tax Burden: The high tax burden on French companies may constrain business activity.

          • Weak Investment: Recent business surveys indicate that investment intentions remain very weak.

          The Final Verdict: Modest Growth Expected

          Balancing these positive drivers and potential headwinds, the overall outlook for 2026 is moderately positive. GDP growth is forecast to reach approximately 1%, a slight acceleration from the 0.9% growth recorded in 2025.

          To stay updated on all economic events of today, please check out our Economic calendar
          Risk Warnings and Disclaimers
          You understand and acknowledge that there is a high degree of risk involved in trading. Following any strategies or investment methods may lead to potential losses. The content on the site is provided by our contributors and analysts for information purposes only. You are solely responsible for determining whether any trading assets, securities, strategy, or any other product is suitable for investing based on your own investment objectives and financial situation.
          Add to Favorites
          Share

          Why the S&P 500 Could Face a Sharp Drop in 2026

          George Anderson

          Political

          Stocks

          Data Interpretation

          Remarks of Officials

          Economic

          The S&P 500 is navigating a complex landscape. The economic impact of President Trump's tariffs, combined with high stock market valuations and the uncertainty of midterm elections, could trigger a significant decline or even a crash in 2026. For investors, understanding these interconnected risks is crucial.

          President Trump's trade policies, including tariffs, are a central factor in the economic outlook for 2026.

          Trump's Tariffs: Economic Claims vs. Reality

          In a January editorial for The Wall Street Journal, President Trump argued that his administration's tariffs have fueled "extraordinarily high economic growth." He also claimed that foreign exporters are footing the bill. However, a closer look at the data suggests a different narrative.

          Deconstructing 2025 GDP Growth

          The assertion of tariff-driven growth doesn't align with economic figures. Here’s a breakdown of the first nine months of 2025:

          • Underwhelming Performance: Real GDP grew by 2.51%. This rate is actually below the 10-year average (2.75%), the 30-year average (2.58%), and the 50-year average (2.84%).

          • The AI Factor: According to the Federal Reserve Bank of St. Louis, spending on artificial intelligence (AI) contributed 0.97 percentage points to GDP growth during this period. Without the boost from AI, the economy would have expanded by just 1.54%. Goldman Sachs noted that without AI, "U.S. GDP would have almost flatlined."

          Who Really Pays for the Tariffs?

          President Trump’s editorial also stated that foreign producers are absorbing "at least 80% of tariff costs," citing a Harvard Business School study. This appears to be a misinterpretation of the research.

          The study he referenced explicitly concludes, "Our results suggest that U.S. consumers paid up to 43 percent of the tariff burden, with the rest absorbed by U.S. firms." The report does not suggest that foreign exporters paid a substantial portion of the tariffs.

          The takeaway is clear: contrary to claims, GDP growth in 2025 was subpar and heavily propped up by AI investment, not tariffs.

          Historical Headwinds for the Stock Market

          Beyond the tariff debate, two historical patterns are signaling caution for the S&P 500 in 2026: elevated valuations and the midterm election cycle.

          A Market Priced for Perfection

          The S&P 500 currently trades at 22.2 times forward earnings, according to FactSet Research. This is a very expensive valuation from a historical perspective. In the last 40 years, the index has only sustained a forward price-to-earnings (P/E) ratio above 22 during two periods: the dot-com bubble and the COVID-19 pandemic. Both were followed by bear markets.

          This high valuation is particularly risky because the forward P/E metric already incorporates Wall Street's optimistic expectations for accelerated earnings in 2026. If companies fail to meet these high forecasts as tariffs weigh on the economy, stocks could fall sharply.

          Midterm Election Year Jitters

          History shows that midterm election years often bring market volatility. The S&P 500 has experienced a median intra-year drawdown of 19% in these years. This pattern suggests there is a 50/50 chance the index could see a similar decline in 2026.

          This volatility stems from the uncertainty that midterm elections create. The party in power typically loses seats in Congress, leaving investors to speculate about future fiscal, trade, and regulatory policies.

          The Bottom Line for Investors

          The stock market faces a convergence of headwinds in 2026. The combination of high valuations, the economic drag from tariffs, and the historical uncertainty of a midterm election year raises the probability of a bear market or even a crash.

          However, there is a silver lining for long-term investors. Every past market drawdown has ultimately proven to be a buying opportunity, and there is no reason to believe this time will be different.

          To stay updated on all economic events of today, please check out our Economic calendar
          Risk Warnings and Disclaimers
          You understand and acknowledge that there is a high degree of risk involved in trading. Following any strategies or investment methods may lead to potential losses. The content on the site is provided by our contributors and analysts for information purposes only. You are solely responsible for determining whether any trading assets, securities, strategy, or any other product is suitable for investing based on your own investment objectives and financial situation.
          Add to Favorites
          Share

          Kevin Warsh’s Inflation Doctrine And The Test Of Federal Reserve Credibility

          Gerik

          Economic

          An Inflation Hawk With A Pragmatic Voting Record

          During his tenure as a governor at the Federal Reserve from 2006 to 2011, Kevin Warsh consistently emphasized the importance of anchoring inflation expectations and preserving central bank credibility. Yet his voting behavior tells a more nuanced story. Despite his hawkish philosophy, Warsh never dissented from the consensus of the Federal Open Market Committee and frequently supported holding rates steady or cutting them, particularly as economic conditions deteriorated during the global financial crisis.
          This apparent tension reflects a distinction between ideology and implementation. Warsh’s speeches and meeting transcripts show that while inflation risks were always central to his thinking, he remained willing to ease policy when data pointed to weakening growth or financial instability. Former Atlanta Fed president Dennis Lockhart described this approach as fundamentally data-driven, arguing that Warsh understands the need to let economic evidence guide policy decisions rather than rigid doctrine.

          Crisis-Era Warnings And Inflation Expectations

          Warsh’s focus on inflation credibility was especially visible during the 2008 financial crisis. At an April 2008 FOMC meeting, months before the collapse of Lehman Brothers, he voted for a 25 basis point rate cut but warned that repeated easing could signal an excessive tolerance for inflation. He argued that such perceptions risked pushing inflation expectations higher, undermining the Fed’s long-term credibility.
          His remarks during this period highlighted a causal relationship he consistently emphasized. In Warsh’s view, if markets believe the central bank is willing to tolerate higher inflation to support growth, expectations will adjust upward, making inflation harder to control later. This logic echoed again in September 2009, when the Fed committed to keeping rates near zero for an extended period. Warsh cautioned that waiting to normalize policy until the economy returned to full strength would almost certainly mean acting too late, thereby sowing the seeds of future inflation.

          Lessons From The 1970s And The Dual Mandate

          In a 2010 speech, Warsh drew explicit parallels to the inflationary experience of the 1970s. He argued that the willingness to accept slightly higher inflation in exchange for lower unemployment had been a central mistake of that era. From his perspective, any implicit increase in the inflation target would necessarily lift expectations, and once credibility was lost, it would be difficult for a central bank to convincingly promise that the shift was temporary.
          This framework remains highly relevant today as the Fed navigates its dual mandate of price stability and maximum employment. Over the past year, policymakers have debated which side of that mandate was further from balance as inflation eased but remained elevated while the labor market softened. The Fed ultimately chose to cut rates three times last fall, prioritizing employment support. Warsh’s historical record suggests he views such trade-offs with caution, particularly if they risk blurring the central bank’s commitment to price stability.

          A More Dovish Tone In Recent Years

          In contrast to his earlier warnings, Warsh has more recently advocated for lower interest rates, arguing that structural forces could suppress inflation. He has suggested that the Fed should abandon fears of stagflation and recognize artificial intelligence as a powerful driver of productivity gains that could push inflation lower over time. In this view, stronger growth does not automatically translate into higher inflation, weakening the traditional link between demand expansion and price pressures.
          Former Cleveland Fed president Loretta Mester noted that while Warsh has articulated broad views about productivity and AI, translating those beliefs into policy would require building consensus within the committee. This highlights a practical constraint on any Fed chair. Even with strong convictions, policy outcomes depend on persuading a divided committee over multiple meetings rather than imposing a unilateral vision.

          Toward A More Rules-Based Federal Reserve

          Some market participants believe a Warsh-led Fed would mark a shift toward a more disciplined and rules-based institution. Jeffrey Roach of LPL Financial argued that such a transition could elevate price stability as the dominant objective, reduce discretionary interventions, and scale back reliance on large-scale asset purchases. If realized, this approach could have significant implications for financial markets.
          A less interventionist Fed could lead investors to demand higher risk compensation, pushing up long-term interest rates and steepening the yield curve. This would reflect a more market-driven allocation of capital rather than one shaped by persistent central bank support. The relationship here is structural rather than immediate, as expectations of future policy frameworks influence asset pricing over time.

          Independence Under Political Pressure

          Throughout his tenure, Warsh repeatedly stressed the importance of protecting the Fed’s independence. In a March 2010 speech, he argued that credibility required fierce independence from political pressure and short-term interests, whether from Washington or Wall Street. This stance may be tested if he assumes the role of chair.
          As President Donald Trump’s nominee to lead the Fed, Warsh is expected to face pressure from the White House to cut rates, even as the committee itself remains divided. Dennis Lockhart described the situation as a delicate balancing act, requiring Warsh to assert independence while maintaining enough alignment with political expectations to function effectively.
          If confirmed, Warsh will inherit a complex policy environment marked by lingering inflation concerns, evolving productivity dynamics, and political scrutiny. His record suggests a leader who prioritizes credibility and long-term stability, yet remains flexible in the face of compelling data. Whether that balance can be maintained under intense political and economic pressure will determine how his tenure shapes the future of U.S. monetary policy.

          Source: Yahoo Finance

          To stay updated on all economic events of today, please check out our Economic calendar
          Risk Warnings and Disclaimers
          You understand and acknowledge that there is a high degree of risk involved in trading. Following any strategies or investment methods may lead to potential losses. The content on the site is provided by our contributors and analysts for information purposes only. You are solely responsible for determining whether any trading assets, securities, strategy, or any other product is suitable for investing based on your own investment objectives and financial situation.
          Add to Favorites
          Share

          India-US Trade Deal Nears March Signing

          Thomas

          Political

          Remarks of Officials

          Economic

          India's Trade Minister Piyush Goyal confirmed that a formal trade agreement with the United States is expected to be signed in March, a move that will see New Delhi reduce its tariffs on American goods.

          Goyal laid out the first official timeline for the deal, which President Donald Trump first announced on Monday. A joint statement is expected within four to five days, which will trigger Washington to slash duties on Indian exports from 50% to 18%.

          The agreement hinges on India halting its purchases of Russian oil and lowering existing trade barriers in exchange for more favorable tariff treatment from the U.S.

          India's $500 Billion US Import Plan

          A core component of the deal is a commitment from India to import at least $500 billion worth of American goods over the next five years. The purchases will focus on high-value sectors, including energy, aircraft, and computer chips.

          Goyal specified that orders from planemaker Boeing alone could amount to between $70 billion and $80 billion. He added that the total value of these aircraft deals would likely "cross $100 billion" when factoring in the cost of engines.

          To stay updated on all economic events of today, please check out our Economic calendar
          Risk Warnings and Disclaimers
          You understand and acknowledge that there is a high degree of risk involved in trading. Following any strategies or investment methods may lead to potential losses. The content on the site is provided by our contributors and analysts for information purposes only. You are solely responsible for determining whether any trading assets, securities, strategy, or any other product is suitable for investing based on your own investment objectives and financial situation.
          Add to Favorites
          Share
          FastBull
          Copyright © 2026 FastBull Ltd

          728 RM B 7/F GEE LOK IND BLDG NO 34 HUNG TO RD KWUN TONG KLN HONG KONG

          TelegramInstagramTwitterfacebooklinkedin
          App Store Google Play Google Play
          Products
          Charts

          Chats

          Q&A with Experts
          Screeners
          Economic Calendar
          Data
          Tools
          Membership
          Features
          Function
          Markets
          Copy Trading
          Latest Signals
          Contests
          News
          Analysis
          24/7
          Columns
          Education
          Company
          Careers
          About Us
          Contact Us
          Advertising
          Help Center
          Feedback
          User Agreement
          Privacy Policy
          Personal Information Protection Statement
          Business

          White Label

          Broker API

          Data API

          Web Plug-ins

          Poster Maker

          Affiliate Program

          Risk Disclosure

          The risk of loss in trading financial instruments such as stocks, FX, commodities, futures, bonds, ETFs and crypto can be substantial. You may sustain a total loss of the funds that you deposit with your broker. Therefore, you should carefully consider whether such trading is suitable for you in light of your circumstances and financial resources.

          No decision to invest should be made without thoroughly conducting due diligence by yourself or consulting with your financial advisors. Our web content might not suit you since we don't know your financial conditions and investment needs. Our financial information might have latency or contain inaccuracy, so you should be fully responsible for any of your trading and investment decisions. The company will not be responsible for your capital loss.

          Without getting permission from the website, you are not allowed to copy the website's graphics, texts, or trademarks. Intellectual property rights in the content or data incorporated into this website belong to its providers and exchange merchants.

          Not Logged In

          Log in to access more features

          Connect Broker
          Become a signal provider
          Help Center
          Customer Service
          Dark Mode
          Price Up/Down Colors

          Log In

          Sign Up

          Position
          Layout
          Fullscreen
          Default to Chart
          The chart page opens by default when you visit fastbull.com