Markets
News
Analysis
User
24/7
Economic Calendar
Education
Data
- Names
- Latest
- Prev


Signal Accounts for Members
All Signal Accounts
All Contests


US Treasury Says To Borrow $574 Billion In Q1, Sees End Cash Balance Of $850 Billion (Removes Extraneous Word "It")
US Treasury Says It Expects To Borrow $109 Billion In Q2, Sees End Cash Balance Of $900 Billion
[The Carlyle Group Joins Europe's Top Ten Oil Refiners] As Major Oil Companies Streamline Their Portfolios, The Carlyle Group Has Joined The Ranks Of Europe's Top Ten Fuel Manufacturers. The Private Equity Giant Holds A Two-thirds Stake In Varo Energy, Which Completed Its Acquisition Of The Lysekil And Gothenburg Refineries In Sweden In January. According To Data Compiled By Bloomberg, This Move, Combined With Its Existing Holdings, Elevates Carlyle To Ninth Place Among European Fuel Manufacturers
WTI Crude Oil Futures For March Delivery Closed At $62.14 Per Barrel. Nymex Natural Gas Futures For March Delivery Closed At $3.2370 Per Million British Thermal Units (MMBtu). Nymex Gasoline Futures For March Delivery Closed At $1.8514 Per Gallon, And Nymex Heating Oil Futures For March Delivery Closed At $2.3598 Per Gallon
Ukraine Designates Iran's Islamic Revolutionary Guard Corps As A "terrorist Organization" On February 2nd. Ukrainian President Volodymyr Zelenskyy Announced That Ukraine Has Designated Iran's Islamic Revolutionary Guard Corps As A "terrorist Organization." Iran Has Not Yet Responded
Intercontinental Exchange (ICE), The Owner Of Nasdaq (NYSE), Has Received Approval From The U.S. Securities And Exchange Commission (SEC) To Provide U.S. Treasury Clearing Services
Swiss National Bank Chairman: Expects Swiss Inflation To Rise In Coming Months, Sees Monetary Conditions In Switzerland As Appropriate
Rubio: US Looks Forward To Working Closely With Costa Rica's President-Elect Laura Fernández Delgado's Administration After Electoral Victory
German Chancellor Merz: Transatlantic Relationship Has Changed And No One Regrets It More Than Me
New York Fed Accepts $10.415 Billion Of $10.415 Billion Submitted To Reverse Repo Facility On Feb 02

China, Mainland NBS Non-manufacturing PMI (Jan)A:--
F: --
P: --
South Korea Trade Balance Prelim (Jan)A:--
F: --
Japan Manufacturing PMI Final (Jan)A:--
F: --
P: --
South Korea IHS Markit Manufacturing PMI (SA) (Jan)A:--
F: --
P: --
Indonesia IHS Markit Manufacturing PMI (Jan)A:--
F: --
P: --
China, Mainland Caixin Manufacturing PMI (SA) (Jan)A:--
F: --
P: --
Indonesia Trade Balance (Dec)A:--
F: --
P: --
Indonesia Inflation Rate YoY (Jan)A:--
F: --
P: --
Indonesia Core Inflation YoY (Jan)A:--
F: --
P: --
India HSBC Manufacturing PMI Final (Jan)A:--
F: --
P: --
Australia Commodity Price YoY (Jan)A:--
F: --
P: --
Russia IHS Markit Manufacturing PMI (Jan)A:--
F: --
P: --
Turkey Manufacturing PMI (Jan)A:--
F: --
P: --
U.K. Nationwide House Price Index MoM (Jan)A:--
F: --
P: --
U.K. Nationwide House Price Index YoY (Jan)A:--
F: --
P: --
Germany Actual Retail Sales MoM (Dec)A:--
F: --
Italy Manufacturing PMI (SA) (Jan)A:--
F: --
P: --
South Africa Manufacturing PMI (Jan)A:--
F: --
P: --
Euro Zone Manufacturing PMI Final (Jan)A:--
F: --
P: --
U.K. Manufacturing PMI Final (Jan)A:--
F: --
P: --
Turkey Trade Balance (Jan)A:--
F: --
P: --
Brazil IHS Markit Manufacturing PMI (Jan)A:--
F: --
P: --
Canada National Economic Confidence IndexA:--
F: --
P: --
Canada Manufacturing PMI (SA) (Jan)A:--
F: --
P: --
U.S. IHS Markit Manufacturing PMI Final (Jan)A:--
F: --
P: --
U.S. ISM Output Index (Jan)A:--
F: --
P: --
U.S. ISM Inventories Index (Jan)A:--
F: --
P: --
U.S. ISM Manufacturing Employment Index (Jan)A:--
F: --
P: --
U.S. ISM Manufacturing New Orders Index (Jan)A:--
F: --
P: --
U.S. ISM Manufacturing PMI (Jan)A:--
F: --
P: --
South Korea CPI YoY (Jan)--
F: --
P: --
Japan Monetary Base YoY (SA) (Jan)--
F: --
P: --
Australia Building Approval Total YoY (Dec)--
F: --
P: --
Australia Building Permits MoM (SA) (Dec)--
F: --
P: --
Australia Building Permits YoY (SA) (Dec)--
F: --
P: --
Australia Private Building Permits MoM (SA) (Dec)--
F: --
P: --
Australia Overnight (Borrowing) Key Rate--
F: --
P: --
RBA Rate Statement
Japan 10-Year Note Auction Yield--
F: --
P: --
Saudi Arabia IHS Markit Composite PMI (Jan)--
F: --
P: --
RBA Press Conference
Turkey PPI YoY (Jan)--
F: --
P: --
Turkey CPI YoY (Jan)--
F: --
P: --
Turkey CPI YoY (Excl. Energy, Food, Beverage, Tobacco & Gold) (Jan)--
F: --
P: --
U.S. Weekly Redbook Index YoY--
F: --
P: --
U.S. JOLTS Job Openings (SA) (Dec)--
F: --
P: --
Mexico Manufacturing PMI (Jan)--
F: --
P: --
U.S. API Weekly Refined Oil Stocks--
F: --
P: --
U.S. API Weekly Gasoline Stocks--
F: --
P: --
U.S. API Weekly Cushing Crude Oil Stocks--
F: --
P: --
U.S. API Weekly Crude Oil Stocks--
F: --
P: --
Japan IHS Markit Services PMI (Jan)--
F: --
P: --
Japan IHS Markit Composite PMI (Jan)--
F: --
P: --
China, Mainland Caixin Services PMI (Jan)--
F: --
P: --
China, Mainland Caixin Composite PMI (Jan)--
F: --
P: --
India HSBC Services PMI Final (Jan)--
F: --
P: --
India IHS Markit Composite PMI (Jan)--
F: --
P: --
Russia IHS Markit Services PMI (Jan)--
F: --
P: --
South Africa IHS Markit Composite PMI (SA) (Jan)--
F: --
P: --
Italy Services PMI (SA) (Jan)--
F: --
P: --
Italy Composite PMI (Jan)--
F: --
P: --


No matching data
Latest Views
Latest Views
Trending Topics
Top Columnists
Latest Update
White Label
Data API
Web Plug-ins
Affiliate Program
View All

No data
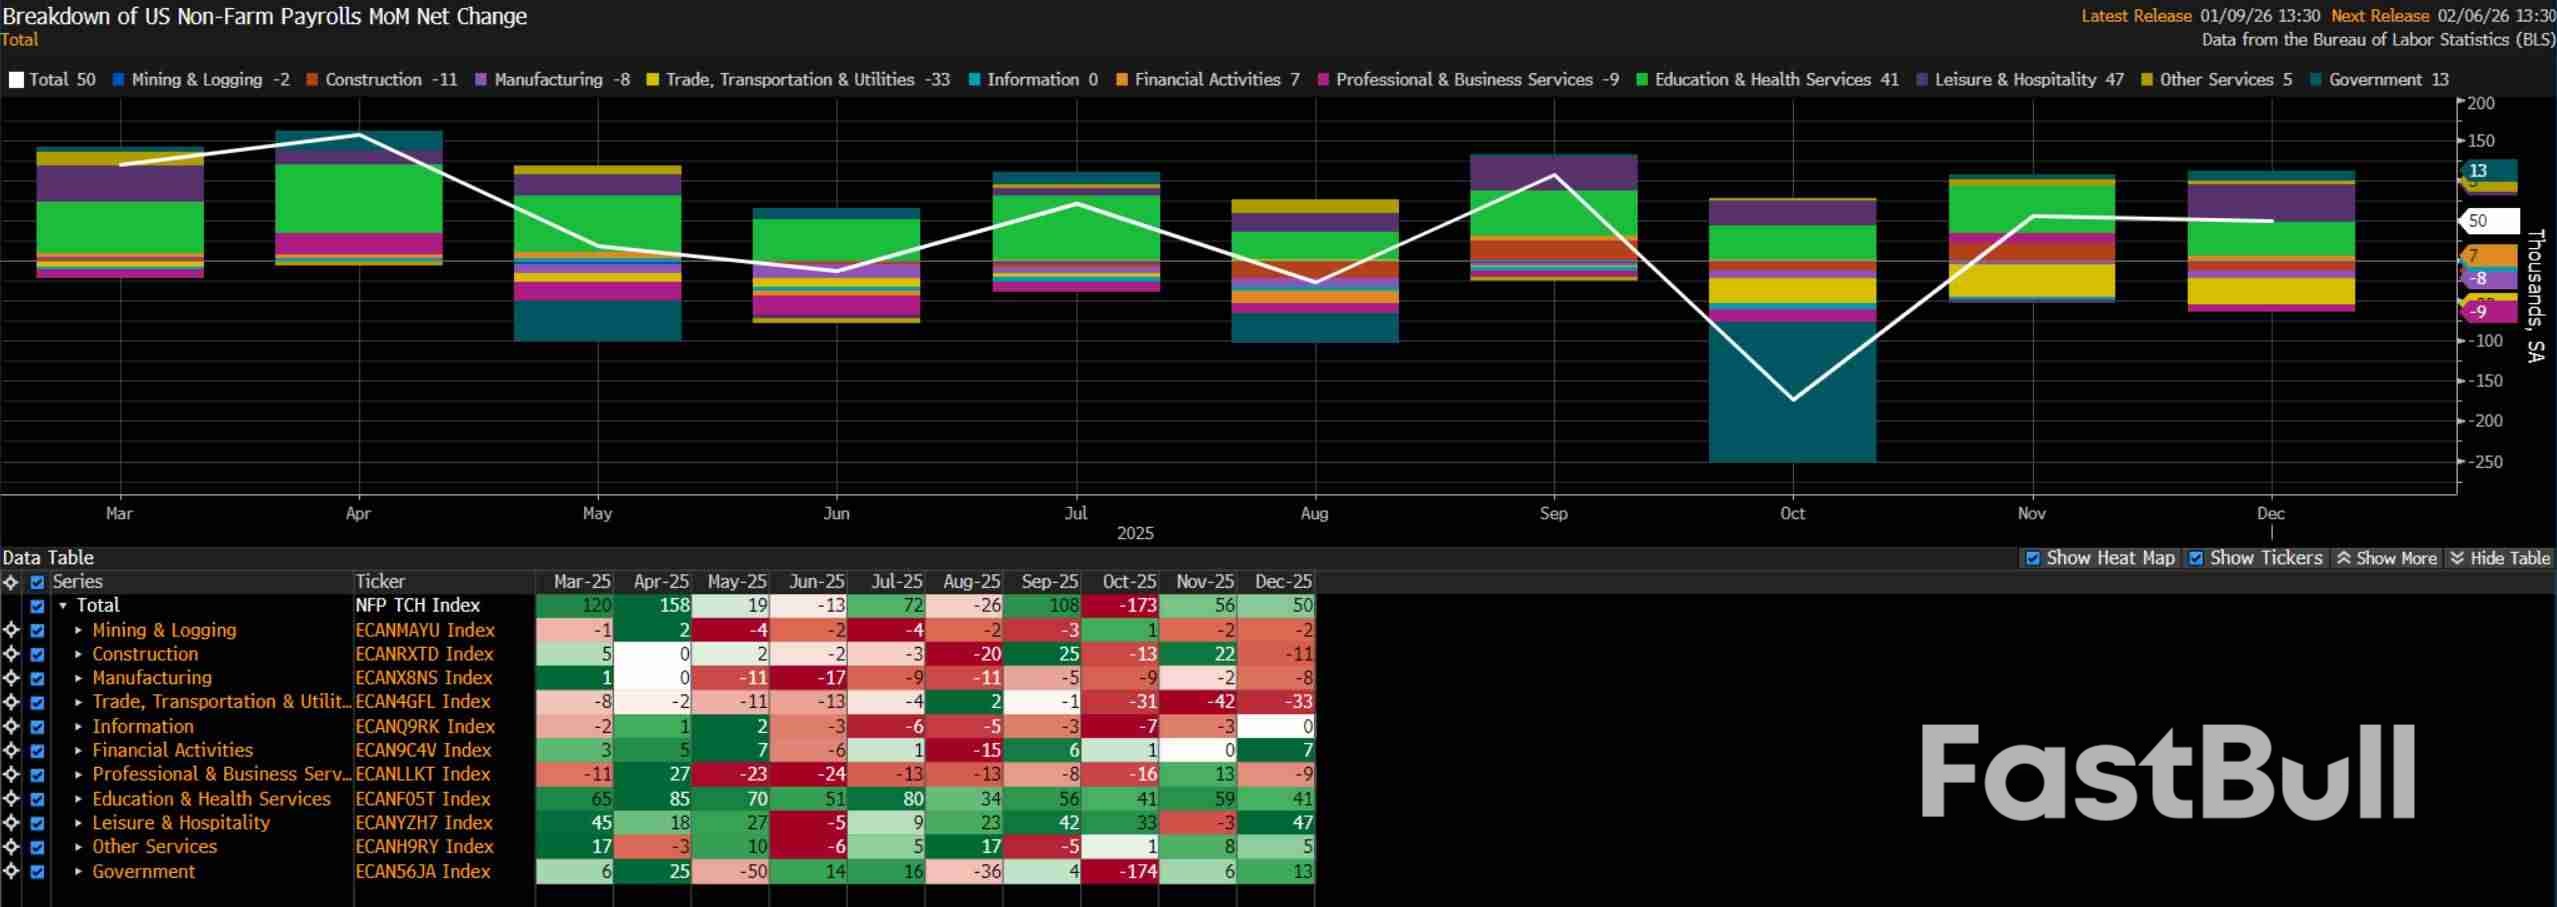
Payrolls Growth In Line With Breakeven Rate Headline nonfarm payrolls are set to have risen by +65k last month, a modest quicken
Headline nonfarm payrolls are set to have risen by +65k last month, a modest quickening from the +50k pace seen in December, though broadly in line with the breakeven pace of job creation, which presently lies in a range of around +30k to +80k.
In any case, the range of estimates for headline job creation is as wide as ever, from a low of -10k, to a high of +130k, while revisions to the prior two months' of NFP data also bear watching closely. Additionally, as usual, the January report will also bring with it the annual benchmark revision, applicable to the March 2025 employment level. The preliminary QCEW data previously suggested a record -911k downward revision, roughly cutting the previously released employment level in half, with the final figure likely to be broadly in line with that figure.

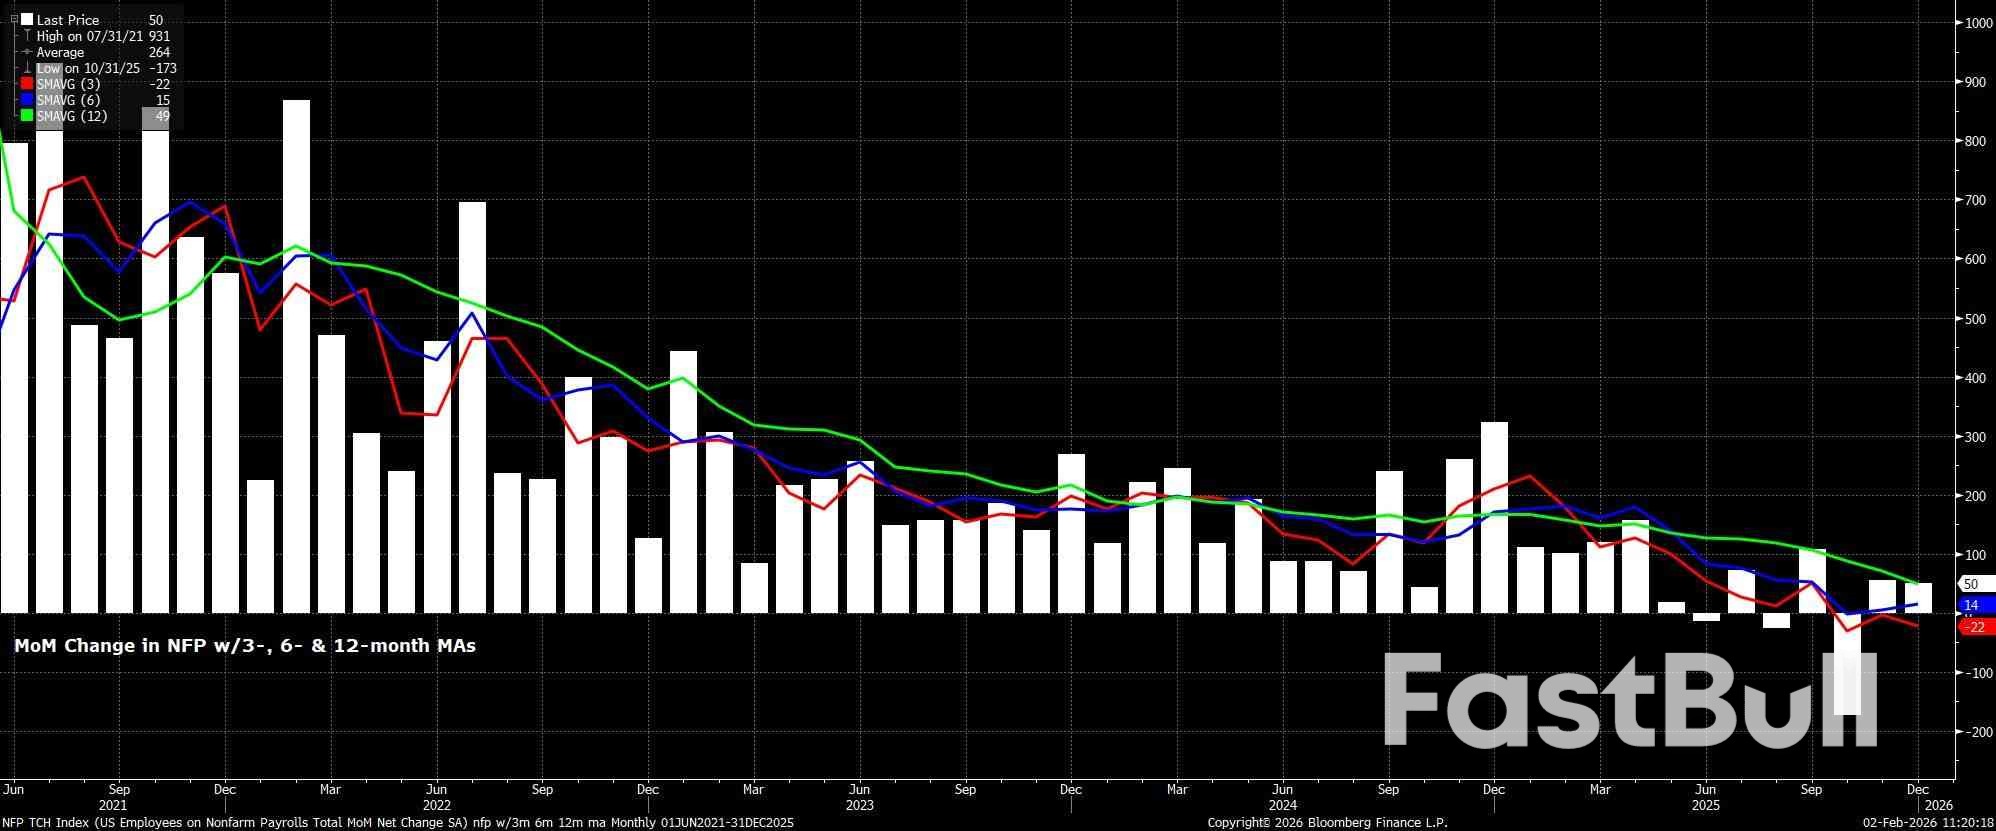
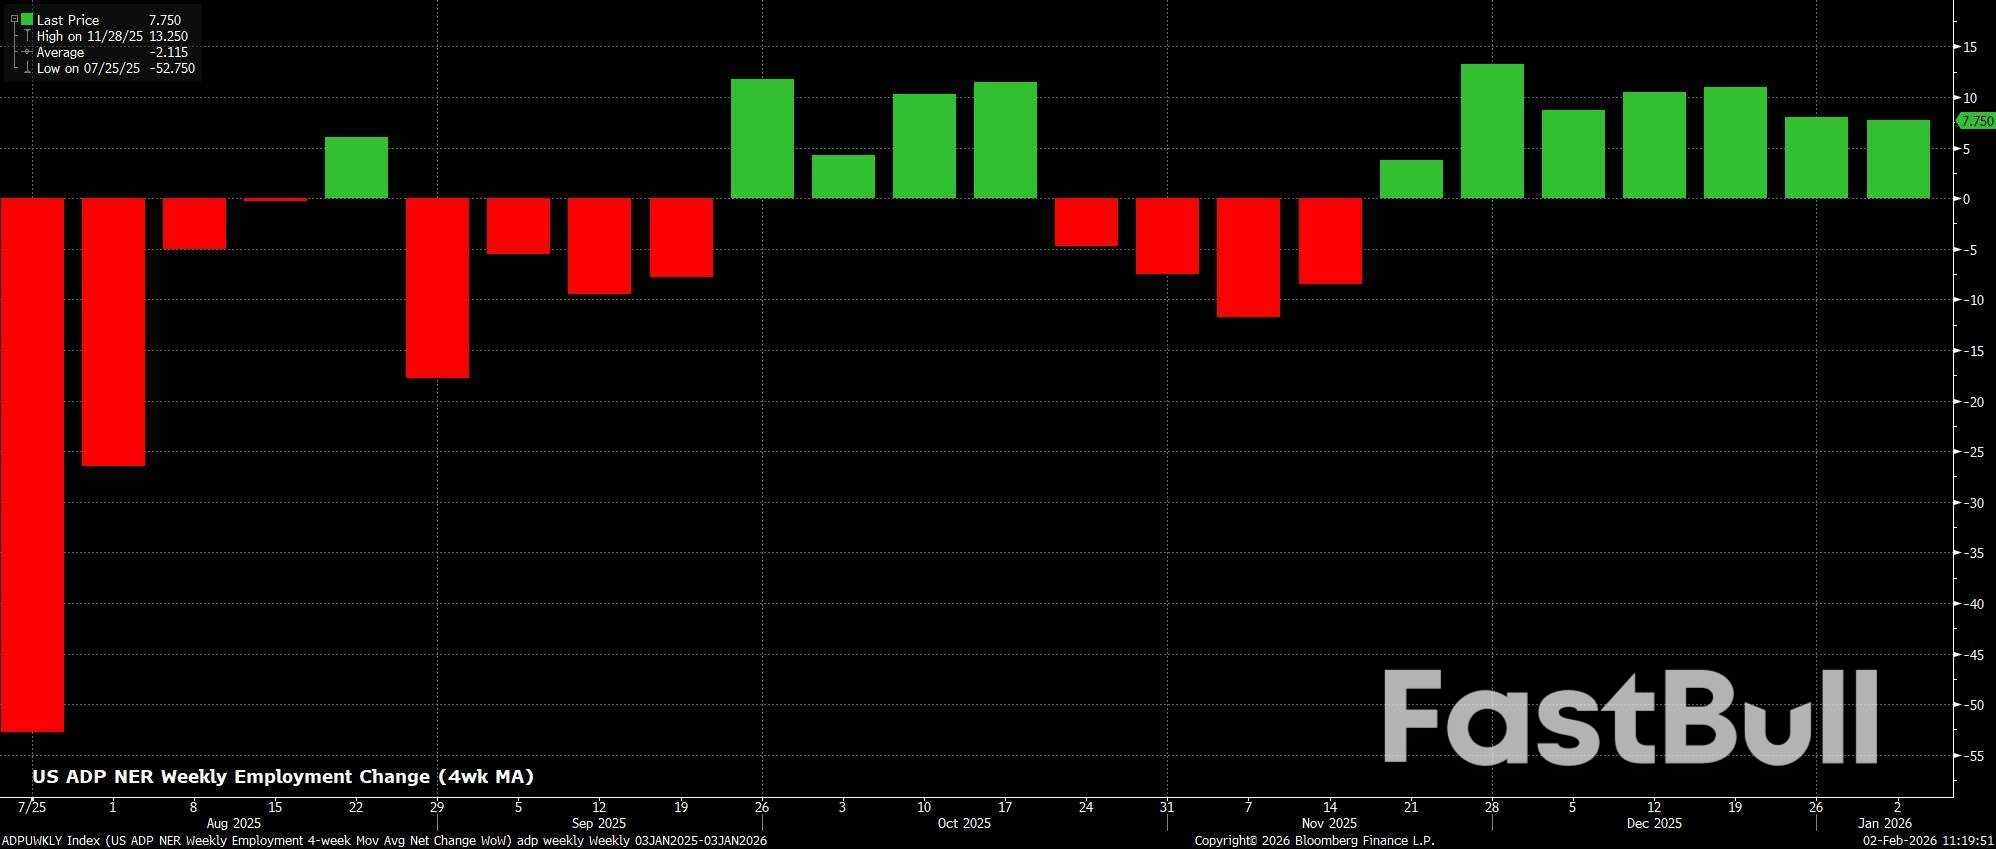
Leading indicators for the payrolls print are, on balance, largely unchanged from where they stood this time a month ago, though at the time of writing we are yet to receive either of the monthly ISM surveys, or the monthly ADP employment report.
In any case, both initial and continuing jobless claims fell between the December and January survey weeks, by 14k and 48k respectively, though the former seems largely a reflection of seasonal adjustment factors, as opposed to underlying labour market shifts. Meanwhile, the weekly ADP employment report pointed to a total of 31k jobs having been added in the four weeks to 3rd January, a week prior to the BLS reference week.
Meanwhile, the NFIB hiring intentions survey has continued to tick higher in recent months, and suggests a considerably above-consensus private payrolls gain of around +180k. However, since last autumn, the correlation between hiring intentions, and actual hiring, appears to have broken down, not only lessening the utility of the metric as a lead for NFP growth, but possibly also suggesting that businesses remain reluctant to follow through on those plans, likely due to economic uncertainty, especially on trade, remaining at incredibly elevated levels.

As for other factors to watch in the jobs report, it's important to recall that the January report typically sees a significant upwards skew as a result of seasonal adjustments, largely reflecting the significant turnover that is seen as the holiday season wraps up, temporary contracts end, and amid typically higher-than-usual retirement levels at year-end.
Speaking of the holiday season, the unwinding of some degree of temporary hiring around the festive period may act as a drag on headline payrolls growth, though it must be said that said hiring was conducted to a lesser degree in 2025 than had been seen in year prior, hence any impact on this front could well be negligible. Besides that, the recent cold weather snap hit the US after the conclusion of the January survey week, hence shan't have any sort of significant impact, while the composition of hiring will also be closely watched, with the vast majority of private sector jobs over the last 12 months having come in the healthcare sector.

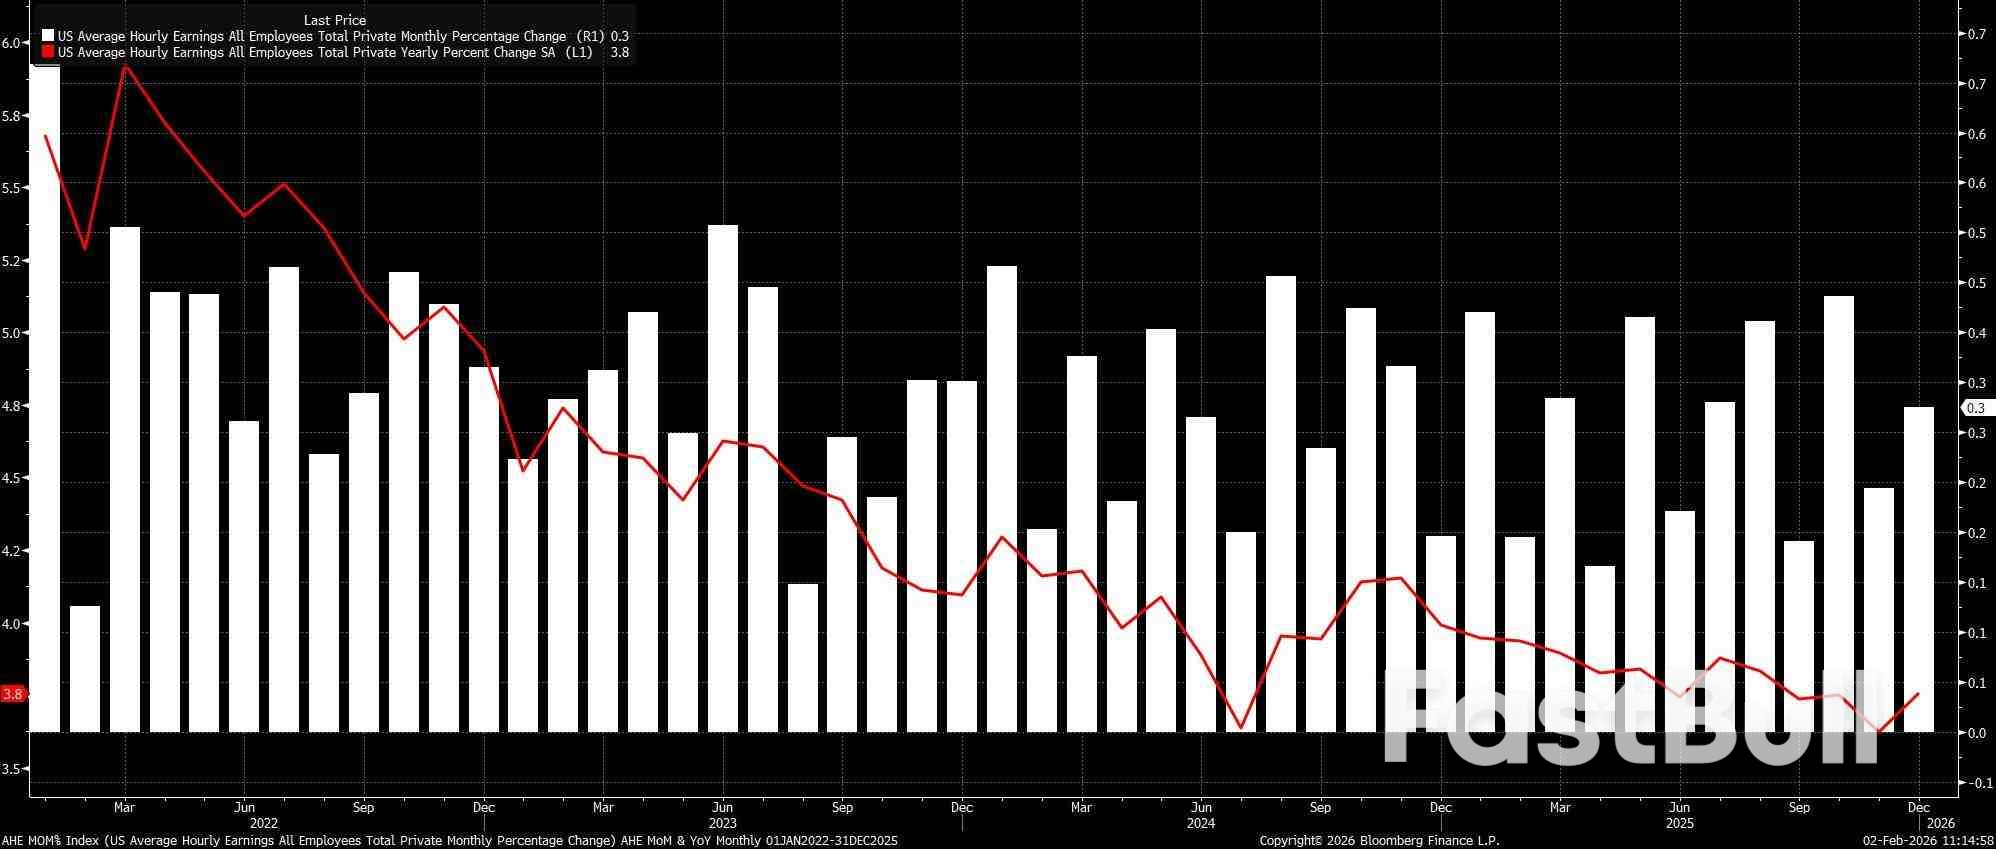
Remaining with the establishment survey, earnings data is unlikely to be of especially much concern from an inflationary perspective, reinforcing the FOMC's view that the labour market is not a significant source of upside price risks at the present juncture.
Average hourly earnings are set to have risen by 0.3% MoM in January, unchanged from the pace seen a month prior, which would in turn see the annual pace dip 0.2pp from the 3.8% YoY seen in December, to 3.6% YoY this time out. Such a pace would, by and large, be broadly compatible with a sustainable return to the 2% inflation aim over the medium-term.

All that said, it is the household survey to which policymakers continue to pay considerably more attention, not least considering Chair Powell's comments regarding headline payrolls growth, and the potential for the NFP print to be overstating job creation by as much as 60k per month. Hence, it is the details of the HH survey which are of much greater importance in terms of triggering shifts in the future policy path.
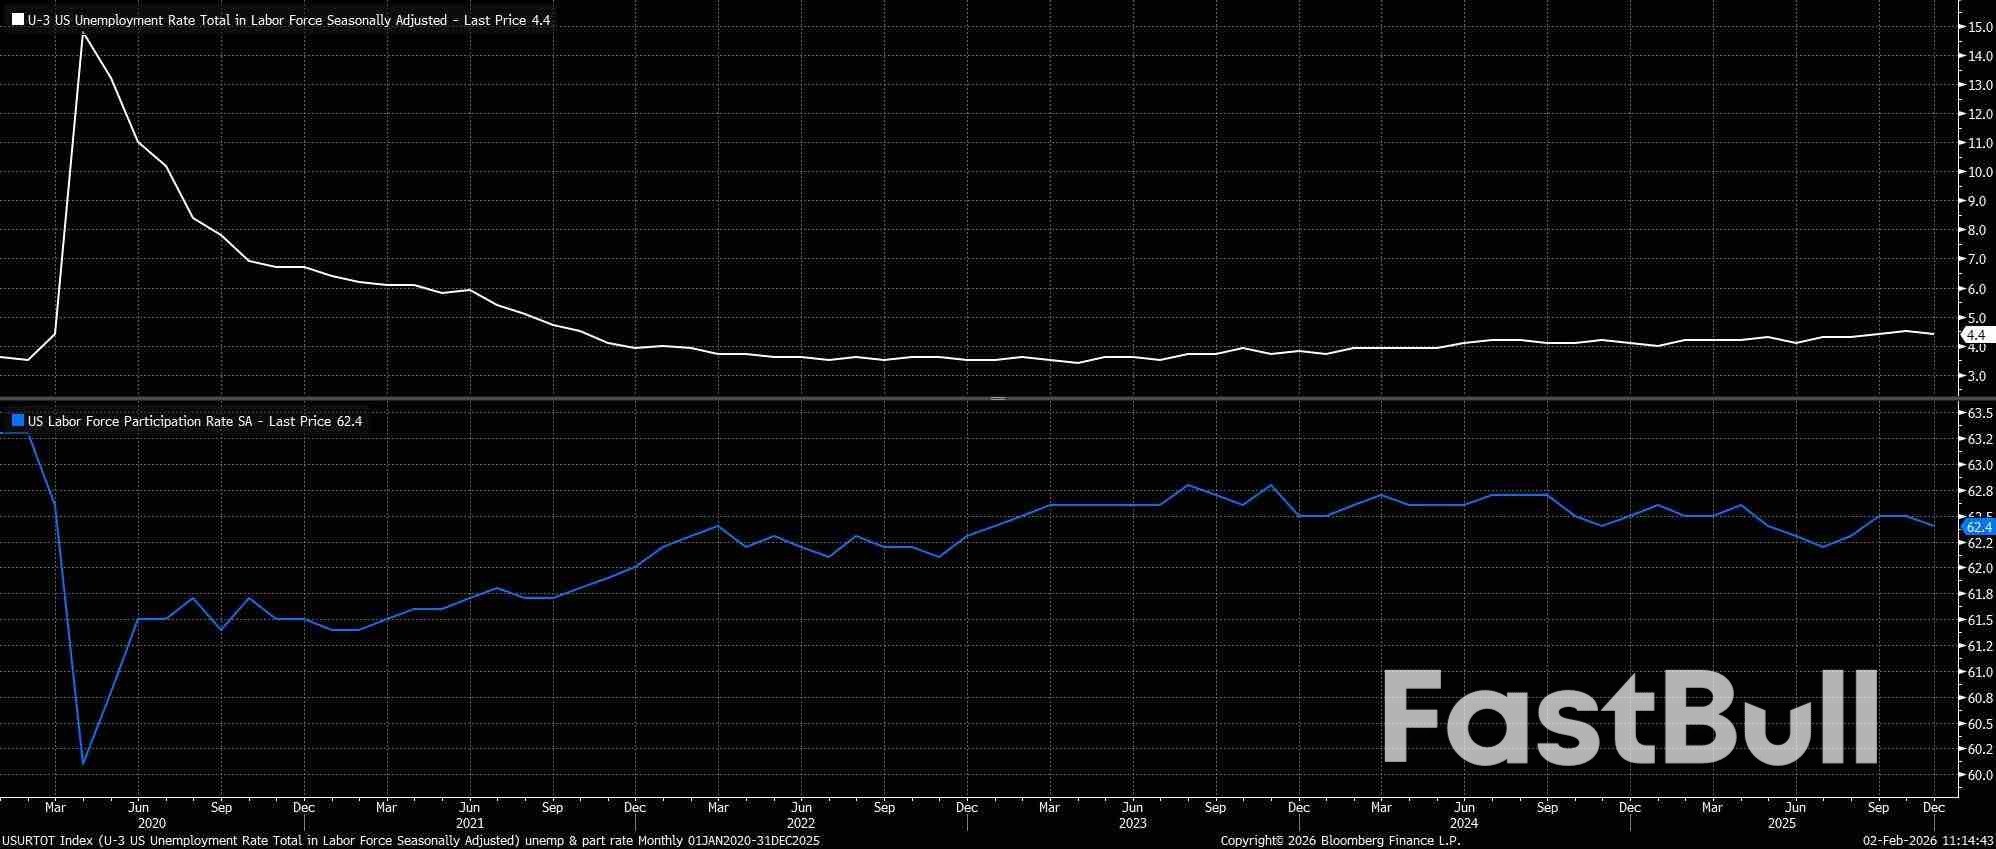
Headline unemployment is seen having held steady at 4.4% in January, having fallen to that level in December from a downwardly revised 4.5% November print. In fact, the December figure was a 'low' one, printing 4.3751% on an unrounded basis with this, and the more promising direction of travel, having given the FOMC confidence to stand pat on policy at their first confab of the year.
Labour force participation also bears watching closely, having fallen 0.1pp to 62.4% in December, implying that the overall size of the labour force had begun to fall, likely a result of the unemployed having given up their job searches. Participation should remain unchanged at that level this time out.

As noted, the FOMC stood pat on policy at the January meeting, while shifting to more of a 'wait and see' approach, with Chair Powell noting that policy is now 'well-positioned' moving forwards. With that in mind, we can reasonably conclude that the majority of the Committee are comfortable that the 75bp of 'insurance' cuts that were delivered at the tail end of last year will provide adequate support against potential downside labour market risks.
That said, while the base case now suggests that the fed funds rate will remain unchanged until at least June, when Kevin Warsh is due to take over as Chair, risks to this outlook skew in a dovish direction, not least considering the incredibly narrow breadth of hiring currently being seen. Hence, any signs of renewed labour market softness are likely to lead to a dovish repricing of market expectations, especially with just 9bp of easing discounted by the USD OIS curve between now and April. The FOMC, however, shan't overreact to a single datapoint, particularly with the February jobs report also due before the next meeting, in March.
Canada's manufacturing sector showed signs of life in January, expanding for the first time in a year as business sentiment reached a three-month high. However, the positive momentum was tempered by persistent weakness in new orders and growing cost pressures fueled by trade tariffs.
The S&P Global Canada Manufacturing Purchasing Managers' Index (PMI) registered 50.4 in January, a notable increase from December's 48.6. A reading above the 50.0 threshold signals expansion, marking the index's best performance since it hit 51.6 in January of the previous year.
The January data indicates a potential turning point for Canadian manufacturers. Paul Smith, economics director at S&P Global Market Intelligence, noted that the sector "started the new year on a more positive footing."
Key drivers behind the improved PMI figure include:
• Stabilized Output: Production steadied after nearly a full year of continuous contraction.
• Renewed Hiring: The employment index rose to 50.6 from 48.7, reflecting marginal jobs growth for the first time in 12 months.
• Improved Confidence: Firms reported a better outlook, driven by expectations of economic growth this year.
• Inventory Growth: The stocks of purchases index climbed to 50.1 from 47.9 in December.
According to S&P Global, this growth was largely a result of companies clearing backlogs of work and introducing new products to the market.
Despite the headline expansion, underlying demand remains weak. The new orders index, while improving to 49.3 from 47.3, still indicated a contraction in new business.
Export performance was a significant concern, with the new export orders index at a low 44.6, up only slightly from 43.9 in December. This decline was attributed to sustained weakness in foreign demand, particularly from the United States. Manufacturers specifically cited that tariffs continued to negatively affect international trade.
Cost inflation accelerated significantly in January, posing another major challenge. The input price index, a measure of inflation for manufacturers, jumped to 59.0 from 56.9 in the prior month, reaching a five-month high.
Tariffs were identified as a key driver behind the rising costs. In response, manufacturers increased their own selling prices at the fastest rate since March 2025, passing on the higher expenses to their customers.
Experts view the current situation as a mix of resilience and significant risk. Smith described the latest survey data as pointing to an "underlying resilience in the manufacturing economy." However, he cautioned that "ongoing inflation and trade uncertainties seem set to remain dominant themes in 2026" and will be the "primary challenges to navigate."
This sentiment was echoed by Bank of Canada Governor Tiff Macklem, who recently highlighted the high level of uncertainty stemming from Trump's trade policy and other geopolitical risks. In an interview, he stated that he anticipated the potential for a new economic shock, underscoring the precarious environment facing Canadian manufacturers.
as of 31 January 2026. Past performance is not a reliable indicator of future performance.
The U.S. Treasury is poised to keep its auction sizes for notes and bonds unchanged for the eighth consecutive quarter this week, signaling a continued reliance on short-term bills to manage the nation's fiscal deficit.
While stability is the baseline expectation, investors are closely watching for any hints about future strategy. Key questions revolve around potential increases in coupon issuance down the road or any surprising cuts to long-dated debt auctions, a move that would align with the Trump administration's goal of lowering long-term borrowing costs.
Guneet Dhingra, head of U.S. rates strategy at BNP Paribas, anticipates that any initial increase in coupon auction sizes will be concentrated at the shorter end of the curve. "If they increase the coupon auction sizes, it's probably going to be in 2027 and it's going to focus on twos and threes," he noted, referring to two- and three-year notes.
This aligns with the Treasury's statement from its November refunding announcement, which mentioned that it was starting to consider future increases in auction sizes for notes and bonds but did not specify which maturities.
The Treasury will release two key documents this week:
• Quarterly borrowing estimates on Monday at 3 p.m. EST (2000 GMT).
• Quarterly refunding details on Wednesday at 8:30 a.m. EST (1330 GMT).
The refunding announcement will detail financing plans for the first and second quarters, setting the auction sizes for three-year notes, 10-year notes, and 30-year bonds. These forecasts will also provide crucial insight into the Treasury's assumptions for April tax receipts and clarify how the Federal Reserve's recent bill purchases are factoring into the government's debt issuance strategy.
In November, the Treasury projected it would need to borrow $578 billion in the first quarter of 2026, assuming an end-of-March cash balance of $850 billion.
However, analysts at J.P. Morgan recently forecast that financing needs for the quarter could be lower, at just $498 billion. This revised outlook is partly due to the Federal Reserve's reserve management purchases (RMPs), a program involving the purchase of $40 billion in short-term bills per month. By buying these bills, the Fed reduces the amount of debt the Treasury needs to sell to the private market.
While the Fed's bill-buying is expected to remain high until April before slowing, the potential nomination of former Fed Governor Kevin Warsh as the next central bank chief could lead to a reassessment of the program, as Warsh has previously advocated for shrinking the Fed's balance sheet.
Furthermore, Morgan Stanley analysts point to smaller-than-expected fiscal deficits projected for 2025–2027, driven by higher-than-forecast tariff revenues. A smaller deficit reduces the pressure on the Treasury to issue more debt, giving it greater flexibility to maintain current auction sizes for longer.
The Treasury's preference for T-bills over long-term bonds is a strategic response to current market conditions. With the Federal Reserve holding its benchmark interest rate in a 3.50%-3.75% range, the opportunity cost of holding longer-dated bonds has risen, forcing investors to demand higher yields for that part of the curve.
By issuing more short-term T-bills, which carry lower yields than long-term bonds, the Treasury can borrow money at a cheaper rate and reduce its immediate interest expenses. Treasury Secretary Scott Bessent has stated that increasing the issuance of long-term bonds at today's elevated yields is simply not cost-effective.
"I think the Treasury is particularly sensitive to making any adjustments to long-end issuance anytime soon," said Zachary Griffiths, head of investment grade and macro strategy at CreditSights. He added that the Treasury will likely "wait as long as possible as they explore these other avenues to finance what's ultimately an elevated deficit."
While unlikely, some market participants have speculated that the Treasury could take a more aggressive approach by cutting long-term bond auctions. The goal of such a move would be to reduce yields on the long end of the curve and, by extension, lower rates for things like mortgages.
However, analysts from J.P. Morgan and Morgan Stanley view this scenario as improbable. J.P. Morgan noted that such a decision "would be a significant pivot from last quarter's guidance" and that a "swift 180-degree pivot would not be consistent with a 'regular and predictable' approach to debt management strategy." For now, the focus remains on funding the government's needs through a steady and predictable supply of debt, heavily weighted toward the short end.
With 'hard' data sustaining signs of solid growth (e.g. factory orders and jobless claims), 'soft' survey data has been bouncing back since the start of the year

This morning we get the final Manufacturing PMI data from S&P Global and ISM for January.
A solid and stronger improvement in US manufacturing sector operating conditions (52.4 vs 52.0 exp) was signaled by January's S&P Global PMI data amid the joint-sharpest upturn in production since May 2022.
However, growth was in part driven by inventory building as new orders, despite returning to expansion in January, increased only modestly.
ISM's Manufacturing was expected to rise from 47.9 to 48.5 in January but instead it soared to 52.6 - its highest since Aug 2022. This is the first print above 50 since January 2025.

This was the biggest MoM surge in the ISM print since April 2020 (COVID rebound), led by a huge surge in new orders and rise in employment (highest in a year) and prices (though elevated) are stable...

"News of the joint largest rise in factory production since May 2022 is tainted by reports of ongoing subdued sales growth," says Chris Williamson, Chief Business Economist at S&P Global Market Intelligence.
"Production growth consequently significantly outpaced that of new orders at the start of the year, resulting in a further accumulation of unsold warehouse inventory."
"Over the past three months, the survey indicates that factories have typically produced more goods than they have sold to a degree we have not previously seen since the global financial crisis back in early 2009."
This highly unusual situation is clearly unsustainable, hinting at risks of a production slowdown and a potential knock-on effect on employment, unless demand improves markedly in the coming months.
Williamson adds that "sluggish sales and order book growth are being commonly linked to customer resistance to high prices, in turn often blamed on tariffs, as well as increased uncertainty over the economic outlook."
While just below trend, business growth expectations for the year ahead are, however, holding up as firms anticipate improving demand, "thanks in part to lower interest rates, reduced import competition due to tariffs, and more government support."
However, as Williamson concludes, "political uncertainty remains a key drag on business sentiment."
The European Union's shift away from Russian gas was meant to secure its energy future. Instead, it has created a new and unsettling dependency on U.S. liquefied natural gas (LNG), and officials in Brussels are starting to sound the alarm.
EU Energy Commissioner Dan Jorgensen recently voiced the growing consensus among European leaders, stating, "I definitely hear this when speaking to energy ministers and heads of state from all over Europe that there is a growing concern." This anxiety marks a stark reversal from just a few years ago when the bloc celebrated its pivot to American energy.
In 2022, the EU made a decisive move to punish Russia for its invasion of eastern Ukraine by replacing Russian pipeline gas with U.S. LNG. At the time, officials hailed American suppliers as reliable partners and framed the decision as a major step toward energy independence.
That strategy has made the European Union the single largest regional buyer of U.S. liquefied gas. But this reliance comes at a high price, and with a different U.S. administration, the perception of America as a steadfast supplier has fundamentally changed.

A major complication comes from the EU's own climate policies. A new regulation requires strict monitoring, tracking, and reporting of methane leaks across the entire LNG supply chain. This policy is now clashing with the operational realities of the world's biggest gas producers.
U.S. Secretary of Energy Chris Wright has stated plainly that American LNG producers do not intend to comply with the EU's stringent rules. QatarEnergy has taken the same position, repeatedly signaling it will not invest in the required methane tracking.
With the world's two largest LNG exporters unwilling to meet its standards, the EU is finding its options severely limited.
The political landscape has also shifted dramatically, shattering the myth of a predictable transatlantic partnership. The "Greenland affair" served as a stark wake-up call for Brussels, demonstrating that the U.S. under President Trump operates on a different set of assumptions regarding trade and security guarantees.
European leaders had previously assumed business would continue as usual. Trump, however, has prioritized collecting on what he sees as debts, demanding higher NATO spending and imposing import tariffs. This transactional approach has eroded confidence in the U.S. as a stable, long-term energy partner.
As concerns mount, the EU is scrambling to find other sources. Commissioner Jorgensen mentioned exploring deals with Qatar, Canada, and Algeria. However, the path to diversification is filled with obstacles:
• Qatar remains non-compliant with the EU's methane regulations.
• Russia is off the table due to sanctions, with a full ban on Russian gas imports approved to begin next year.
• No other single supplier has the capacity to replace the sheer volume of LNG currently coming from the United States.
This leaves European gas buyers with the difficult task of scouring global markets for smaller volumes to piece together a diversification strategy, a far cry from the security they once sought.
Compounding the problem is a trade deal signed by Commission President Ursula von der Leyen and President Trump, which commits the EU to importing $250 billion worth of U.S. energy annually until 2027.
While the EU has not physically been able to purchase this amount, the deal has successfully pushed the bloc to buy record-high volumes of American LNG and oil. This agreement locks Europe into its U.S. dependency, leaving it with little room to maneuver. As President Trump has repeatedly shown, he plays by his own rules, leaving the EU to navigate an increasingly uncertain energy future.
White Label
Data API
Web Plug-ins
Poster Maker
Affiliate Program
The risk of loss in trading financial instruments such as stocks, FX, commodities, futures, bonds, ETFs and crypto can be substantial. You may sustain a total loss of the funds that you deposit with your broker. Therefore, you should carefully consider whether such trading is suitable for you in light of your circumstances and financial resources.
No decision to invest should be made without thoroughly conducting due diligence by yourself or consulting with your financial advisors. Our web content might not suit you since we don't know your financial conditions and investment needs. Our financial information might have latency or contain inaccuracy, so you should be fully responsible for any of your trading and investment decisions. The company will not be responsible for your capital loss.
Without getting permission from the website, you are not allowed to copy the website's graphics, texts, or trademarks. Intellectual property rights in the content or data incorporated into this website belong to its providers and exchange merchants.
Not Logged In
Log in to access more features
Log In
Sign Up