

Markets
News
Analysis
User
24/7
Economic Calendar
Education
Data
- Names
- Latest
- Prev


Signal Accounts for Members
All Signal Accounts
All Contests
 France Industrial Output MoM (SA) (Oct)
A:--
F: --
France Trade Balance (SA) (Oct)A:--
F: --
 Euro Zone Employment YoY (SA) (Q3)
A:--
F: --
 Canada Part-Time Employment (SA) (Nov)
A:--
F: --
P: --
Canada Unemployment Rate (SA) (Nov)A:--
F: --
P: --
Canada Full-time Employment (SA) (Nov)A:--
F: --
P: --
Canada Labor Force Participation Rate (SA) (Nov)A:--
F: --
P: --
Canada Employment (SA) (Nov)A:--
F: --
P: --
 U.S. PCE Price Index MoM (Sept)
A:--
F: --
P: --
U.S. Personal Income MoM (Sept)A:--
F: --
P: --
U.S. Core PCE Price Index MoM (Sept)A:--
F: --
P: --
U.S. PCE Price Index YoY (SA) (Sept)A:--
F: --
P: --
U.S. Core PCE Price Index YoY (Sept)A:--
F: --
P: --
U.S. Personal Outlays MoM (SA) (Sept)A:--
F: --
U.S. 5-10 Year-Ahead Inflation Expectations (Dec)A:--
F: --
P: --
U.S. Real Personal Consumption Expenditures MoM (Sept)A:--
F: --
U.S. Weekly Total Rig CountA:--
F: --
P: --
U.S. Weekly Total Oil Rig CountA:--
F: --
P: --
U.S. Consumer Credit (SA) (Oct)A:--
F: --
 China, Mainland Foreign Exchange Reserves (Nov)
A:--
F: --
P: --
 Japan Trade Balance (Oct)
A:--
F: --
P: --
Japan Nominal GDP Revised QoQ (Q3)A:--
F: --
P: --
China, Mainland Imports YoY (CNH) (Nov)A:--
F: --
P: --
China, Mainland Exports (Nov)A:--
F: --
P: --
China, Mainland Imports (CNH) (Nov)A:--
F: --
P: --
China, Mainland Trade Balance (CNH) (Nov)A:--
F: --
P: --
China, Mainland Exports YoY (USD) (Nov)A:--
F: --
P: --
China, Mainland Imports YoY (USD) (Nov)A:--
F: --
P: --
 Germany Industrial Output MoM (SA) (Oct)
A:--
F: --
Euro Zone Sentix Investor Confidence Index (Dec)A:--
F: --
P: --
Canada National Economic Confidence Index--
F: --
P: --
 U.K. BRC Like-For-Like Retail Sales YoY (Nov)
--
F: --
P: --
U.K. BRC Overall Retail Sales YoY (Nov)--
F: --
P: --
 Australia Overnight (Borrowing) Key Rate
--
F: --
P: --
RBA Rate Statement RBA Press Conference Germany Exports MoM (SA) (Oct)--
F: --
P: --
U.S. NFIB Small Business Optimism Index (SA) (Nov)--
F: --
P: --
 Mexico 12-Month Inflation (CPI) (Nov)
--
F: --
P: --
Mexico Core CPI YoY (Nov)--
F: --
P: --
Mexico PPI YoY (Nov)--
F: --
P: --
U.S. Weekly Redbook Index YoY--
F: --
P: --
U.S. JOLTS Job Openings (SA) (Oct)--
F: --
P: --
China, Mainland M1 Money Supply YoY (Nov)--
F: --
P: --
China, Mainland M0 Money Supply YoY (Nov)--
F: --
P: --
China, Mainland M2 Money Supply YoY (Nov)--
F: --
P: --
U.S. EIA Short-Term Crude Production Forecast For The Year (Dec)--
F: --
P: --
U.S. EIA Natural Gas Production Forecast For The Next Year (Dec)--
F: --
P: --
U.S. EIA Short-Term Crude Production Forecast For The Next Year (Dec)--
F: --
P: --
EIA Monthly Short-Term Energy Outlook U.S. API Weekly Gasoline Stocks--
F: --
P: --
U.S. API Weekly Cushing Crude Oil Stocks--
F: --
P: --
U.S. API Weekly Crude Oil Stocks--
F: --
P: --
U.S. API Weekly Refined Oil Stocks--
F: --
P: --
 South Korea Unemployment Rate (SA) (Nov)
--
F: --
P: --
Japan Reuters Tankan Non-Manufacturers Index (Dec)--
F: --
P: --
Japan Reuters Tankan Manufacturers Index (Dec)--
F: --
P: --
Japan Domestic Enterprise Commodity Price Index MoM (Nov)--
F: --
P: --
Japan Domestic Enterprise Commodity Price Index YoY (Nov)--
F: --
P: --
China, Mainland PPI YoY (Nov)--
F: --
P: --

No matching data
Latest Views
Latest Views
Trending Topics
Top Columnists
Latest Update
White Label
Data API
Web Plug-ins
Affiliate Program
View All
No data
Nvidia (NVDA.O), opens new tab is seeking a site in Shanghai for a research and development centre...
Nvidia (NVDA.O), opens new tab is seeking a site in Shanghai for a research and development centre, three sources close to the matter said, reflecting the strategic significance of the Chinese market where U.S. curbs on advanced chip exports have hit sales.
The U.S. chipmaker began the search in early 2025 and is primarily evaluating locations in Shanghai's Minhang and Xuhui districts, one of the sources said.
The project gained momentum after a surprise visit to China by Nvidia CEO Jensen Huang last month, said two of the sources.
Huang, who has consistently said China is critical to Nvidia's growth, made his visit immediately after the U.S. placed new restrictions on China-bound shipments of its H20 chips, the only AI chip the company can sell legally in China.
Huang met senior Chinese officials, including Vice Premier He Lifeng and Shanghai's mayor Gong Zheng.
Reuters reported earlier this month that Nvidia plans to release a downgraded version of the H20 chip for China in the next two months, as it seeks to prop up sales in the country, where it has been lost market share to domestic rivals such as Huawei.
China generated $17 billion in revenue for Nvidia in the fiscal year ending January 26, accounting for 13% of the company's total sales.
The local government of Shanghai, which hosts China's largest foreign business community, including firms such as Tesla (TSLA.O), opens new tab, has expressed willingness to offer incentives for the Nvidia project, including tax reductions, said two of the sources.
The local authorities are also considering offering a substantial amount of land to Nvidia for its China R&D centre, one source added.
Nvidia declined to comment, while the Shanghai city government did not immediately respond to a request for comment. The sources declined to be named, as the plan is not public.
Following his visit to China, Huang told CNBC that the country's AI market could reach approximately $50 billion within the next two-to-three years.
He said that being excluded from this rapidly expanding sector would represent a "tremendous loss" for Nvidia, especially as competition with Huawei intensifies.
During an earnings call in February, before H20 chip sales to China were restricted, Nvidia executives said the company's sales to China were about half the level before U.S. export controls.
Since 2022, the U.S. government has imposed restrictions on the export of Nvidia's most advanced chips to China, citing concerns over potential military applications.
The Financial Times first reported on Friday about Nvidia's plan to build a R&D centre in China.
Israeli strikes on Gaza have killed more than 250 people since Thursday morning, local health authorities said on Friday, one of the deadliest phases of bombardment since a truce collapsed in March and with a new ground offensive expected soon.
The air and artillery strikes were focused on the northern section of the tiny, crowded enclave, where dozens of people including women and children were killed overnight, said Gaza Health Ministry spokesman Khalil al-Deqran.
Israel has intensified its bombardment and built-up armour along the border despite growing international pressure for it to resume ceasefire talks and end its blockade of Gaza, where an international hunger monitor has warned of famine.
U.S. President Donald Trump on Friday backed aid for the Palestinians, saying people in Gaza are starving and adding that he expected "a lot of good things" in the next month.
Asked whether he supported Israeli plans to expand the war in Gaza, Trump told reporters: "I think a lot of good things are going to happen over the next month, and we're going to see. We have to help also out the Palestinians. You know, a lot of people are starving on Gaza, so we have to look at both sides."
Prime Minister Benjamin Netanyahu said on May 5 that Israel was planning an expanded and intensive offensive against Hamas as his security cabinet approved plans that could involve seizing the entire Gaza Strip and controlling aid.
An Israeli defence official said at the time that the operation would not be launched before Trump concluded his visit to the Middle East, which is expected to end on Friday.
Israel's declared goal in Gaza is the elimination of Hamas, which attacked Israeli communities on October 7, 2023, killing around 1,200 people and seizing about 250 hostages.
Its military campaign has devastated the enclave, pushing nearly all inhabitants from their homes and killing more than 53,000 people according to Gaza health authorities, while aid agencies say its blockade has caused a humanitarian crisis.
Heavy strikes on Friday were reported in the northern town of Beit Lahiya and in the Jabalia refugee camp, where Palestinian emergency services said many bodies were still buried in the rubble.
Israel's military said its air force had struck more than 150 targets across Gaza, saying these included anti-tank missile posts, terrorist cells, military structures and operational centres.
In Jabalia camp in the northern Gaza Strip, men picked through a sea of rubble following the night's strikes, pulling out sheets of metal as small children clambered through the debris.
Around 10 bodies draped in white sheets were lined up on the ground before being taken to hospital. Women sat crying nearby and one lifted a corner of a sheet to gaze at the dead person's face.
Ismail, a man from Gaza City who gave only his first name, described a night of horror. "The non-stop explosions resulting from the airstrikes and tank shelling reminded us of the early days of the war. The ground didn't stop shaking underneath our feet," Ismail told Reuters via a chat app.
"We thought Trump arrived to save us, but it seems Netanyahu doesn't care, neither does Trump," he added.
Israel has faced increasing international isolation over its campaign in Gaza, with even the United States, its staunchest ally, expressing unease over the scale of the destruction and the dire situation caused by its blockade on the delivery of food and other vital aid.
On Thursday, U.S. Secretary of State Marco Rubio said Washington was "troubled" by the humanitarian situation in the enclave.
Netanyahu has dispatched a team to Doha to take part in ceasefire talks with Qatari mediators but he has ruled out concessions, saying Israel remains committed to defeating Hamas.
The Hostages and Missing Families Forum, which represents some of the families and supporters of the 58 hostages still held in Gaza, said that Israel risked missing a "historic opportunity" to bring them home as Trump wound up his visit to the Middle East.
"We are in dramatic hours that will determine the future of our loved ones, the future of Israeli society, and the future of the Middle East," the group said in a statement.
Warren Buffett, the greatest investor of all time, has announced his retirement. Fellow value investors are in a state of shock. Unfortunately, they have more serious problems to consider. For years, their favoured investment style has been out of fashion. Clients have lost patience. In a world in which the U.S. stock market index has delivered consistently outsized returns, low-cost funds that passively track an index seem a no-brainer. Yet the prospects for value investors have always been always brightest when the rest of the world loses faith.
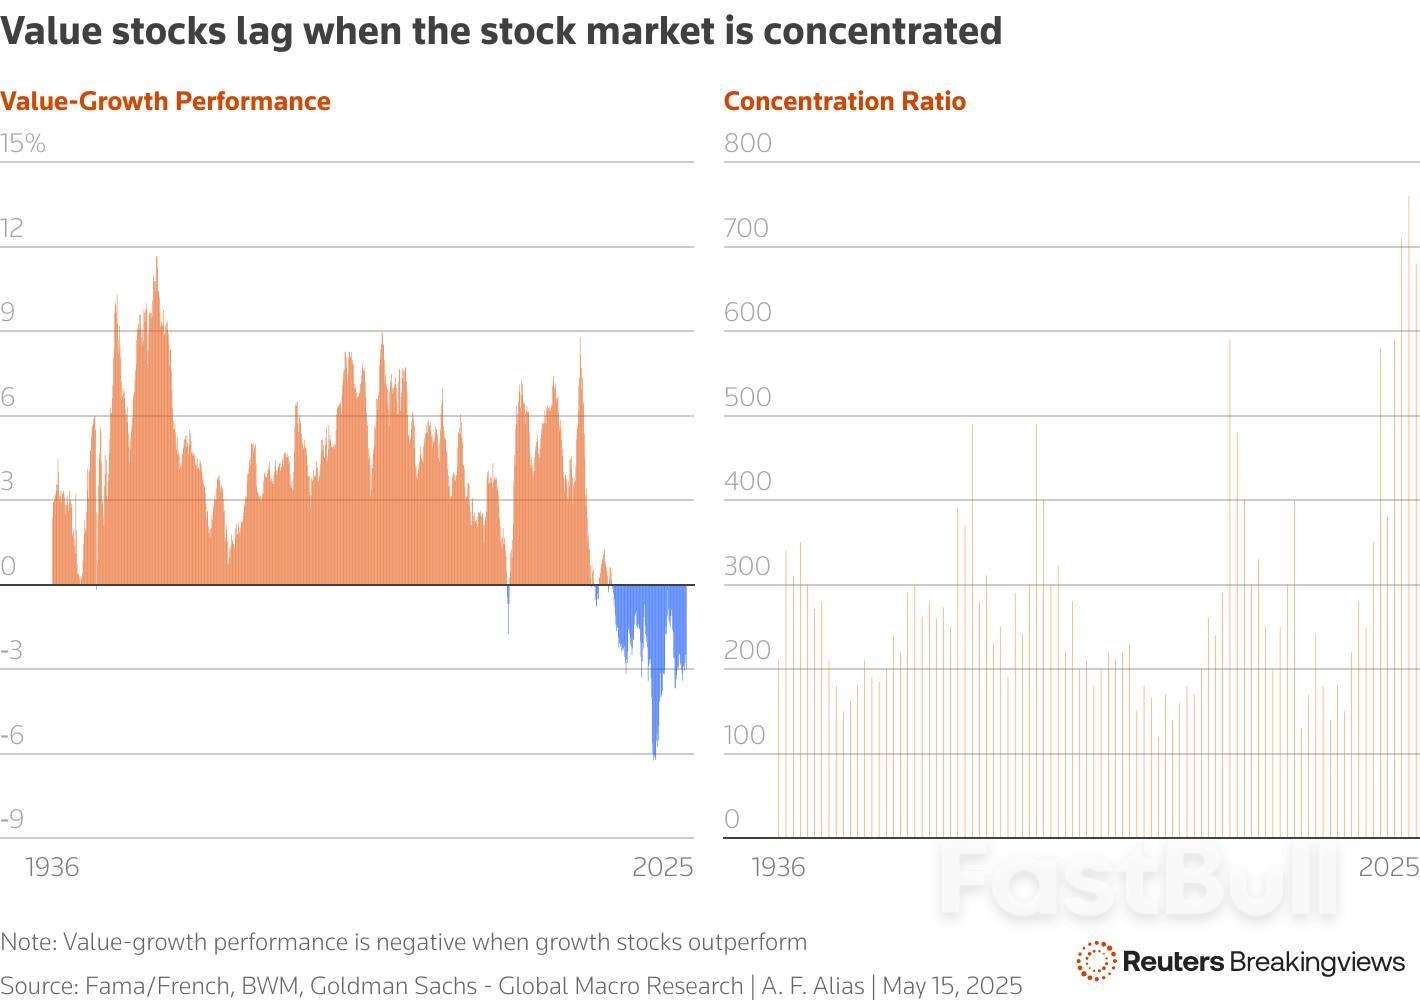
Over the very long run, buying equities at relatively cheap valuations has worked out well. Economists Eugene Fama and Ken French define value as a low ratio of share price to book value. Using this measure, U.S. value stocks have beaten growth stocks, which have high price-to-book ratios, by 2.5% a year since 1926. Value has also outperformed in most other overseas markets, according to the UBS Global Investment Returns Yearbook compiled by Elroy Dimson, Paul Marsh and Mike Staunton. Its luck ran out, however, on the eve of the global financial crisis. Between 2007 and 2020, growth beat value. The latter recovered some ground in 2020 but fell back again after the “Magnificent Seven” big technology stocks took off in late 2022.
It is important to note that price to book is not the metric contemporary value investors rely upon. Warren Buffett’s partner, the late Charlie Munger, taught him to consider a firm’s competitive position – what the Oracle of Omaha called the “moat.” If a business consistently earns above average returns on capital, investors can safely buy its shares at a premium multiple to the rest of the market. Furthermore, the balance sheet value of a company’s assets is not a reliable measure of value, since it excludes many intangible assets such as research and development. Share buybacks and acquisitions further distort accounting book value.
Still, there are other investment oddities to consider. Small-cap stocks, which historically have beaten larger rivals and provide a favourite hunting ground for value investors, have also had a dismal run. Global stock markets, both the developed and emerging variety, have been trounced by the extraordinary performance of U.S. stocks. Between 2010 and the start of this year, American equities had delivered annualised returns of 10% after inflation, according to UBS. Over the same period, the other stock markets have collectively returned 2.6% a year after inflation. Emerging markets returned just half that figure. Howard Marks, the veteran value investor and co-chairman of Oaktree Capital Management, laments that “all norms have been overturned.”
The hard times for value investing can be explained by various factors. First, ultra-low interest rates after the global financial crisis increased the appeal of growth stocks whose profits lie in the distant future. Higher-yielding value stocks were relatively disadvantaged.
Second, value investors have suffered from the rapid expansion of index investing. Nearly 60% of the U.S. stock market is currently held by funds that passively track a benchmark. Goldman Sachs forecasts that between 2014 and 2026 the cumulative outflows from U.S. actively managed equity mutual funds into passive vehicles will reach around $3 trillion. As indexation advances, investors dump the value and small-cap stocks owned by traditional fund managers in favour of the S&P 500 Index (.SPX), opens new tab, which is heavily weighted towards larger and more expensive stocks.
The United States is home to the largest and most profitable companies the world has ever seen. The outsized returns of the Magnificent Seven over the last decade have depressed the relative returns of both value stocks and small caps. By the end of last year, the U.S. stock market had become more concentrated than at any time since the 1930s. Georg von Wyss, a portfolio manager at Zurich-based firm BWM, observes that in the past periods of extreme market concentration have been accompanied by the underperformance of value stocks. This was the case during the “Nifty Fifty” boom of the early 1970s and again in the technology bubble of the late 1990s.
Towards the end of that craze, value stocks were exceedingly cheap relative to the overall market. Clients closed their accounts with underperforming investment firms. Several well-known value managers were either fired or took early retirement. Warren Buffett, who didn’t partake in the market frenzy, was deemed to have lost the plot. But when the boom turned to bust and market concentration declined, as it did in 1975 and 2000, value stocks outperformed for years. Could value investors be on the verge of yet another winning streak?
The turmoil of the early months of Donald Trump’s second term may signal such a shift. At the London Value Investor Conference on Wednesday Richard Oldfield of Oldfield Partners said that the new U.S. administration, with its on-off threat of tariffs and hostile rhetoric to erstwhile allies, poses a risk to trend of “American exceptionalism”. Sensing the loss of U.S. support, Germany is borrowing to invest in defence and infrastructure. If capital flows to the United States start to reverse, developed and emerging stock markets stand to benefit. Value rallies have repeatedly petered out in recent years but, says Oldfield, “this time is different.”
Other headwinds that have buffeted value investors over the past decade may also be about to disperse. Over the past three years, interest rates have returned to more normal levels. The Magnificent Seven are currently locked in an arms race to invest in artificial intelligence. Time will tell whether their vast capital spending delivers an adequate return. These megacap growth stocks have underperformed in the year to date. Meanwhile, value and small-cap stocks in the United States and elsewhere offer exceptional opportunities.
Last year, David Einhorn of Greenlight Capital pronounced that value was “dead, opens new tab”. Another speaker at the London conference, Alissa Corcoran of Kopernik Global Investors refutes this claim. Value investing is immortal, she says. As index funds absorb a greater share of the world’s stock market, fundamental investors are still needed to perform the vital role of price discovery. Ideally, such investors would exhibit a patient, long-term approach and not be swayed by the herd. They should be careful stewards of their clients’ capital, and, above all, be endowed with common sense. Warren Buffett displayed these virtues to an uncommon degree. He will be missed. But there are legions of value investors ready to fill the void.
In a recent column, I argued that US managers have much to learn from emerging markets. Today, I want to add that managers everywhere have much to learn from the interwar years.
The interwar period — marked by the turmoil of the 1920s and the depression of the 1930s — was the last great period of deglobalization. The century between the defeat of Napoleon in 1815 and the outbreak of the First World War in 1914 was an era of pell-mell globalization. International trade grew by 3.5% a year. The gaps in commodity prices between continents declined by four-fifths. Sixty million Europeans migrated to the US. In 1913, foreign direct investment was 9% of world output, a proportion that wasn’t equaled until the 1990s.
The interwar years replaced seemingly unstoppable globalization with seemingly unstoppable deglobalization. The US had never shared Britain’s cast-iron commitment to free trade — in 1870 America, tariffs of 50% were common — but between the wars, protectionism became rampant. Governments not only increased and extended tariffs but also put a near halt to immigration. The annual migration rate to the US fell from 11.6 immigrants per thousand in the first decade of the 20th century to 0.4 per thousand in the 1940s.
European countries responded with tariffs of their own. Governments abandoned gold and imposed currency controls. The Mexican government nationalized foreign oil companies. By the late 1930s, half the world’s trade was restricted by tariffs, and the world was divided into currency blocs. Deglobalization gathered momentum despite the emergence of new technologies such as airplanes, automobiles, telephones, and ocean liners that were relentlessly killing distance.
Multinationals adopted three main strategies to cope with this world of deglobalization and political instability.
The first was to jump over tariff barriers and currency restrictions by establishing powerful foreign subsidiaries. American companies led the way partly because they were so well managed and partly because the US government made life so difficult for foreign companies, particularly banks.
This produced paradoxical results. The number of multinationals increased even as the world fragmented. But successful multinationals put down deep global roots. “The national autonomy of subsidiaries grew as they were closer to the local market and local politicians,” says Geoffrey Jones, a professor at Harvard Business School and author of Multinationals and Global Capitalism. “They unwound global supply chains and produced more stuff locally.” General Motors purchased Opel, one of Germany’s 10 largest industrial companies, and Vauxhall, a smaller British company, and employed local managers to run them. American Home Products, a giant US pharmaceuticals company, rolled up several smaller British firms. Coca-Cola sponsored the 1936 Olympic Games in Berlin.
The second was to use institutional innovation to compensate for political turbulence. Many companies coped with the most obvious downsides of fragmentation, falling demand and unpredictable supply, by either consolidation or coordination. Giant new companies such as Germany’s IG Farben and the UK’s Imperial Chemical Industries in chemicals, Unilever (a merger of Dutch margarine producer Unie with the British soap maker Lever Brothers) in consumer goods and Shell in petrol formed from the merger of smaller companies. Cartels appeared in a wide range of markets (tea, tin, coffee, gold and diamonds, electric lights and matches) either to control prices or divvy up the world into separate spheres. Cartelization produced some of the world’s most powerful companies, such as the Anglo-American Corporation and De Beers in South Africa, and some of its most enduring price-fixing arrangements, such as the Tin Producers Association, which was started in 1929 and only wound up in 1985. The Swiss-registered Electric Light Consortium controlled three-quarters of the global supply of electric lights and was itself controlled from behind the scenes by America’s General Electric, which wasn’t even a member.
Others adopted a new institutional form: the multidivisional firm or “M form” for short. General Motors pioneered the M form under Alfred Sloan’s leadership as a way of coping with the fragmentation of the consumer market: Powerful product managers were given control of producing different models for different consumer markets (Cadillac for the rich and so on down the income pyramid). But that approach turned out to be equally appropriate for a fragmenting geographical market. Both US and German behemoths began devolving enormous operational power to regional managers and restricting the headquarters to producing broad strategic plans.
The third was to treat regional fragmentation as a business opportunity rather than as a barrier to global ambitions. British companies such as Cadbury’s in chocolate and Dunlop in rubber focused on securing supplies and markets across the British Empire and the wider Commonwealth. Barclays purchased banks across Africa. Ford purchased a rubber plantation in Brazil and the United Fruit Company tightened its grip on South American bananas. State-allied oil companies such as Britain’s Anglo-Persian and America’s Standard Oil battled for control of supplies in the disputed Middle East, with plenty of help from the secret services.
Harvard’s Jones is struck by the similarity between today and the 1930s, with technologies working to bring the world together and policy makers and parts of the electorate pushing in the opposite direction. “The first lesson of history,” he says, “is that politics always matters more than technology in the direction of travel.” This means, in my view, that companies would be wise to abandon their “one world” strategies from the heady years of globalization and instead reorganize themselves into federations of national firms that can respond to local circumstances and, if necessary, pretend to be local companies. They also need to embrace anything from mergers to alliances that will give them the bulk to deal with collapses in demand or interruptions in supply: The more unpredictable markets become, the more companies need to do things internally.
But these years contain some powerful moral as well as practical lessons. CEOs can’t be expected to sacrifice their businesses to defend social or political causes of the day far outside their realm of operations. But there are limits to what they ought to tolerate. Some of America’s most successful companies placed no limits on how far they would go to get German business in the 1930s. General Motors’ Opel produced trucks for the Nazi war machine; IBM worked so closely with the Nazi regime that its boss, Thomas J. Watson Sr., was awarded the Order of the German Eagle in 1937. CEOs will be judged by their investors on how well they adapt to a rapidly deglobalizing world, but they will also be judged by history if they lose their moral compass in order to bow to the will of autocrats and scoundrels.
Ether's ETH$2,616.44 rally, though impressive, leaves much to be desired. That's because the unwinding of shorts is said to be fueling the rally, not fresh longs or bullish leveraged bets on the Chicago Mercantile Exchange (CME).
"The rally is primarily the result of short covering – traders unwinding bearish positions – rather than a surge of bullish conviction," Sui Chung, CEO of crypto index provider CF Benchmarks, told CoinDesk. CME's derivatives, preferred by institutions, track the CF Benchmarks' Bitcoin Reference Rate – New York (BRRNY) variant.
When bears cover their shorts, it means they are buying back futures contracts initially sold. This action of short covering temporarily boosts demand in the market, putting upward pressure on prices.
Chung pointed to the still-low CME futures premium (basis) as evidence that the rally is led by short covering.
While ether's spot price has surged nearly 90% to above $2,600 since the early April sell-off, the annualized one-month basis in the CME's ether has held flat between 6% and 10%, according to data source Velo.
"In more conventional setups, we would expect rising basis levels if traders were initiating fresh longs with leverage," Chung noted. "It's a reminder that not all rallies are fueled by new demand; sometimes, they reflect repositioning and risk reduction."
One might argue that the basis has held steady due to sophisticated trades "arbing" away the price difference between the CME ETH futures and the spot index price by shorting futures and buying ETH spot ETFs.
That argument looks weak when considering the U.S.-listed spot ETFs have seen net positive inflows on just ten trading days in the past four weeks. Besides, net inflows tallied over $100 million just once, according to the data source SoSoValue.
"The lack of inflows into ETH ETFs and the muted basis paints a different picture, this latest move higher doesn't appear to be driven by new leveraged longs," Chung said.
Key points in this update:
Global financial markets responded very enthusiastically this past week to news that the US and China had agreed to a 90-day pause in their escalating trade war, for now reducing punitive tariffs that were beginning to hurt both economies, threatening a recession in the US and a slowdown in China’s export-driven economy. This de-escalation provided what may still turn out to be temporary relief to markets, with global equity markets and pro-cyclical commodities staging a comeback while haven demand for gold faded.
The announcement of a 90-day truce in trade tensions prompted a swift and strong reaction from the global shipping industry. The Drewry Global Container Index—a key benchmark that tracks weekly freight rates for container shipping across major international routes showed a jump in the Shanghai–Los Angeles and Shanghai–New York lanes by 15.6% and 19.3%, respectively. The notable rebound on these routes reflects a renewed wave of frontloading activity, as exporters and importers in both China and the United States rush to ship goods ahead of any potential re-escalation of tariffs once the truce expires. Yet, the overall index remains down around 40% this year amid rising container capacity and tariff threats to global trade.
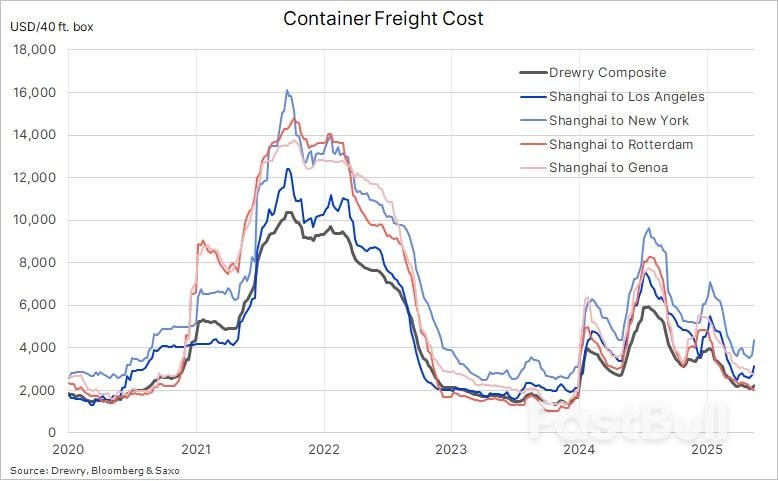 Drewry Global Container Freight Indices
The risk-on rally saw the tech-heavy Nasdaq reach February levels, reversing most of its tariff-related weakness, while USD bears were challenged and US Treasury yields, especially at the long end, rose to levels that raised a few eyebrows, not least considering an urgent need to bring down funding costs to service a growing fiscal deficit. Economic data in the US showed the first albeit small signs of what may come in the coming months as tariffs start to impact consumers. While prices paid to US producers unexpectedly declined by the most in five years, suggesting companies, for now, are absorbing some of the hit from higher tariffs. Separate data for April showed growth in retail sales decelerated while factory production declined for the first time in six months, and confidence fell for a third month.
All signs indicate that the near-term economic outlook, not only in the US but also abroad—note Japan’s economy shrank for the first time in a year—remains challenged and vulnerable even before sustaining the full impact of Trump’s tariff measures. With this in mind, the prospect for additional dollar gains remains limited while the next rate cut from the US Federal Reserve is not a question of if but when they will cut next time; note the market is currently pricing in fully two 25-basis point cuts this year, followed by another two next year.
Overall, the trade truce initially gave pro-cyclical commodities, such as energy and industrial metals a boost, before fading amid economic data weakness, leading the Bloomberg Commodity Index towards a weekly loss around 1.8%, lowering the year-to-date gain to 3.8%. Weighing on the index which tracks a basket of 24 major commodities futures spread almost evenly between energy, metals and agricultural, were a steep 9.6% loss in natural gas, and 5% drop in gold, two commodities that together with Arabica coffee (-6%) accounts for around 25% of the index. At the other end of the spectre, cocoa – a non-BCOM member - surged higher almost 19% and back above USD 11,000 tons amid renewed concerns about the quality and size of the current crop being harvested in West Africa.
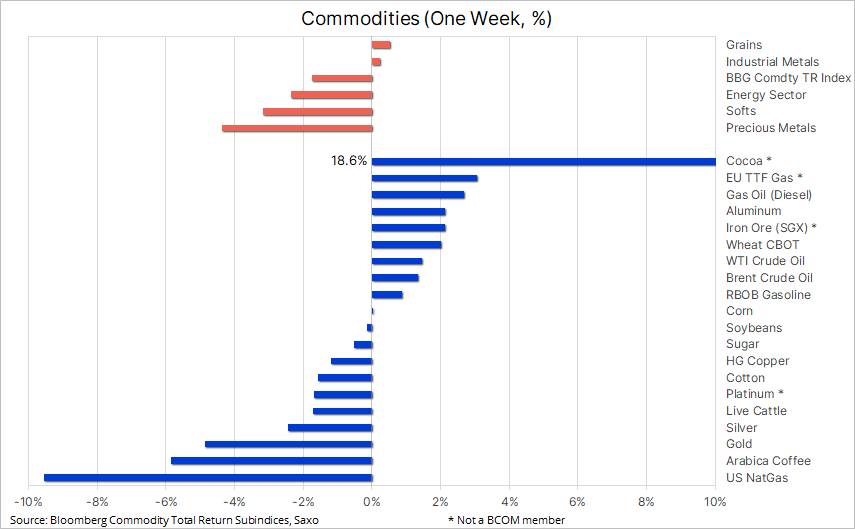 Key commodities: one week performances
Gold has experienced its sharpest correction—both in absolute and percentage terms—since 2023, breaking through multiple technical support levels. The initial trigger was a fading of safe-haven demand following the US-China 90-day trade truce. However, prices have since found renewed support amid a weakening dollar and falling bond yields, driven by a batch of softer-than-expected U.S. economic data.
Having already hit our 2025 price target of USD 3,500, we are currently adopting a wait-and-see approach. The market remains caught between profit-taking from those selling into strength and renewed interest from dip buyers. Despite the recent pullback, several key structural drivers—including central bank buying, geopolitical risks, fiscal debt concerns, and inflation hedging—remain intact. These are likely to underpin prices over the longer term, though a period of consolidation may be required before the next significant upside catalyst emerges.
Investor flows will be critical to watch going forward, particularly in China, where demand from retail investors through yuan-denominated ETFs has been a key source of support before recently fading. In contrast, Western-based ETF holdings have seen net outflows since late April, contributing to the softer price environment. Meanwhile, speculative positioning in COMEX futures has turned increasingly bearish, with managed money and other reportables reducing their net long exposure by 42% over the past seven weeks. This highlights the need for a fresh technical breakout or macro catalyst to entice these key participants back to the buy side.
While gold fell sharply, silver and platinum also declined but were partially shielded by their industrial use cases. Optimism around U.S.-China trade relations has lent support to growth-sensitive commodities, tempering the downside in these two metals. The gold-silver ratio has since pulled back below 100, after spiking above 105 in early April.
Platinum has underperformed both on a relative and absolute basis over the past decade. Once at parity with gold, it now trades at a ratio of 3.2:1, while its average price of USD 955 per oz over the past 17 years is just below current levels. This underperformance comes despite three consecutive years of structural deficits. According to Johnson Matthey, primary supply is expected to fall by 3% in 2025 to 5.54 million troy ounces, while demand is seen slipping 2.6% to 7.66 million ounces. Yet investment flows remain weak amid macroeconomic uncertainty, trade risks, and a softening outlook for the automotive sector, platinum’s largest demand driver.
Platinum remains trapped in a narrowing technical range. A breakout could provide the spark for renewed speculative interest. Until then, COMEX-managed money accounts remain largely neutral. We are closely watching USD 1,010 as near-term resistance and USD 1,025 as the more significant downtrend level stemming from the 2008 highs.
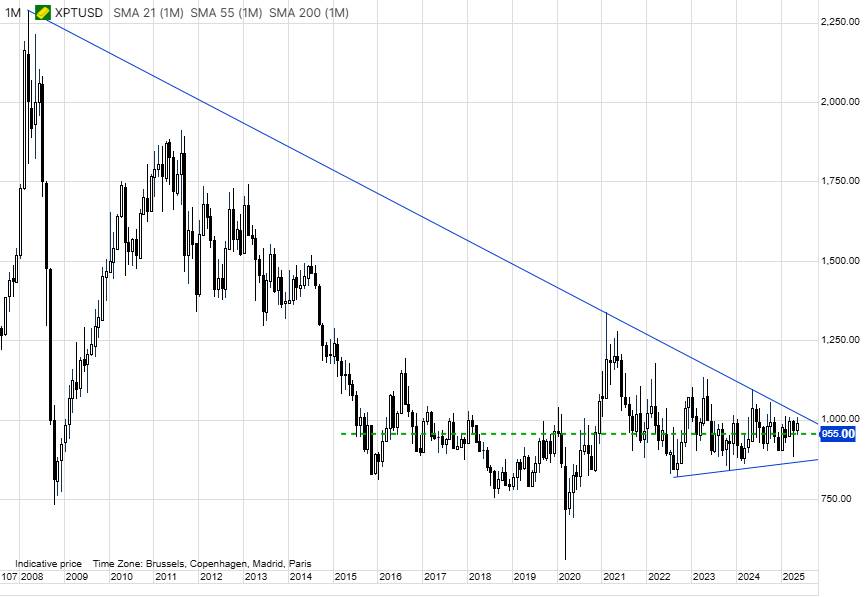 Spot Platinum (XPTUSD) - Source: SaxoTraderGO
Benchmark copper prices in London were heading for a small weekly gain, extending a rebound from a 13-month low hit in April, as investors weigh tightening supply against a clouded economic outlook. The tightness has primarily been driven by a major transfer of copper to the US ahead of an expected tariff announcement, leaving the rest of the world, which accounts for more than 90% of global demand, with lower supplies.
Since the US opened a probe into the copper market back in February, potentially leading to an implementation of tariffs on imports similar to the 25% tariff on all steel and aluminium imports that came into force this month, the spread between the High Grade contract on COMEX in New York and the global LME benchmark in London has seen a great deal of volatility, culminating at the end of March when the premium reached 16%.
A level that helped trigger a massive, and ongoing surge in shipments of copper to the US, leading to a surge in copper stocks in COMEX-monitored warehouses to the highest since 2018, well above what is needed. As a result, and despite the risk of a 25% tariff being introduced, the premium over London has come down to around 7% on a combination of softer COMEX and firmer LME prices. Ample supply within the US has now created a glut that would delay the price impact of an eventual tariff introduction.
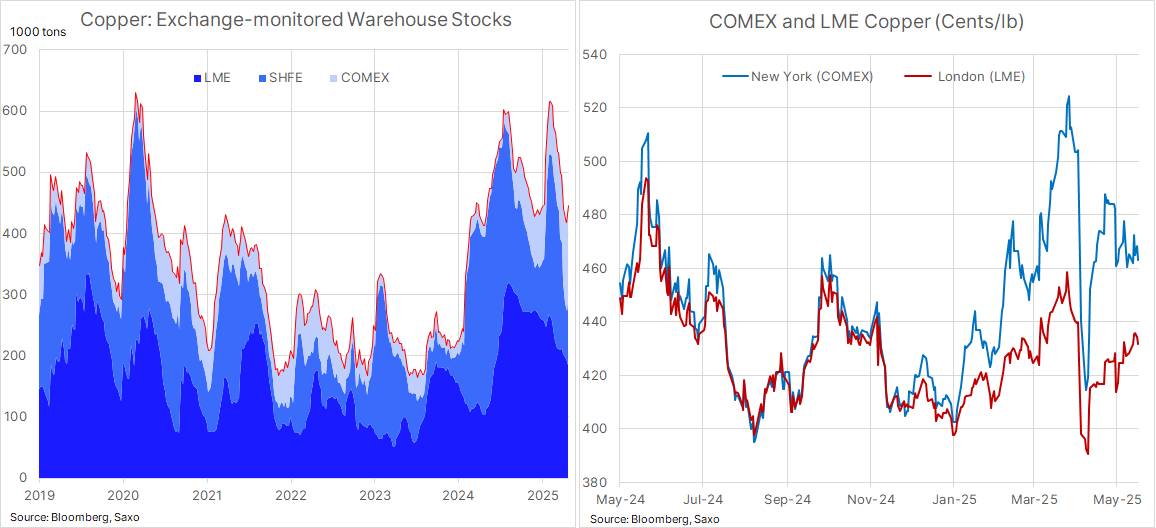 Exchange monitored copper stocks and COMEX and LME prices
Following the early April price collapse, both WTI and Brent—widely regarded as the two global benchmarks for crude oil—have settled into broad, yet volatile, $10-per-barrel trading ranges. WTI has fluctuated between $55 and $65, while Brent has moved between $58.5 and $68.5. Market sentiment continues to alternate between concerns over rising global supply and the potential economic fallout from ongoing global trade tensions.
Over the past week, a fresh attempt to push prices higher—driven by renewed hopes from U.S.-China trade negotiations—was only partially successful. Gains were quickly reversed amid bearish supply-side developments. U.S. crude inventories posted another increase, and the Energy Information Administration (EIA) reported a 10% decline in the four-week average of U.S. crude oil exports. This drop brought export levels well below seasonal averages from the past two years and may indicate weakening demand among key buyers in Europe and Asia.
Meanwhile, the International Energy Agency (IEA) has warned of a global oil glut both this year and next, citing a combination of robust supply growth and slower-than-expected demand expansion. The potential revival of the Iran nuclear deal could further aggravate this imbalance by bringing additional barrels to market. This would add to the already announced output increases from eight OPEC+ members, spearheaded by Saudi Arabia.
In the short term, we expect oil prices to continue oscillating within their current ranges. Market participants remain focused on four key uncertainties: developments in global trade negotiations, lower prices’ potential negative impact on supply from high-cost producers, the extent of future production increases from OPEC+ members, and whether the group can rein in persistent quota violations. Recent compliance data suggests cumulative overproduction peaked at around 800,000 barrels per day, with Iraq, Kazakhstan, and the UAE identified as the primary offenders.
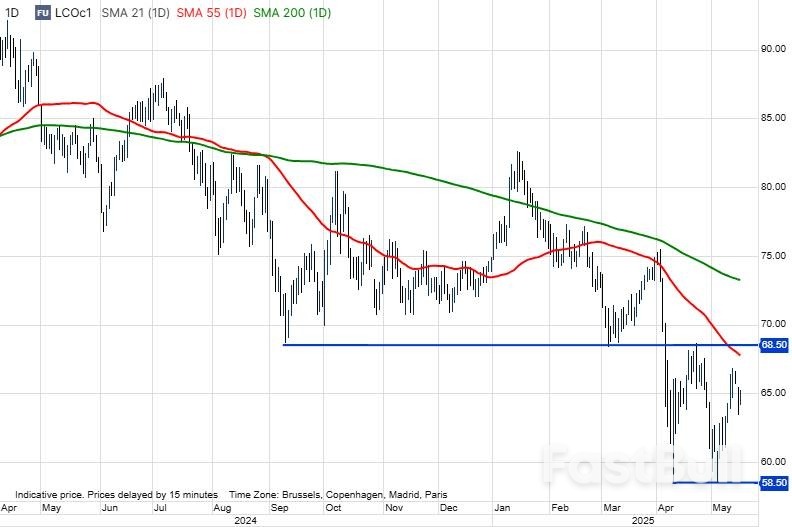 Brent Crude Oil, first month future - Source: SaxoTraderGO
A white 2025 Ford Expedition SUV with bronze exterior trim rolls off the assembly line at Ford Motor's Kentucky Truck Plant. It was assembled — from its frame to completion — by American workers at the factory. But it's far from being completely "Made in the USA."
A majority of its main parts — at least 58% as stated on a window sticker — were made outside of the country, including 22% from Mexico. That includes its Ford-engineered, 3.5-liter twin-turbocharged V-6 Ecoboost engine, the heart of the vehicle.
The popular large SUV is a prime example of how complicated the global automotive supply chain is, and underscores the reality that even vehicles rolling off U.S. assembly lines from quintessentially American companies such as Ford can rely heavily on non-domestic content.
The massive Kentucky assembly plant that has more than 9,000 people building the Expedition, F-Series pickup trucks and Lincoln Navigator SUV is exactly the kind of facility President Donald Trump is pressuring automakers to build in the U.S. through his use of aggressive tariffs.
After Trump put 25% tariffs on imported vehicles and many automotive parts, automakers started scrambling to tout U.S. investments and localize supply chains as much as possible. But while the country would benefit from jobs and economic output if all auto parts were sourced and manufactured in the U.S., experts say it's just not feasible.
"Some parts that have been offshored will still be cheaper to manufacture in those locations rather than the USA at scale even with some of the imposed tariffs," said Martin French, a longtime supplier executive and partner at Berylls Strategy Advisors USA.
Processing and production plants for things such as steel, aluminum and semiconductor chips, especially older ones used for autos, as well as raw materials like platinum and palladium, aren't prevalent enough in the U.S. without establishing new plants or mines. Those are processes experts say would take a decade or more to create in scale.
On top of that, the increased costs of a 100% U.S.-made vehicle could price many consumers out of the new vehicle market. That could in turn lead to less demand and likely lower production.
"We can move everything to the U.S., but if every Ford is $50,000, we're not going to win as a company," Ford CEO Jim Farley said last week on CNBC's "Squawk Box." "That's a balancing act that every [automaker] will have to do, even the most American company."
Farley said 15% to 20% of commoditized vehicle parts are difficult, if not impossible, to currently source in the U.S. That includes things such as small fasteners, labor-intensive wiring harnesses and almost $5,000 in semiconductors per vehicle, which are currently sourced largely from Asia.
S&P Global Mobility reports there are on average 20,000 parts in a vehicle when it's torn down to its nuts and bolts. Parts may originate in anywhere from 50 to 120 countries.
For example, the Ford F-150, which shares a platform and some parts with the Expedition, is exclusively assembled in the U.S. but has roughly 2,700 main billable parts, which exclude many small pieces, according to Caresoft, an engineering benchmarking and consulting firm.
The Trump administration could ease higher prices for an American-made vehicle by offering tax breaks or consumer incentives, much like the up to $7,500 electric vehicle credit Trump previously promised to eliminate.
But the costs of a 100% American-made vehicle are far greater and more complex than they might seem at first blush. It's even hard to track what comes from the U.S., as automakers are required to report a combined percentage of Canadian and U.S. content in a vehicle, not just U.S. content.
The material costs alone, excluding manufacturing investments, would add thousands of dollars to a vehicle's price point, which would wipe out profits for automakers and force price increases for consumers, a handful of automotive analysts and executives told CNBC.
The people, who were given anonymity to speak freely, estimated it would add thousands of dollars with each step you took to get closer to 100% U.S. and Canadian parts.
Mark Wakefield, a partner and global automotive market lead at consulting firm AlixPartners, said nothing's necessarily impossible with time, but the investment needed for U.S. and Canadian sourcing and added costs would increase exponentially the closer a company came to a 100% "Made in the USA" vehicle.
"The cost gets quantumly more the higher the closer you get to 100%," Wakefield said. "Getting above 90% gets expensive, and getting about 95% would get really expensive, and you just start getting into things that you'd have to a take a long time [to do]."
To get that last 5% to 10%, if, or when, you could, Wakefield said, it would start "getting really expensive" and likely take a decade or more to set up raw material sourcing and reshore production of some parts.
"I don't think you could do it more than about 95% on average, at any cost at the moment, just because you need to build a lot of stuff that's going to take a long time," he said. "The processing and the raw material stuff, it takes a really long time, because those are multibillion dollar facilities that process it."
Two executives with auto suppliers told CNBC it would be "unrealistic," if not impossible, for a company to profitably build a 100% U.S.-made vehicle at this time. Another executive at an automaker estimated the average cost increase for an American-assembled U.S. full-size pickup would jump at least $7,000 to source as many components as currently possible from the U.S. and Canada.
One expert, generalizing the costs, said it could cost $5,000 more to get a vehicle that's under 70% U.S./Canadian parts to 75% or 80%; another $5,000 to $10,000 to hit 90%; and thousands more to a higher percentage than that.
Using that as a basis, the average transaction price of a new vehicle in the U.S. is currently around $48,000, according to Cox Automotive. Say that vehicle is made up of $30,000 in materials and parts. Adding the above costs would come out to roughly $10,000 to $20,000 more for companies.
Cars.com reports the U.S. is by far the most expensive country to manufacture a vehicle in. The average new-car price of a U.S.-assembled vehicle is more than $53,200, according to its data. That compares with roughly $40,700 in Mexico, $46,148 in Canada and roughly $51,000 in China.
Excluding raw materials, someone could theoretically start a new car company — let's call it U.S. Motors — from scratch. U.S. Motors could spend billions of dollars to build new factories and establish an exclusively American supply chain, but the vehicle it would produce would likely be low-volume and excessively expensive, experts say.
Think of Ferrari: Every car from the iconic automaker comes from Italy, with as many components as possible sourced from the company's homeland.
But even Ferrari's multimillion-dollar sports cars have parts or raw materials for things such as airbags, brakes, tires, batteries and more that come from non-Italian suppliers and facilities.
"If you did it at really low volume and you're extremely innovative and different with the vehicle, you could make $300,000-$400,000 vehicles that are all-American," Wakefield said. "To do it at scale, it would be 10-15 [years] and $100 billion to do that."
Getting vehicles to 75% U.S. and Canadian parts and final assembly in the America is a far more achievable target that "doesn't really force you to do uneconomic things," Wakefield said, noting that a few vehicles meet that standard today.
But even reaching that threshold on a larger scale would likely take billions of dollars in new investments from automakers and suppliers to localize production. Some automakers could make the move more easily, while others would require massive shifts in sourcing and production.
Vehicles that meet the 75% U.S./Canada parts standard for the 2025 model year include the Kia EV6, two versions of the Tesla Model 3 and the Honda Ridgeline AWD Trail Sport, according to the latest vehicle content data required by the National Highway Traffic Safety Administration. Nearly 20 others are at 70% or higher, while some vehicles still need to be added to the data.
That compares to 2007 model-year NHTSA data, where the top 16 vehicles — all from GM and Ford — had 90% or more U.S. and Canadian content. Ford's Expedition at that time was among the highest at 95%, but that was before the expanded globalization of the auto industry supply chain after the Great Recession — and before several major technological advances in cars made new parts and materials more important.
For decades, there has been a trend for less U.S./Canadian content because of the globalization of supply chains and the increase in the use of Mexico as a source of parts and components, according to American University's Kogod School of Business.
Imported vehicles from many luxury brands, specifically German manufacturers as well as Toyota's Lexus, feature little U.S.-sourced content. Many have none or 1%, according to the federal data.
The U.S./Canada percentages, under the American Automobile Labeling Act of 1992, are calculated on a "carline" basis rather than for each individual vehicle and may be rounded to the nearest 5%. They are calculated by automakers and reported to the government.
However, a high threshold of North American parts also doesn't mean the vehicles are produced in the U.S. The 2024 Toyota RAV4, for example, was reported to have 70% U.S./Canadian parts and is built in Canada.
"You could have a vehicle, theoretically, that is made in the U.S., but only has 1% parts, content," said Patrick Masterson, a lead researcher for Cars.com's "American-Made Index."
Cars.com's annual index of the top U.S. vehicles takes vehicle assembly, parts and other factors into account. No vehicles from Ford or General Motors made the top 10, while two Teslas, two Hondas and a Volkswagen took the top five spots.
The study ranks 100 vehicles judged through the same five criteria it's used since the 2020 edition: assembly location, parts content, engine origin, transmission origin and U.S. manufacturing workforce. More than 400 vehicles of model-year 2024 vintage were analyzed to qualify the 100 vehicles on the list.
The white 2025 Ford Expedition that recently rolled off the assembly line in Kentucky is expected to score higher than the prior model year, which ranked 78th, because of an increase in domestic content.
Masterson said there's been increased interest and popularity for the "American-Made Index" this year amid Trump's tariff policies and nationalism.
"Traffic on the 'American-Made Index' this year is way, way up. … People are concerned about this, perhaps more than ever," Masterson said, later adding "it would be extremely difficult to make a 100% U.S.-made [vehicle]."
728 RM B 7/F GEE LOK IND BLDG NO 34 HUNG TO RD KWUN TONG KLN HONG KONG


White Label
Data API
Web Plug-ins
Poster Maker
Affiliate Program
The risk of loss in trading financial instruments such as stocks, FX, commodities, futures, bonds, ETFs and crypto can be substantial. You may sustain a total loss of the funds that you deposit with your broker. Therefore, you should carefully consider whether such trading is suitable for you in light of your circumstances and financial resources.
No decision to invest should be made without thoroughly conducting due diligence by yourself or consulting with your financial advisors. Our web content might not suit you since we don't know your financial conditions and investment needs. Our financial information might have latency or contain inaccuracy, so you should be fully responsible for any of your trading and investment decisions. The company will not be responsible for your capital loss.
Without getting permission from the website, you are not allowed to copy the website's graphics, texts, or trademarks. Intellectual property rights in the content or data incorporated into this website belong to its providers and exchange merchants.
Not Logged In
Log in to access more features

FastBull Membership
Not yet
Purchase


Log In
Sign Up


