Markets
News
Analysis
User
24/7
Economic Calendar
Education
Data
- Names
- Latest
- Prev


Signal Accounts for Members
All Signal Accounts
All Contests


U.S. IHS Markit Manufacturing PMI Prelim (SA) (Jan)A:--
F: --
P: --
U.S. IHS Markit Services PMI Prelim (SA) (Jan)A:--
F: --
P: --
U.S. IHS Markit Composite PMI Prelim (SA) (Jan)A:--
F: --
P: --
U.S. UMich Consumer Sentiment Index Final (Jan)A:--
F: --
P: --
U.S. UMich Current Economic Conditions Index Final (Jan)A:--
F: --
P: --
U.S. UMich Consumer Expectations Index Final (Jan)A:--
F: --
P: --
U.S. Conference Board Leading Economic Index MoM (Nov)A:--
F: --
P: --
U.S. Conference Board Coincident Economic Index MoM (Nov)A:--
F: --
P: --
U.S. Conference Board Lagging Economic Index MoM (Nov)A:--
F: --
P: --
U.S. UMich 1-Year-Ahead Inflation Expectations Final (Jan)A:--
F: --
P: --
U.S. Conference Board Leading Economic Index (Nov)A:--
F: --
P: --
U.S. Weekly Total Rig CountA:--
F: --
P: --
U.S. Weekly Total Oil Rig CountA:--
F: --
P: --
Japanese Prime Minister Sanae Takaichi delivers a speech
Germany Ifo Business Expectations Index (SA) (Jan)A:--
F: --
P: --
Germany IFO Business Climate Index (SA) (Jan)A:--
F: --
P: --
Germany Ifo Current Business Situation Index (SA) (Jan)A:--
F: --
P: --
Brazil Current Account (Dec)A:--
F: --
P: --
Mexico Unemployment Rate (Not SA) (Dec)A:--
F: --
P: --
Canada National Economic Confidence IndexA:--
F: --
P: --
U.S. Non-Defense Capital Durable Goods Orders MoM (Excl. Aircraft) (Nov)A:--
F: --
U.S. Durable Goods Orders MoM (Excl. Defense) (SA) (Nov)A:--
F: --
U.S. Durable Goods Orders MoM (Excl.Transport) (Nov)A:--
F: --
P: --
U.S. Durable Goods Orders MoM (Nov)A:--
F: --
U.S. Chicago Fed National Activity Index (Nov)A:--
F: --
U.S. Dallas Fed New Orders Index (Jan)A:--
F: --
P: --
U.S. Dallas Fed General Business Activity Index (Jan)A:--
F: --
U.S. 2-Year Note Auction Avg. YieldA:--
F: --
P: --
U.K. BRC Shop Price Index YoY (Jan)A:--
F: --
P: --
China, Mainland Industrial Profit YoY (YTD) (Dec)A:--
F: --
P: --
Germany 2-Year Schatz Auction Avg. Yield--
F: --
P: --
Mexico Trade Balance (Dec)--
F: --
P: --
U.S. Weekly Redbook Index YoY--
F: --
P: --
U.S. S&P/CS 20-City Home Price Index YoY (Not SA) (Nov)--
F: --
P: --
U.S. S&P/CS 20-City Home Price Index MoM (SA) (Nov)--
F: --
P: --
U.S. FHFA House Price Index MoM (Nov)--
F: --
P: --
U.S. FHFA House Price Index (Nov)--
F: --
P: --
U.S. FHFA House Price Index YoY (Nov)--
F: --
P: --
U.S. S&P/CS 10-City Home Price Index YoY (Nov)--
F: --
P: --
U.S. S&P/CS 10-City Home Price Index MoM (Not SA) (Nov)--
F: --
P: --
U.S. S&P/CS 20-City Home Price Index (Not SA) (Nov)--
F: --
P: --
U.S. S&P/CS 20-City Home Price Index MoM (Not SA) (Nov)--
F: --
P: --
U.S. Richmond Fed Manufacturing Composite Index (Jan)--
F: --
P: --
U.S. Conference Board Present Situation Index (Jan)--
F: --
P: --
U.S. Conference Board Consumer Expectations Index (Jan)--
F: --
P: --
U.S. Richmond Fed Manufacturing Shipments Index (Jan)--
F: --
P: --
U.S. Richmond Fed Services Revenue Index (Jan)--
F: --
P: --
U.S. Conference Board Consumer Confidence Index (Jan)--
F: --
P: --
U.S. 5-Year Note Auction Avg. Yield--
F: --
P: --
U.S. API Weekly Refined Oil Stocks--
F: --
P: --
U.S. API Weekly Crude Oil Stocks--
F: --
P: --
U.S. API Weekly Gasoline Stocks--
F: --
P: --
U.S. API Weekly Cushing Crude Oil Stocks--
F: --
P: --
Australia RBA Trimmed Mean CPI YoY (Q4)--
F: --
P: --
Australia CPI YoY (Q4)--
F: --
P: --
Australia CPI QoQ (Q4)--
F: --
P: --
Germany GfK Consumer Confidence Index (SA) (Feb)--
F: --
P: --
Germany 10-Year Bund Auction Avg. Yield--
F: --
P: --
India Industrial Production Index YoY (Dec)--
F: --
P: --
India Manufacturing Output MoM (Dec)--
F: --
P: --


SURYAVANSHI
ID: 5249090


No matching data
Latest Views
Latest Views
Trending Topics
Top Columnists
Latest Update
White Label
Data API
Web Plug-ins
Affiliate Program
View All

No data
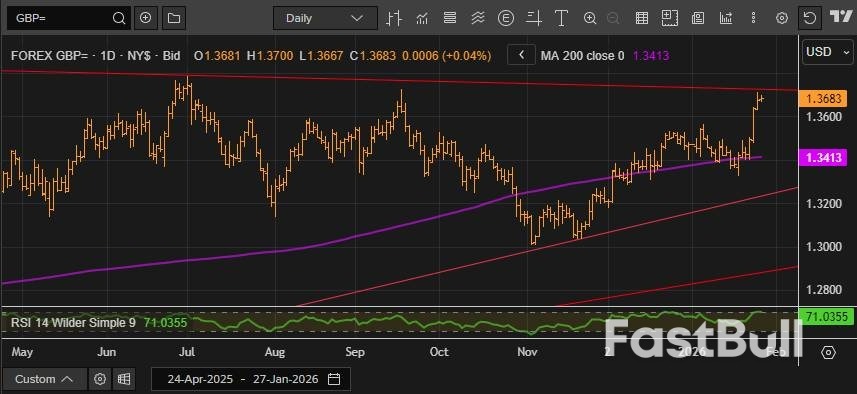
Market Quick Take – 27 January 2026 Market drivers and catalysts Equities: U.S. stocks rose ahead of the Federal Reserve, Europe
1315 – US Weekly ADP Employment Change (4 weeks ending Jan 3)1400 – US Nov. Home Price Index1500 – US Jan Conference Board Consumer Confidence1800 – US Treasury to auction 5-year notes0030 – Australia Dec. and Q4 CPI data

Ten European nations have agreed to jointly develop a massive offshore wind network, a landmark move designed to secure the region's energy supply, reduce dependence on U.S. natural gas, and manage the rising cost of renewables.
At the North Sea Summit, ministers from Britain, Belgium, Denmark, France, Germany, Iceland, Ireland, Luxembourg, the Netherlands, and Norway signed a pact to build 100 gigawatts (GW) of offshore wind capacity. This ambitious project aims to power over 50 million households and builds on a 2023 commitment to install 300 GW of offshore wind by 2050—a strategy initially driven by the energy crisis following Russia's 2022 invasion of Ukraine.
The agreement comes at a critical juncture in Europe's relationship with the United States. Following the disruption of Russian gas flows, Europe has become heavily reliant on U.S. liquefied natural gas (LNG). In 2025, U.S. gas made up 57% of all LNG imports into the EU and Britain, accounting for roughly a quarter of the region's total gas supply.
Concerns over this dependency have been amplified by President Donald Trump's "energy dominance" agenda and transactional approach to diplomacy, highlighted by a recent dispute over Greenland. This new wind power initiative is a clear effort to build a more independent and homegrown energy system.
While wind power is central to Northern Europe's energy strategy—generating 19% of EU electricity in 2025—the industry faces significant headwinds. The region currently operates just 37 GW of offshore wind capacity, making the planned 100 GW expansion a profound transformation of its power market.

Globally, investor confidence in clean energy has cooled due to rising capital costs, supply chain bottlenecks, and concerns over China's dominance in renewables manufacturing. In the U.S., the Trump administration's open hostility toward green energy, especially wind power, has led to the cancellation of multiple projects and further weakened market sentiment.
At the same time, Europe's cost-of-living crisis, exacerbated by high energy prices, has made climate policies a political battleground, creating public resistance to net-zero initiatives.

The multi-nation offshore wind pact is designed to address cost concerns as much as energy security. It includes several features aimed at lowering development expenses and, eventually, consumer electricity bills.
Leveraging Economies of Scale
The sheer scale of the 100 GW commitment is its most powerful feature. By providing the offshore wind supply chain with greater demand certainty, the plan is expected to spur investment in European manufacturing. Industry group WindEurope projects the initiative will:
• Cut costs by 30% between 2025 and 2040.
• Create 91,000 jobs.
• Generate 1 trillion euros ($1.19 trillion) in economic activity.
Building an Integrated Power Network
A core element of the agreement is a plan to connect wind farms to multiple countries through a network of bidirectional cables and interconnectors. This integrated grid will allow electricity to flow where it is most needed, improving efficiency and giving operators the flexibility to respond to shifting supply and demand across different markets.
This cross-border "arbitrage" should also minimize "negative pricing" events, where excess wind generation forces operators to shut down turbines and receive compensation. "When it is windy in Germany, it may not be windy in the UK, so if Germany can't use all of the power, the UK can take some instead of wasting it," explained Jordan May, a senior analyst at consultancy TGS 4C.
Furthermore, because the network will span multiple time zones, peak demand hours will vary by country. This diversity should make it easier to match supply with demand, reducing the need for gas-fired backup power.
An Unexpected Boost from US Policy
Europe may also benefit indirectly from President Trump's stance on wind energy. The U.S. offshore wind sector has seen a sharp downturn, with the International Energy Agency slashing its 2030 forecast for the country by over 50%. Reduced American demand for vessels, components, and services could lead to lower prices for European operators.
Despite the plan's potential, the path forward is complex. European governments must develop intricate new regulations to align different national subsidy programs and power market rules—a process that could take years and face political opposition.
The cost of transitioning to renewables remains a contentious issue in Europe. However, forecasting these costs is difficult, and the same uncertainty applies to fossil fuels, which are subject to volatile global prices. While offshore wind requires significant upfront investment, its long-term operating costs are generally lower. In contrast, gas-fired plants are cheaper to build but remain exposed to price shocks.
Critically, debates over the cost of renewables often overlook the cost of inaction. Europe's power demand is projected to nearly double by 2050, requiring massive investment to upgrade and expand aging grids regardless of the energy source. Delaying this work will only make it more expensive.
Ultimately, this joint offshore wind plan provides a clear path toward greater energy independence and industrial strength. Its success, however, will be measured by its ability to deliver lower, more stable electricity prices for European consumers.
Chancellor Friedrich Merz came to power with a promise to revive Europe's largest economy through an unprecedented fiscal stimulus after two years of contraction. While Germany's growth prospects are central to the eurozone's recovery, economists and business leaders warn that the deep structural reforms needed for sustainable growth have yet to materialize.
The country's sluggish federal decision-making process, combined with a coalition partner hesitant about some of Merz’s more aggressive plans, threatens to stall the reform agenda. Furthermore, idle industrial capacity will take time to bring back online, potentially slowing the recovery.
After expanding by a mere 0.2% in 2025, the German economy is projected to see healthier growth this year as government spending accelerates.
Forecasts for 2026 point toward a moderate upswing. The International Monetary Fund anticipates 1.1% growth, while the German government officially expects a 1.3% expansion, though a source told Reuters this figure will likely be revised down to 1.0%.
"A moderate upswing is a good sign, but the recovery remains fragile," noted Ulrich Reuter, president of Germany's savings banks association DSGV, who also forecasts 1.0% growth.
Investor morale is one bright spot, hitting its highest level since August 2021 in January, according to the ZEW economic research institute.

"It is reasonable to look ahead to 2026 with cautious optimism: If the fiscal measures that have already been decided take full effect, a noticeable pickup is possible," said Geraldine Dany-Knedlik, an economist at the German Institute for Economic Research DIW Berlin.
Despite the optimism, progress has been slow. A landmark 500 billion euro ($593 billion) special fund for infrastructure was approved by parliament last March, yet only 24 billion euros had been invested by the end of the year. This reflects the slow pace of decision-making inherent in Germany's federal system.
Public impatience has grown, especially now that Merz has been in office for over eight months. The initial enthusiasm surrounding the government's fiscal policy shift has also waned amid concerns that parts of the infrastructure fund are being used for daily spending rather than growth-enhancing projects.
Even if a recovery is underway, Germany's problems are structural, self-inflicted, and cannot be fixed quickly, according to Carsten Brzeski, global head of macro at ING.
"This time around, the economy almost needs a complete makeover," Brzeski said, pointing to the need to cut red tape, roll out e-government, and address the fiscal burden of an aging population.
However, Merz's pro-business agenda has met resistance from his centre-left Social Democrat (SPD) coalition partners. The SPD is wary of reforms they believe could weaken workers' rights, leading to disputes over pension changes and tax policy that have hindered progress.
The most difficult structural challenges—including pensions, health insurance financing, and fiscal rule reform—have been delegated to commissions that are not due to report until the end of 2026. This means many of the biggest decisions are still pending.
Fiscal stimulus is providing some support to the industrial sector, which has shown tentative signs of stabilization. Industrial production rose by 0.8% in November, marking its third consecutive monthly increase.

Industrial orders climbed 5.6% month-on-month in November, and private sector business activity grew at its fastest rate in three months in January, according to the flash composite PMI.
"This makes us more confident that, after six years of stagnation, Germany will grow again in 2026. However, we would not get carried away," commented Franziska Palmas, senior Europe economist at Capital Economics.
Despite these positive signals, the BDI industry association projects that industry will likely expand more slowly than the overall economy this year. BDI Managing Director Tanja Goenner highlighted that industrial capacity utilization was at 78% in October, well below the long-term average of 83.3%, marking the longest period of underutilization.
"This means machines are standing still, production potential remains unused, investments are being postponed and employment is being reduced," she explained.
On the domestic front, household demand remains weak. Consumer sentiment fell in January as the tendency to save reached its highest point since the 2008 financial crisis. Spending is expected to stay muted this year as unemployment rises, a lagging effect from the economic stagnation of previous years.
Meanwhile, corporate distress is on the rise. The number of bankruptcies and insolvency-related business closures has reached an 11-year high.
To reverse this trend, DIHK chief analyst Volker Treier insists that the structural problems facing companies must be addressed urgently. "It is up to Chancellor Friedrich Merz and his government to implement these reforms this year and turn a long-awaited rebound into a sustainable recovery," he said.
FX traders are preparing for a very lively day on Wednesday as focus should move away from geopolitical concerns and onto fundamentals for a few sessions. There is some key data out earlier in the day, but the real attention will be on the North American trading session where we hear interest rate updates from both the Bank of Canada and the Federal Reserve Bank, and as always, the Fed should dominate market sentiment across global markets.
After the drama of last month's meeting where the Fed closed out 2025 with another 25-basis point cut, the market is expecting this meeting conclusion to be slightly quieter with chances now up at 97% that they will keep rates on hold. Moves should come from forward guidance from the statement and press conference as projections are not declared at this meeting. Data has remained fairly stable in the US with growth remaining strong, jobs numbers still weak – although the unemployment rate dipped on the last reading – and inflation still sticky, the Core PCE still up at 2.8% well off the Fed's desired 2%.
Some currencies are sitting at very sensitive levels going into the meeting and anything slightly off expectations could see some big moves in the market. The dollar has taken a big hit over the last few sessions and Cable looks particularly vulnerable to a topside move if we hear anything more dovish than expected from the FOMC, while anything on the hawkish side should see it drop hard back into recent ranges. Key long-term trendline resistance on the Daily chart is now relatively close at 1.3730 and a break there opens the way for a move up to the 2025 high at 1.3788, while a move south could see the 200-day moving average at 1.3413 challenged.
Resistance 2: 1.3788 – 2025 High
Resistance 1: 1.3733 – Trendline Resistance
Support 1: 1.3413 – 200 – Day Moving Average
Support 2: 1.3335 – 19 Jan Low

India has agreed to give European automakers a quota more than six times larger than any it has offered in recent times, slashing tariffs under a trade pact with the European Union and granting far greater access to its tightly protected car market.
The agreement will gradually allow up to 250,000 European-made vehicles to enter India at preferential duty rates, according to people familiar with the negotiations — far above the 37,000-unit quota extended to the UK under a separate deal.
Of this, about 160,000 units with internal combustion-engine cars will see import duties fall to 10% within five years while for 90,000 electric vehicles, this levy will kick in by the 10th year to protect the nascent Indian electric vehicle market, the people said. The initial in-quota tariffs will start at about 30% for most segments.
Beyond this quota, the trade pact has negotiated a rate cut to 35% over 10 years for fossil-fuel powered cars, they added. This is a substantial markdown since India currently charges as much as 110% on imported cars.
The larger allocation reflects the bloc's much bigger auto market and will benefit manufacturers including Volkswagen AG, Mercedes-Benz Group AG, Stellantis NV and Renault SA.
The pact includes a review clause allowing quotas to be reassessed periodically to reflect India's booming auto market and any concessions offered to future trade partners, including the US, one of the people said. Reviews will be linked to steel — a key priority for India — giving both sides leverage in future negotiations, the person said.
The unprecedented quota underscores how both sides are using the pact to reset their trade relationship. For Europe, it deepens access to the fast-growing market long shielded by steep tariffs, while India secures reciprocal access for its own automakers as it pushes to expand exports and boost manufacturing. The auto sector concessions are part of a larger trade pact that also slashes duties on wine, spirits and beer, while preserving protections for politically sensitive farm sectors on both sides.
The EU will offer Indian automakers such as Mahindra & Mahindra Ltd., Tata Motors Passenger Vehicles Ltd. and Maruti Suzuki India Ltd. import concessions covering up to 625,000 vehicles, a number calibrated to reflect the relative size of the two markets, one of the people said.
Tariffs on India-made electric vehicles imported into the bloc within quotas will be eliminated over 10 years, the person said. Smaller, lower-cost EVs will be phased in more slowly over 14 years, starting at 27,500 units in year five and rising to 125,000 units — about 2% of EU's market based on current forecasts, according to one of the people.
To be sure, while the agreement gives European carmakers a clearer pathway to deepen their presence in India — and potentially operate with lower levels of local manufacturing investment than they have long sought to avoid — the timing of the tariff cuts will be critical in determining how valuable the concessions prove in practice.
With the steepest reductions phased in over several years, companies' ability to capitalize on the deal will hinge on how quickly lower duties take effect and whether demand in India's premium and electric segments accelerates as expected.
India also agreed to reduce out-of-quota tariffs on European combustion-engine cars to between 30% and 35% over a decade, the people said.
In addition to finished vehicles, European carmakers will be allowed to export up to 75,000 cars a year, priced above €15,000 (about $17,800), for assembly in India from completely-knocked-down kits. Tariffs on those imports will be cut to 8.25% from 16.5%, according to a person familiar with the details.
Duties on car parts will be reduced to zero, the people said, supporting deeper supply-chain integration between Europe and India. Europe is a major export market for Indian auto component suppliers, while higher pricing for Europe-made parts is expected to limit the impact on India's domestic manufacturing industry.
The agreement stops short of sweeping market opening, the person said, adding that it underscored the constraints the bloc faced in talks with India, especially after New Delhi tied progress to its demands on steel. Even with the deal in place, new EU regulations on that sector are likely to curb India's effective access to the market, the person said.
In October, Bank of America raised its 2026 gold price forecast to $5,000.
Mission accomplished as of January 23.
Now the big bank has upped its projection again, calling for $6,000 gold this year.
BoA analyst Michael Hartnett said gold's performance in past bull markets influenced his thinking.
"History is no guide to future, but avg gold jump past 4 bull markets ≈ 300% in 43 months which would imply gold reaching $6,000 by spring."
Earlier this month, Bank of America's Head of Metals Research, Michael Widmer, indicated he thought gold would become a key asset in investment portfolios this year.
"Gold continues to stand out as a hedge and alpha source," he wrote, adding that gold will serve as a key hedge and potential return driver in 2026.
In December, Widmer noted that bull markets don't end simply because prices reach high levels. The bulls will fade when the fundamentals driving the market shift. At this point, there is no reason to think that de-dollarization, central bank gold buying, inflation pressures, Federal Reserve monetary easing, geopolitical tensions, and U.S. fiscal malfeasance will end any time soon.
"I've highlighted before that the gold market has been very overbought. But it's actually still underinvested. There is still a lot of room for gold as a diversification tool in portfolios."
Tight supplies have been a key driver of the silver market. Widmer said the thinks supply constraints may also impact the gold market, forecasting that the 13 major North American gold miners will produce 19.2 million ounces this year, a decline of 2 percent from 2025. He said he believes that most market forecasts for output are too optimistic.
Widmer also projects average all-in sustaining costs will rise 3 percent to about $1,600 per ounce, a level slightly above the market consensus.
There has been growing interest in gold as a portfolio diversifier. Last fall, Morgan Stanley CIO Michael Wilson said investors should consider abandoning the traditional 60/40 equity/bond portfolio allocation and adopt a 60/20/20 distribution with 20 percent allocated to precious metals.
Widmer said the 60/20/20 allocation makes sense.
"When you run the analysis since 2020, you can actually justify that retail investors should have a gold share of well above 20 percent. You can even justify 30 percent at the moment."
On average, Western investors currently hold less than 1 percent of gold in their portfolios.
With the price touching $5,000, it's getting increasingly more difficult to ignore gold. Widmer said this will likely incentivize more portfolio managers to consider both gold and silver.
"Just looking at benchmarks, gold has been one of the best-performing assets for the past few years. What we've heard a lot of the time is that 'gold is a non-yielding asset; it costs to hold it; you don't make any money from it, so what's the point of actually holding it?' But just from a pure direction perspective, gold could have actually made a good contribution to a portfolio. I think the numbers speak for themselves."
White Label
Data API
Web Plug-ins
Poster Maker
Affiliate Program
The risk of loss in trading financial instruments such as stocks, FX, commodities, futures, bonds, ETFs and crypto can be substantial. You may sustain a total loss of the funds that you deposit with your broker. Therefore, you should carefully consider whether such trading is suitable for you in light of your circumstances and financial resources.
No decision to invest should be made without thoroughly conducting due diligence by yourself or consulting with your financial advisors. Our web content might not suit you since we don't know your financial conditions and investment needs. Our financial information might have latency or contain inaccuracy, so you should be fully responsible for any of your trading and investment decisions. The company will not be responsible for your capital loss.
Without getting permission from the website, you are not allowed to copy the website's graphics, texts, or trademarks. Intellectual property rights in the content or data incorporated into this website belong to its providers and exchange merchants.
Not Logged In
Log in to access more features
Log In
Sign Up