Markets
News
Analysis
User
24/7
Economic Calendar
Education
Data
- Names
- Latest
- Prev


Signal Accounts for Members
All Signal Accounts
All Contests


Stats Office - Swiss December Retail Sales +2.9% Year-On-Year Versus Revised +1.7% In Previous Month
Iran's Foreign Ministry Spokesperson Baghaei Says Tehran Is Examining Details Of Various Diplomatic Processes, Hopes For Results In Coming Days
FAA Head Says Concerned Other Countries Aren't Putting Enough Resources Into Certifying USA Aircraft
German Dec Retail Sales +1.5 Percent Year-On-Year (Versus Reuters Consensus Forecast For +1.1 Percent)
Russian Security Committee's Vice Chairman Medvedev: Russia Will Not Accept NATO-Member Forces In Ukraine
Russian Security Committee's Vice Chairman Medvedev: Nuclear Arms Control For Past 60 Years Helped Verify Intentions And Build Trust
Russian Security Committee's Vice Chairman Medvedev: The Territorial Issue In Ukraine Talks Is Most Complicated
Russian Security Committee's Vice Chairman Medvedev: If New Start Expires It Does Not Necessarily Mean A Catastrophe But It Should Alarm Everyone
Russian Security Committee's Vice Chairman Medvedev: Our Proposal To USA On Extending The Limits Of New Start Remains On The Table
Kazakhstan's Central Bank Says It Sold Foreign Currency Worth 350 Billion Tenge In January To Mirror Gold Purchases, Will Sell Foreign Currency Worth 350 Billion In February

U.S. Core PPI YoY (Dec)A:--
F: --
U.S. Core PPI MoM (SA) (Dec)A:--
F: --
P: --
U.S. PPI YoY (Dec)A:--
F: --
P: --
U.S. PPI MoM (SA) (Dec)A:--
F: --
P: --
Canada GDP MoM (SA) (Nov)A:--
F: --
P: --
Canada GDP YoY (Nov)A:--
F: --
P: --
U.S. PPI MoM Final (Excl. Food, Energy and Trade) (SA) (Dec)A:--
F: --
P: --
U.S. PPI YoY (Excl. Food, Energy & Trade) (Dec)A:--
F: --
P: --
U.S. Chicago PMI (Jan)A:--
F: --
Canada Federal Government Budget Balance (Nov)A:--
F: --
P: --
U.S. Weekly Total Oil Rig CountA:--
F: --
P: --
U.S. Weekly Total Rig CountA:--
F: --
P: --
China, Mainland NBS Manufacturing PMI (Jan)A:--
F: --
P: --
China, Mainland NBS Non-manufacturing PMI (Jan)A:--
F: --
P: --
China, Mainland Composite PMI (Jan)A:--
F: --
P: --
South Korea Trade Balance Prelim (Jan)A:--
F: --
Japan Manufacturing PMI Final (Jan)A:--
F: --
P: --
South Korea IHS Markit Manufacturing PMI (SA) (Jan)A:--
F: --
P: --
Indonesia IHS Markit Manufacturing PMI (Jan)A:--
F: --
P: --
China, Mainland Caixin Manufacturing PMI (SA) (Jan)A:--
F: --
P: --
Indonesia Trade Balance (Dec)A:--
F: --
P: --
Indonesia Inflation Rate YoY (Jan)A:--
F: --
P: --
Indonesia Core Inflation YoY (Jan)A:--
F: --
P: --
India HSBC Manufacturing PMI Final (Jan)A:--
F: --
P: --
Australia Commodity Price YoY (Jan)A:--
F: --
P: --
Russia IHS Markit Manufacturing PMI (Jan)A:--
F: --
P: --
Turkey Manufacturing PMI (Jan)A:--
F: --
P: --
U.K. Nationwide House Price Index MoM (Jan)A:--
F: --
P: --
U.K. Nationwide House Price Index YoY (Jan)A:--
F: --
P: --
Germany Actual Retail Sales MoM (Dec)A:--
F: --
Italy Manufacturing PMI (SA) (Jan)--
F: --
P: --
South Africa Manufacturing PMI (Jan)--
F: --
P: --
Euro Zone Manufacturing PMI Final (Jan)--
F: --
P: --
U.K. Manufacturing PMI Final (Jan)--
F: --
P: --
Brazil IHS Markit Manufacturing PMI (Jan)--
F: --
P: --
Canada National Economic Confidence Index--
F: --
P: --
Canada Manufacturing PMI (SA) (Jan)--
F: --
P: --
U.S. IHS Markit Manufacturing PMI Final (Jan)--
F: --
P: --
U.S. ISM Output Index (Jan)--
F: --
P: --
U.S. ISM Inventories Index (Jan)--
F: --
P: --
U.S. ISM Manufacturing Employment Index (Jan)--
F: --
P: --
U.S. ISM Manufacturing New Orders Index (Jan)--
F: --
P: --
U.S. ISM Manufacturing PMI (Jan)--
F: --
P: --
South Korea CPI YoY (Jan)--
F: --
P: --
Japan Monetary Base YoY (SA) (Jan)--
F: --
P: --
Australia Building Approval Total YoY (Dec)--
F: --
P: --
Australia Building Permits MoM (SA) (Dec)--
F: --
P: --
Australia Building Permits YoY (SA) (Dec)--
F: --
P: --
Australia Private Building Permits MoM (SA) (Dec)--
F: --
P: --
Australia Overnight (Borrowing) Key Rate--
F: --
P: --
RBA Rate Statement
Japan 10-Year Note Auction Yield--
F: --
P: --
Saudi Arabia IHS Markit Composite PMI (Jan)--
F: --
P: --
RBA Press Conference
Turkey PPI YoY (Jan)--
F: --
P: --
Turkey CPI YoY (Jan)--
F: --
P: --
Turkey CPI YoY (Excl. Energy, Food, Beverage, Tobacco & Gold) (Jan)--
F: --
P: --


No matching data
Latest Views
Latest Views
Trending Topics
Top Columnists
Latest Update
White Label
Data API
Web Plug-ins
Affiliate Program
View All

No data
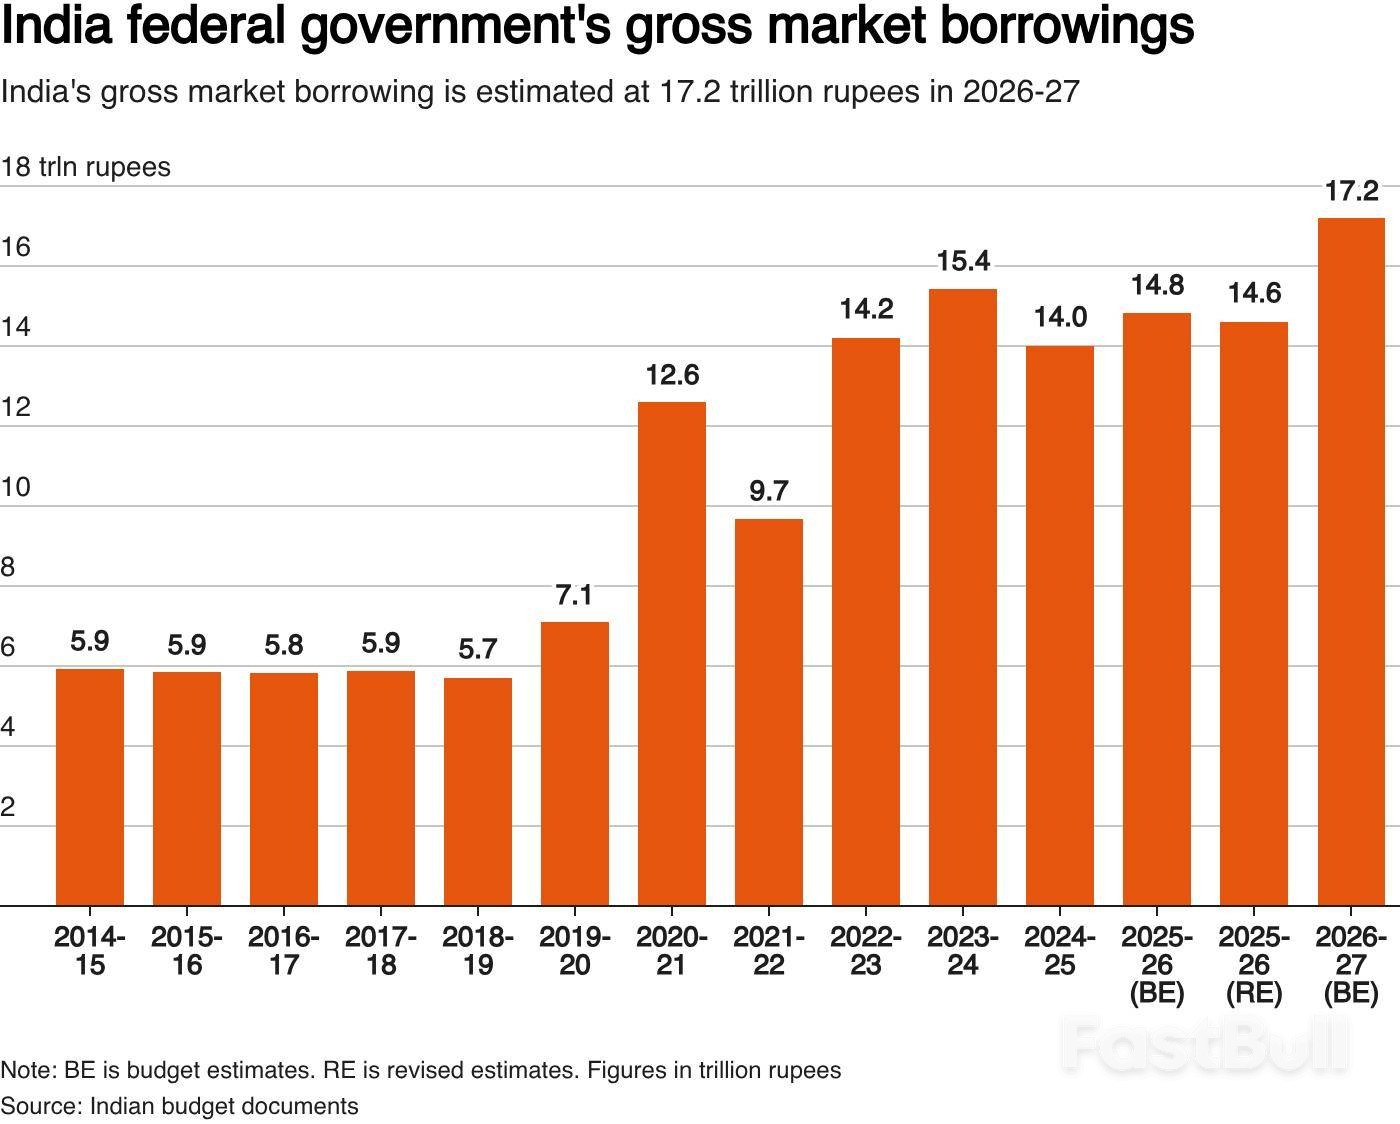
Indian bonds plummeted, with yields soaring to a year-high, amid record government borrowing that challenges central bank policy.
Indian government bonds sold off sharply following the federal budget, with the 10-year benchmark yield hitting its highest level in nearly a year. The market slump was driven by the government's announcement of a record-high borrowing program, which has weakened already fragile investor sentiment.
The government plans to borrow a gross 17.2 trillion rupees ($187.5 billion) in the next fiscal year, which runs from April through March. This news immediately pushed bond prices down and yields up.
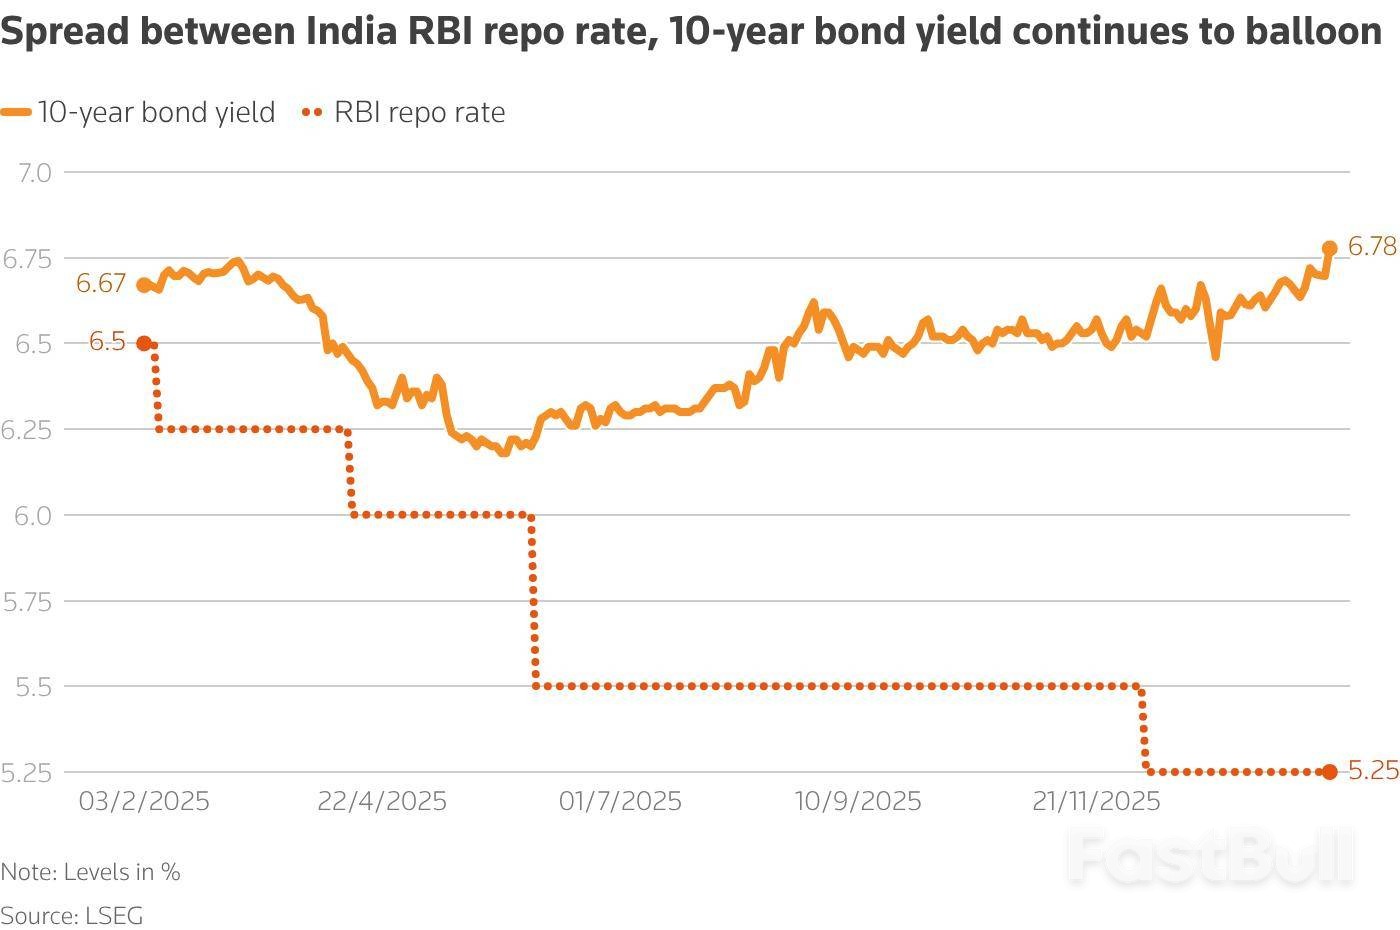
The yield on the benchmark 6.48% 2035 bond jumped 8 basis points to 6.78% on Monday, a peak not seen since last March. This move comes as the market grapples with a lack of investor appetite and recent losses on trading portfolios.
Even before the budget announcement, the market showed signs of stress. The 10-year benchmark yield had already risen by around 20 basis points between December and January, despite a 25 basis point policy rate cut and significant debt purchases by the central bank.

The 10-year government bond yield is a crucial economic indicator because it serves as a benchmark for borrowing costs across the country. When this yield rises, it creates several challenges:
• Higher Costs for Companies and States: Both corporate and state-level borrowing becomes more expensive, as their loan rates are priced relative to government bonds.
• Increased Government Debt Burden: The government itself must pay more to finance its operations, straining public finances.
• Complicates Central Bank Policy: The Reserve Bank of India (RBI) has been cutting policy rates to support economic growth. Rising market yields work against these efforts, making monetary policy less effective.

Market analysts are now expressing caution and looking to the central bank for support.
"We remain cautious on bonds, (and) despite the recent cheapening, we do not advocate long positions here and think the 10-year can push closer to 7% near term," said Nathan Sribalasundaram, Asia rates strategist at Nomura. He noted that while the RBI remains the "marginal buyer," the central bank has a low bar for announcing further bond purchases through Open Market Operations (OMOs).
Dhiraj Nim, an economist at ANZ, shared a similar view on the RBI's role. "With macro factors likely to dampen the private sector's bond demand, the RBI is expected to use open market operations to boost liquidity and manage borrowing costs simultaneously," he said.
With the market under pressure, all eyes are on the Reserve Bank of India's monetary policy decision this Friday. While another rate change is not expected, traders and investors are anxiously awaiting any announcements about liquidity injections or new bond-buying programs designed to stabilize the market.
Copper prices continued their sharp decline from a record high, leaving traders to debate whether bullish Chinese investors will step back in after several days of chaotic trading rocked global metals markets.
The intense volatility has some seasoned market observers stepping back, citing heightened risks and a disconnect between financial speculation and softening physical demand. Yet, conversations among traders in China suggest a strong appetite to buy the dip, with analysts unwilling to rule out another major swing higher.
On the London Metal Exchange (LME), the industrial metal sank by as much as 4.2% to $12,600 per ton. This followed a dramatic week where prices first soared to a record above $14,500 last Thursday before crashing below $13,000 in intraday trading on Friday. Other metals, including aluminum, tin, nickel, and silver, also posted steep declines.
The extreme moves capped a strong period for copper, which saw futures gain over 40% in 2025 amid mine disruptions, speculation on demand from the energy transition, and the potential for new U.S. import tariffs.

The recent rally in both base and precious metals was initially driven by a surge of interest from investors in China, where funds have been rotating into commodities amid doubts about the U.S. dollar and a shift away from currencies and sovereign bonds.
However, Friday's selloff was sparked by news that U.S. President Donald Trump named Kevin Warsh, known as a tough inflation fighter, to head the Federal Reserve.
Despite the turbulence, January was the busiest month ever for metals trading on the Shanghai Futures Exchange (SHFE), with copper volumes hitting a record during Friday's downturn.
"Some funds are exiting ahead of the Lunar New Year to avoid risk amid such high volatility," noted Gao Yin, an analyst at Shuohe Asset Management Co. "But the medium- to long-term logic behind this round of rally remains intact. There is a unanimous, bullish consensus among Chinese investors."
The frenzy in financial markets contrasts sharply with softening physical demand. Traders familiar with the industry report that buying from fabricators has been muted, even with the price drop. Many industrial users are also winding down operations ahead of the Lunar New Year holiday.
This disconnect was further highlighted by data showing China's factory activity unexpectedly stalled in December. Copper bulls appear to be looking past weak immediate consumption, focusing instead on broader macro trends like easier global monetary policy, a softer dollar, and increased fiscal spending in developed economies.
Some analysts believe the current pullback is a strategic entry point.
"The near-term correction will provide a good window to buy," wrote Li Yaoyao, an analyst at Xinhu Futures Co., in a note. The firm suggested copper is entering a "supercycle" of sustained high prices and could trade between 100,000 yuan ($14,385) and 150,000 yuan per ton in Shanghai this year.
As of the latest trading, copper on the SHFE was down 3.4% at 100,110 yuan a ton. In London, LME copper fell 4.2% to $12,601.50 a ton at 12:05 p.m. Singapore time, after closing 3.4% lower on Friday. Other industrial metals also declined, with aluminum losing 2.8% and tin falling by more than 8%. Iron ore in Singapore dipped 0.3% to $103.35 a ton.
The Japanese yen weakened significantly on Monday, sliding past the key 155 level against the U.S. dollar. The move was triggered by comments from Prime Minister Sanae Takaichi that markets interpreted as an endorsement of a weaker currency, compounded by a strengthening greenback.

Over the weekend, Prime Minister Takaichi highlighted the advantages of a weaker yen during a campaign speech for a lower house election scheduled for February 8. She argued that a strong yen hurts exporters' competitiveness and that the current currency weakness represents "a big opportunity for export industries."
Takaichi also noted that Japan's Foreign Exchange Fund Special Account has "coffers that are brimming now," a remark that further fueled market speculation.
Analysts suggested that these comments, especially when combined with U.S. Treasury Secretary Scott Bessent's recent statement that Washington would "absolutely not" intervene in currency markets, were likely to accelerate speculative yen selling.
In response to the market reaction, Takaichi attempted to clarify her position on social media, stating that the press had misunderstood her. "My intention was not to say whether yen appreciation or yen depreciation is good or bad, but to note that 'we want to build a strong economy that is resilient to exchange rate fluctuations,'" she explained.
Despite her clarification, the yen continued its slide. The decline was further supported by a Finance Ministry announcement confirming that Japan had not conducted any foreign exchange interventions in the past few weeks.
The yen's fall was not just a story of local politics; it was also driven by strong investor demand for the U.S. dollar.
On Friday, U.S. President Donald Trump announced his intention to nominate Kevin Warsh as the next Federal Reserve chair, succeeding Jerome Powell. This news prompted a dollar recovery after a sharp sell-off last week.
Michael Wan, a senior currency analyst at MUFG Bank, described Warsh as a hawk. "History would suggest he is a hawk with a predisposition to focus on inflation," Wan wrote in a note. He added that Warsh has historically been critical of the Fed expanding its balance sheet and believes the central bank has overstepped its mandate.
While Warsh has more recently voiced support for interest rate cuts, his nomination has led the market to anticipate less aggressive monetary easing from the Fed, strengthening the dollar.
The yen's depreciation initially provided a boost to the Japanese stock market. Shares of major exporters like Toyota Motor and Subaru rose as a weaker currency makes their products more competitive abroad.
The benchmark Nikkei Stock Average reflected this optimism, at one point climbing over 900 points, a gain of 1.7%.
However, the rally was short-lived. The stock market quickly lost momentum and turned lower as a tumble in major technology stocks erased the early gains.
Last week will not be forgotten for some time. Those with exposure to ultra-crowded markets will be acutely aware that trading any financial instrument with a 10-day realised volatility of 186%, as seen in silver, demands both an open mind as to where the collective may push price and a disciplined approach to position sizing. Correctly sizing exposure relative to such extreme levels of volatility is absolutely essential. As the new trading week begins and markets attempt to re-establish fair value and some form of balance, the eruptions seen in several more dysfunctional markets may yet prove to be aftershocks. Carrying risk when one cannot immediately react remains the primary consideration.
Markets ultimately respond to flows, while liquidity conditions go a long way in explaining the magnitude of price movements. For risk managers, the event risks ahead must also be carefully assessed. Traders are right to ask whether an upcoming event is likely to generate an outsized move or a volatility shock that could materially impact existing exposures. Given the range of possible outcomes, it is also worth questioning whether there is any clear directional skew that provides a genuine trading edge.
US Nonfarm Payrolls the Marquee Scheduled Event Risk This Week

With that framework in mind, it is fitting that the economic calendar is particularly full in the week ahead. The Friday release of US nonfarm payrolls stands out as the marquee risk event. Markets are currently modelling a central estimate of 68,000 net new jobs created in January, with the unemployment rate expected to hold at 4.4%. If realised, this outcome would likely be viewed as supportive for risk assets such as equities, offering enough job creation to limit renewed concerns about the US labour market, but not so strong as to materially reduce expectations for Fed rate cuts in June or July, or the pricing of two 25 basis point cuts by December.
Elsewhere in the US, and while likely secondary to nonfarm payrolls, JOLTS job openings and the ISM manufacturing and services surveys still have the capacity to move markets if outcomes prove to be meaningful outliers relative to expectations. RBA Meeting Poses Near Term Risk for AUD Traders Outside the US, the RBA meeting on Tuesday presents a near-term risk for AUD exposures. Interest rate swaps price around 15 basis points of tightening for this meeting, implying a 71% probability of a 25 basis point hike. That said, even if the RBA does raise rates, any AUD reaction may fade quickly unless the accompanying statement is interpreted as sufficiently hawkish to lift expectations for further tightening at future meetings.

The ECB and BoE meetings are not expected to result in changes to policy rates. While there may be some review of ECB guidance and the potential for brief volatility in EUR and GBP pairs, any market reaction should be contained and short-lived.
US equity indices will also command attention, with just under 30% of S&P 500 market capitalisation reporting earnings and guidance this week. Alphabet and Amazon are the major heavyweight releases, while trader favourites such as Palantir, AMD, Qualcomm, Iren, Reddit and Barrick are also on the radar.
It is a similarly busy earnings week in Europe, with around 30% of Euro Stoxx market capitalisation due to report. European equity indices are consolidating after a modest pullback from recent all-time highs. Conviction around a clear directional move in the DAX or Euro Stoxx 50 remains low, and the indices likely require further work to attract meaningful flows in either direction.

Attention also naturally remains on silver, gold and the US dollar. Silver, and XAGUSD in particular, has become a case study in trading within a dysfunctional market, with products that typically move in close alignment becoming fractured and misaligned. XAG is trading with a 10-day realised volatility of 186%, equating to daily realised moves of nearly 12%, which is extraordinary. The CME's shift to percentage-based margining and successive increases in margin requirements have clearly contributed, alongside elevated positioning.
China remains central to the silver narrative and appears to have provided the trigger for Friday's generational moves. Many traders outside China are now familiar with the UBS SDIC silver futures fund (161226), which had become the primary vehicle for Chinese retail investors to gain exposure to silver. When the Shenzhen Stock Exchange halted trading in the fund on Friday, investors were effectively locked in and forced to seek alternative ways to reduce exposure. That exit occurred through SHFE silver futures, with the resulting selling pressure rippling into COMEX futures and triggering a significant liquidation of positions.
Whether silver has reached a durable bottom is difficult to say. Another round of selling cannot be ruled out as Shanghai futures markets reopen, particularly given the residual stress across leveraged positions and market structure.
Good luck to all.
Southeast Asia's export-driven economies saw their trade surpluses with the United States climb sharply in 2025, a surprising outcome that defied the Trump administration's efforts to rebalance trade through new tariffs.
Official data shows that Malaysia, Thailand, and Vietnam—three of the region's primary manufacturing and export centers—posted significant gains. Their trade surpluses with the U.S. expanded by 45%, 44%, and 28%, respectively, providing a major boost to their overall trade performance.
According to Malaysia's Ministry of Investment, Trade and Industry, exports to the U.S. "remained resilient," with value expanding by 17.2%. The ministry credited this growth to "robust demand for [electronics and electric] products, machinery, equipment and parts, processed food as well as manufactures of metal."
The numbers reveal a clear trend across the region:
• Malaysia: The trade surplus with the U.S. jumped to $23.2 billion in 2025 from $15.9 billion the previous year, according to CEIC Data. This figure is more than ten times larger than it was a decade ago.
• Vietnam: The country recorded the largest surplus with the U.S. among Southeast Asian nations, reaching a record $133.8 billion in 2025, a 28% year-on-year increase.
• Thailand: The trade surplus climbed to $51.3 billion in 2025, up from $35.6 billion a year earlier, driven largely by electronics exports.

The export boom occurred despite President Trump's announcement of "reciprocal" tariffs in April, which were designed to shrink America's trade deficit. Some Southeast Asian countries were initially hit with duties exceeding 40% before the tariffs took effect in August after bilateral negotiations led to reductions.
Businesses responded by front-loading shipments, accelerating exports to get ahead of the deadlines. Meanwhile, governments continued to negotiate with Washington to soften the blow.
In October, the U.S. lowered its tariff on most Malaysian goods from 25% to 19%. A list of 1,711 items, mainly in semiconductors, aerospace, and pharmaceuticals, now face zero tariffs. In exchange, Malaysia promised not to impose export bans or quotas on rare earth elements and critical minerals destined for the U.S.
"ASEAN will seek to secure preferential rates to limit the downside impact," noted DBS Bank senior economist Chua Han Teng in a report. "Notably, Malaysia is actively negotiating with the U.S. to maintain exemptions for its semiconductor exports from fresh tariffs."
While trade surpluses with the U.S. grew, the three nations' trade deficits with China widened considerably. This suggests an influx of goods from Asia's largest economy, which is also contending with high U.S. tariffs.
In 2025, Malaysia's trade deficit with China widened by 62% to $38.4 billion. Thailand's deficit grew 50% to $67.8 billion, and Vietnam's expanded by 40% to $115 billion.
"China exports cheap goods, and now with EV imports, [Malaysia's] trade deficit with China in future could be wider," commented Vaseehar Hassan Abdul Razack, executive vice chairman at KSI Strategic Institute for Asia Pacific.

Some analysts believe Chinese companies may be routing goods through neighboring countries like Vietnam before shipping them to the U.S. to bypass American tariffs. Jaideep Singh, an analyst at the Institute of Strategic & International Studies Malaysia, noted that Malaysia's share of domestic exports fell to 77%, its lowest level in at least seven years.
"This means that while most of Malaysia's exports are still manufactured and processed domestically, re-exports of goods produced elsewhere are rising," he said.
Uncertainty over U.S. trade policy is set to continue into 2026. This month, President Trump announced an increase in tariffs on South Korean automobiles from 15% to 25%. He also threatened, but later retracted, a 10% tariff on European nations that opposed his efforts to acquire Greenland.
Analysts and governments in Southeast Asia warn that export growth could slow this year as the full-year impact of the tariffs takes hold.
Thailand's Commerce Ministry stated on January 23 that its 2026 export outlook is "expected to moderate, reflecting the clearer impact of U.S. tariff measures."
The DBS report echoed this sentiment, noting that Malaysia's goods exports are "likely to be negatively impacted by external headwinds from US tariffs." Chua also pointed out that the tariffs "will pose a major challenge to Vietnam's export-oriented manufacturing sector and its economy in 2026."
Archanun Kohpaiboon, a visiting senior fellow at the ISEAS-Yusof Ishak Institute, believes last year's trend is unlikely to continue. "The [U.S.] trade deal with many countries would be in effect," he said. "Hence, these economies tend to import more from the U.S. and the trade surplus would reduce. This would, of course, pose risk to the ASEAN economy in 2026."
White Label
Data API
Web Plug-ins
Poster Maker
Affiliate Program
The risk of loss in trading financial instruments such as stocks, FX, commodities, futures, bonds, ETFs and crypto can be substantial. You may sustain a total loss of the funds that you deposit with your broker. Therefore, you should carefully consider whether such trading is suitable for you in light of your circumstances and financial resources.
No decision to invest should be made without thoroughly conducting due diligence by yourself or consulting with your financial advisors. Our web content might not suit you since we don't know your financial conditions and investment needs. Our financial information might have latency or contain inaccuracy, so you should be fully responsible for any of your trading and investment decisions. The company will not be responsible for your capital loss.
Without getting permission from the website, you are not allowed to copy the website's graphics, texts, or trademarks. Intellectual property rights in the content or data incorporated into this website belong to its providers and exchange merchants.
Not Logged In
Log in to access more features
Log In
Sign Up