


Markets
News
Analysis
User
24/7
Economic Calendar
Education
Data
- Names
- Latest
- Prev


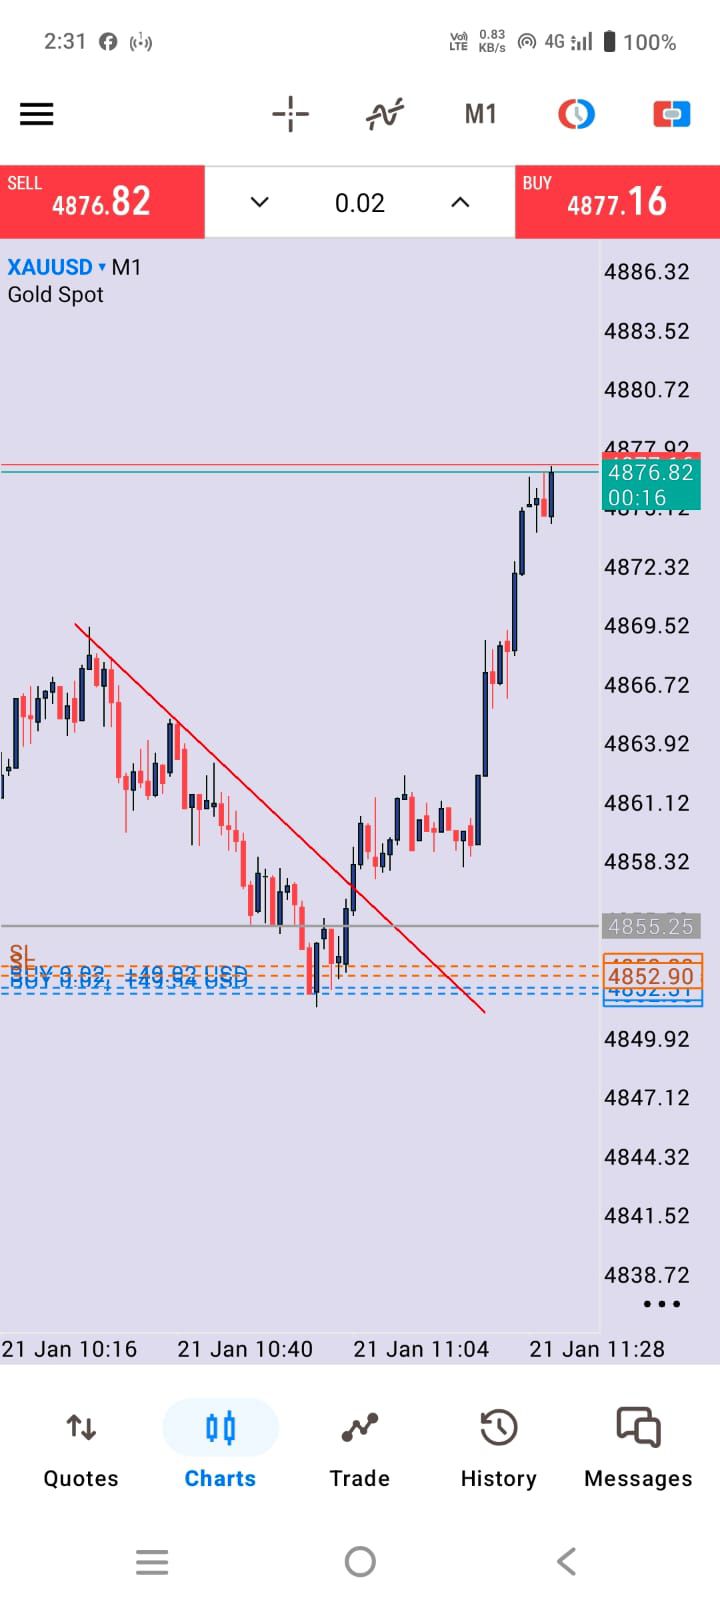


Spot gold jumped 1.7% to a new all-time high of $4,844.39 an ounce by 21:13 ET (02:13 GMT), extending a relentless rally that has pushed bullion to successive all-time highs this month.
Gold prices smashed through $4,800 an ounce on Wednesday, scaling another record high as escalating tensions linked to Greenland and renewed trade frictions rattled global markets and drove investors toward safe-haven assets.
Spot gold jumped 1.7% to a new all-time high of $4,844.39 an ounce by 21:13 ET (02:13 GMT), extending a relentless rally that has pushed bullion to successive all-time highs this month.
U.S. Gold Futures climbed1.3% to $4,830.04.
Gold prices have jumped more than 5% this week, including today's gains.
The latest surge came as relations between the U.S. and Europe remained strained over Greenland's strategic importance.
U.S. President Donald Trump has insisted there is "no going back" on Greenland, citing security concerns in the Arctic, and has threatened tariffs against European countries, unsettling markets already on edge over global trade risks.
French President Emmanuel Macron said Europe would not bow to "bullies," stressing that respect and cooperation, not coercion, should define relations between allies.
His remarks, delivered on the sidelines of the World Economic Forum in Davos, underscored growing unease in Europe over Washington's rhetoric and trade threats tied to the Greenland dispute.
Trump sought to calm nerves by saying the U.S. was working on the issue and aimed for an outcome that would satisfy NATO, but investors remained cautious.
Investor demand for gold was further boosted by weakness in the U.S. dollar, which slid about 0.8% on Tuesday to a two-week low.
The US Dollar Index traded 0.2% lower during Asian hours on Wednesday.
A softer dollar makes gold cheaper for holders of other currencies and typically lifts demand for the non-yielding metal.
Among other precious metals, silver prices edged slightly lower to $93.9/oz after hitting a record high of $95.87.oz on Tuesday.
Platinum rose to a record high of $2,519.51/oz on Wednesday but later pared gains to trade 0.6% lower at $2,450.9/oz.
728 RM B 7/F GEE LOK IND BLDG NO 34 HUNG TO RD KWUN TONG KLN HONG KONG


The risk of loss in trading financial instruments such as stocks, FX, commodities, futures, bonds, ETFs and crypto can be substantial. You may sustain a total loss of the funds that you deposit with your broker. Therefore, you should carefully consider whether such trading is suitable for you in light of your circumstances and financial resources.
No decision to invest should be made without thoroughly conducting due diligence by yourself or consulting with your financial advisors. Our web content might not suit you since we don't know your financial conditions and investment needs. Our financial information might have latency or contain inaccuracy, so you should be fully responsible for any of your trading and investment decisions. The company will not be responsible for your capital loss.
Without getting permission from the website, you are not allowed to copy the website's graphics, texts, or trademarks. Intellectual property rights in the content or data incorporated into this website belong to its providers and exchange merchants.
Not Logged In
Log in to access more features

FastBull Membership
Not yet
Purchase


Log In
Sign Up


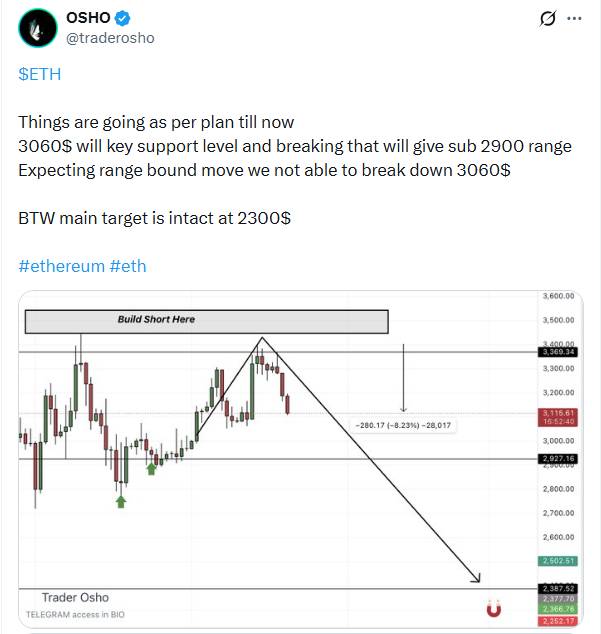 Ethereum Price Chart | Source: OSHO
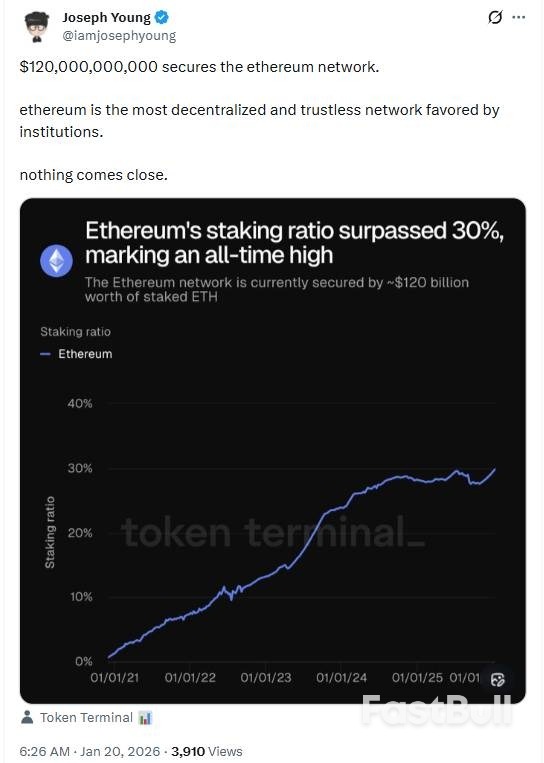 Ethereum Decentralization Showcase | Source: Joseph Young
