• Trade
  • Markets
  • Copy
  • Contests
  • News
  • 24/7
  • Calendar
  • Q&A
  • Chats
Trending
Screeners
SYMBOL
LAST
BID
ASK
HIGH
LOW
NET CHG.
%CHG.
SPREAD
SPX
S&P 500 Index
6827.42
6827.42
6827.42
6899.86
6801.80
-73.58
-1.07%
--
DJI
Dow Jones Industrial Average
48458.04
48458.04
48458.04
48886.86
48334.10
-245.98
-0.51%
--
IXIC
NASDAQ Composite Index
23195.16
23195.16
23195.16
23554.89
23094.51
-398.69
-1.69%
--
USDX
US Dollar Index
97.890
97.970
97.890
98.070
97.890
-0.060
-0.06%
--
EURUSD
Euro / US Dollar
1.17429
1.17436
1.17429
1.17447
1.17262
+0.00035
+ 0.03%
--
GBPUSD
Pound Sterling / US Dollar
1.33852
1.33861
1.33852
1.33856
1.33546
+0.00145
+ 0.11%
--
XAUUSD
Gold / US Dollar
4349.31
4349.72
4349.31
4350.16
4294.68
+49.92
+ 1.16%
--
WTI
Light Sweet Crude Oil
57.279
57.309
57.279
57.601
57.194
+0.046
+ 0.08%
--

Community Accounts

Signal Accounts
--
Profit Accounts
--
Loss Accounts
--
View More

Become a signal provider

Sell trading signals to earn additional income

View More

Guide to Copy Trading

Get started with ease and confidence

View More

Signal Accounts for Members

All Signal Accounts

Best Return
  • Best Return
  • Best P/L
  • Best MDD
Past 1W
  • Past 1W
  • Past 1M
  • Past 1Y

All Contests

  • All
  • Trump Updates
  • Recommend
  • Stocks
  • Cryptocurrencies
  • Central Banks
  • Featured News
Top News Only
Share

Philippine Presidential Palace, Citing Foreign Ministry, Says It Will File Demarche To Chinese Embassy Today

Share

USA - Listed Shares Of Gold Miners Rise Premarket After Gold Rises About 1%

Share

The Council Of The European Union: In Light Of The Situation In Venezuela, The Council Decided Today To Extend The Existing Restrictions For Another Year, Until 10 January 2027

Share

Ivory Coast 2025/26 Cocoa Arrivals Reached 894000 T By December 14 Versus 895000 T Year Ago - Exporters' Estimate

Share

Ishares MSCI Chile ETF Up 3.9% Premarket After Jose Antonio Kast Wins Chile's Presidential Election On Sunday

Share

Spain's Debt-To-GDP Ratio Falls To 103.2% In Third Quarter 2025

Share

China's Central Bank: Authorises DBS Bank As Yuan Clearing Bank In Singapore

Share

Bank Of Korea - South Korea Central Bank, Nps Agree To Extend Currency Swap Agreement For Another Year

Share

Poland's CPI At 0.1% Month-On-Month In November Versus 0.1% Released Earlier

Share

London Metal Exchange (LME): Copper Inventories Decreased By 25 Tons, Aluminum Inventories Decreased By 50 Tons, Nickel Inventories Increased By 360 Tons, Zinc Inventories Increased By 2,550 Tons, Lead Inventories Increased By 17,725 Tons, And Tin Inventories Increased By 125 Tons

Share

Polish Inflation At 2.5% Year-On-Year In November

Share

Poland's January-October Import Up 5.4% To 309.3 Billion Euros

Share

Poland's January-October Trade Balance At -5.1 Billion Euros

Share

Poland's January-October Export Up 2.8% To 304.3 Billion Euros

Share

Ceasefire Negotiations Between Ukraine And US Representatives In Berlin To Continue Monday Morning - German Source Familiar With The Schedule

Share

Spain's IBEX Hits Fresh Record High, Up Over 1%

Share

Spot Silver Rises Nearly 3% To $63.82/Oz

Share

France's Foreign Minister Says He Suggesd To EU's Kallas That US Representatives Brief EU Foreign Ministers On Gaza Peace Plan During Their Meeting

Share

India Trade Secretary: Prime Facie Don't See A Case Of Rice Dumping To USA And There Is No Active Investigation On That

Share

India Trade Secretary: India's Rice Exported To USA Largely Limited To Basmati And At Price Higher Than General Price Of Rice

TIME
ACT
FCST
PREV
France HICP Final MoM (Nov)

A:--

F: --

P: --

China, Mainland Outstanding Loans Growth YoY (Nov)

A:--

F: --

P: --

China, Mainland M2 Money Supply YoY (Nov)

A:--

F: --

P: --

China, Mainland M0 Money Supply YoY (Nov)

A:--

F: --

P: --

China, Mainland M1 Money Supply YoY (Nov)

A:--

F: --

P: --

India CPI YoY (Nov)

A:--

F: --

P: --

India Deposit Gowth YoY

A:--

F: --

P: --

Brazil Services Growth YoY (Oct)

A:--

F: --

P: --

Mexico Industrial Output YoY (Oct)

A:--

F: --

P: --

Russia Trade Balance (Oct)

A:--

F: --

P: --

Philadelphia Fed President Henry Paulson delivers a speech
Canada Building Permits MoM (SA) (Oct)

A:--

F: --

P: --

Canada Wholesale Sales YoY (Oct)

A:--

F: --

P: --

Canada Wholesale Inventory MoM (Oct)

A:--

F: --

P: --

Canada Wholesale Inventory YoY (Oct)

A:--

F: --

P: --

Canada Wholesale Sales MoM (SA) (Oct)

A:--

F: --

P: --

Germany Current Account (Not SA) (Oct)

A:--

F: --

P: --

U.S. Weekly Total Rig Count

A:--

F: --

P: --

U.S. Weekly Total Oil Rig Count

A:--

F: --

P: --

Japan Tankan Small Manufacturing Outlook Index (Q4)

A:--

F: --

P: --

Japan Tankan Large Non-Manufacturing Diffusion Index (Q4)

A:--

F: --

P: --

Japan Tankan Large Non-Manufacturing Outlook Index (Q4)

A:--

F: --

P: --

Japan Tankan Large Manufacturing Outlook Index (Q4)

A:--

F: --

P: --

Japan Tankan Small Manufacturing Diffusion Index (Q4)

A:--

F: --

P: --

Japan Tankan Large Manufacturing Diffusion Index (Q4)

A:--

F: --

P: --

Japan Tankan Large-Enterprise Capital Expenditure YoY (Q4)

A:--

F: --

P: --

U.K. Rightmove House Price Index YoY (Dec)

A:--

F: --

P: --

China, Mainland Industrial Output YoY (YTD) (Nov)

A:--

F: --

P: --

China, Mainland Urban Area Unemployment Rate (Nov)

A:--

F: --

P: --

Saudi Arabia CPI YoY (Nov)

A:--

F: --

P: --

Euro Zone Industrial Output YoY (Oct)

--

F: --

P: --

Euro Zone Industrial Output MoM (Oct)

--

F: --

P: --

Canada Existing Home Sales MoM (Nov)

--

F: --

P: --

Euro Zone Total Reserve Assets (Nov)

--

F: --

P: --

U.K. Inflation Rate Expectations

--

F: --

P: --

Canada National Economic Confidence Index

--

F: --

P: --

Canada New Housing Starts (Nov)

--

F: --

P: --

U.S. NY Fed Manufacturing Employment Index (Dec)

--

F: --

P: --

U.S. NY Fed Manufacturing Index (Dec)

--

F: --

P: --

Canada Core CPI YoY (Nov)

--

F: --

P: --

Canada Manufacturing Unfilled Orders MoM (Oct)

--

F: --

P: --

U.S. NY Fed Manufacturing Prices Received Index (Dec)

--

F: --

P: --

U.S. NY Fed Manufacturing New Orders Index (Dec)

--

F: --

P: --

Canada Manufacturing New Orders MoM (Oct)

--

F: --

P: --

Canada Core CPI MoM (Nov)

--

F: --

P: --

Canada Trimmed CPI YoY (SA) (Nov)

--

F: --

P: --

Canada Manufacturing Inventory MoM (Oct)

--

F: --

P: --

Canada CPI YoY (Nov)

--

F: --

P: --

Canada CPI MoM (Nov)

--

F: --

P: --

Canada CPI YoY (SA) (Nov)

--

F: --

P: --

Canada Core CPI MoM (SA) (Nov)

--

F: --

P: --

Canada CPI MoM (SA) (Nov)

--

F: --

P: --

Federal Reserve Board Governor Milan delivered a speech
U.S. NAHB Housing Market Index (Dec)

--

F: --

P: --

Australia Composite PMI Prelim (Dec)

--

F: --

P: --

Australia Services PMI Prelim (Dec)

--

F: --

P: --

Australia Manufacturing PMI Prelim (Dec)

--

F: --

P: --

Japan Manufacturing PMI Prelim (SA) (Dec)

--

F: --

P: --

U.K. Unemployment Claimant Count (Nov)

--

F: --

P: --

U.K. Unemployment Rate (Nov)

--

F: --

P: --

U.K. 3-Month ILO Unemployment Rate (Oct)

--

F: --

P: --

Q&A with Experts
    • All
    • Chatrooms
    • Groups
    • Friends
    Connecting
    .
    .
    .
    Type here...
    Add Symbol or Code

      No matching data

      All
      Trump Updates
      Recommend
      Stocks
      Cryptocurrencies
      Central Banks
      Featured News
      • All
      • Russia-Ukraine Conflict
      • Middle East Flashpoint
      • All
      • Russia-Ukraine Conflict
      • Middle East Flashpoint

      Search
      Products

      Charts Free Forever

      Chats Q&A with Experts
      Screeners Economic Calendar Data Tools
      Membership Features
      Data Warehouse Market Trends Institutional Data Policy Rates Macro

      Market Trends

      Market Sentiment Order Book Forex Correlations

      Top Indicators

      Charts Free Forever
      Markets

      News

      News Analysis 24/7 Columns Education
      From Institutions From Analysts
      Topics Columnists

      Latest Views

      Latest Views

      Trending Topics

      Top Columnists

      Latest Update

      Signals

      Copy Rankings Latest Signals Become a signal provider AI Rating
      Contests
      Brokers

      Overview Brokers Assessment Rankings Regulators News Claims
      Broker listing Forex Brokers Comparison Tool Live Spread Comparison Scam
      Q&A Complaint Scam Alert Videos Tips to Detect Scam
      More

      Business
      Events
      Careers About Us Advertising Help Center

      White Label

      Data API

      Web Plug-ins

      Affiliate Program

      Awards Institution Evaluation IB Seminar Salon Event Exhibition
      Vietnam Thailand Singapore Dubai
      Fans Party Investment Sharing Session
      FastBull Summit BrokersView Expo
      Recent Searches
        Top Searches
          Markets
          News
          Analysis
          User
          24/7
          Economic Calendar
          Education
          Data
          • Names
          • Latest
          • Prev

          View All

          No data

          Scan to Download

          Faster Charts, Chat Faster!

          Download App
          English
          • English
          • Español
          • العربية
          • Bahasa Indonesia
          • Bahasa Melayu
          • Tiếng Việt
          • ภาษาไทย
          • Français
          • Italiano
          • Türkçe
          • Русский язык
          • 简中
          • 繁中
          Open Account
          Search
          Products
          Charts Free Forever
          Markets
          News
          Signals

          Copy Rankings Latest Signals Become a signal provider AI Rating
          Contests
          Brokers

          Overview Brokers Assessment Rankings Regulators News Claims
          Broker listing Forex Brokers Comparison Tool Live Spread Comparison Scam
          Q&A Complaint Scam Alert Videos Tips to Detect Scam
          More

          Business
          Events
          Careers About Us Advertising Help Center

          White Label

          Data API

          Web Plug-ins

          Affiliate Program

          Awards Institution Evaluation IB Seminar Salon Event Exhibition
          Vietnam Thailand Singapore Dubai
          Fans Party Investment Sharing Session
          FastBull Summit BrokersView Expo

          Australia & New Zealand: What’s Up For The Down Under Economies?

          WELLS FARGO

          Economic

          Summary:

          Against a backdrop of a U.S economic slowdown and Fed easing, a more gradual pace of rate cuts from the RBA and RBNZ could offer some support to the Australian and NZ dollars against the greenback over time.

          Summary

          • The Reserve Bank of Australia (RBA) held its policy rate steady at 4.35% this week as expected, and its accompanying announcement was more hawkish than expected. The RBA did not rule out a further increase in interest rates, saying inflation—especially services inflation—is still high.
          • We do not expect a further RBA rate increase, but with the central bank forecasting above-target inflation for an extended period, we believe rate cuts are some way off. We anticipate an initial 25 bps rate cut at the August meeting, while also acknowledging the balance of risks as tilted toward a later move.
          • In New Zealand, improving sentiment surveys suggest the economy is moving toward recovery after a challenging 2023, while domestically oriented inflation pressures remain elevated. That backdrop is contributing to a continued hawkish stance from the Reserve Bank of New Zealand, which has not ruled out further rate hikes and said there is a way to go before inflation returns to target. We now see RBNZ rate cuts occurring later than previously envisaged, and forecast an initial 25 bps reduction at the August announcement.
          • Against a backdrop of a U.S economic slowdown and Fed easing, a more gradual pace of rate cuts from the RBA and RBNZ could offer some support to the Australian and NZ dollars against the greenback over time.

          Hawkish Hold From the Reserve Bank of Australia

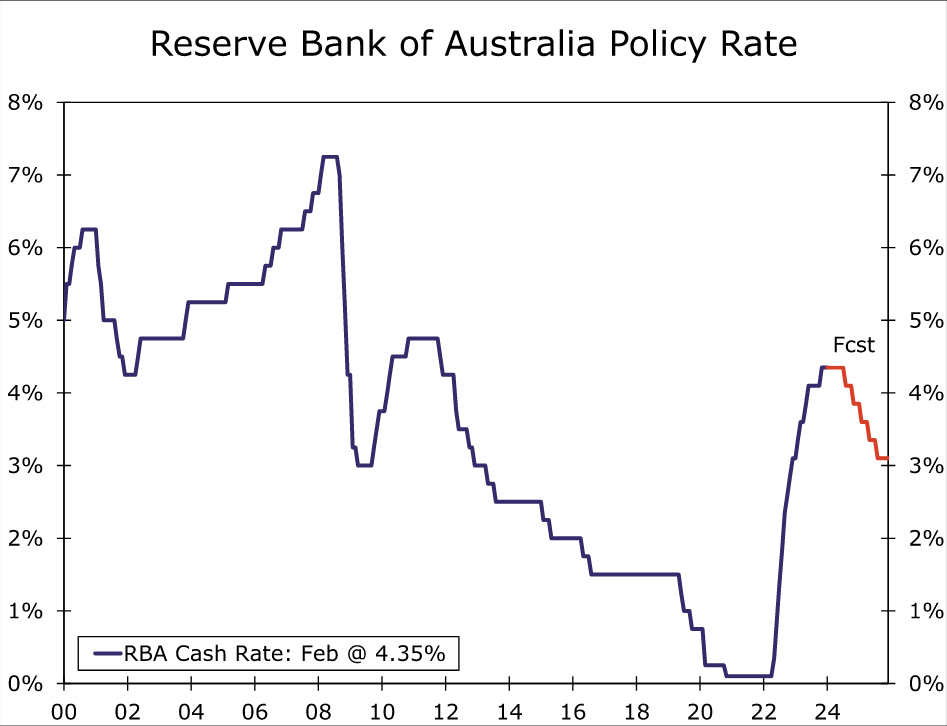
          The Reserve Bank of Australia (RBA) held its policy interest rate at 4.35% at this week’s meeting, as widely expected. While acknowledging slower growth and improving inflation trends, the RBA is nonetheless clearly wary of reducing interest rates prematurely. This is reflected in several elements of its announcement:

          • Inflation remains high at 4.1 per cent. Goods inflation has slowed, but services inflation has declined at a more gradual pace, consistent with continuing excess demand and strong domestic cost pressures.
          • The RBA remains highly attentive to inflation risks.
          • While conditions in the labor market continue to ease gradually, they remain tighter than is consistent with sustained full employment and inflation at target.
          • The RBA expects it will be some time yet before inflation is sustainably in the target range of 2%-3%. The path of interest rates that will best ensure that inflation returns to target in a reasonable timeframe will depend upon the data and the evolving assessment of risks, and a further increase in interest rates cannot be ruled out.

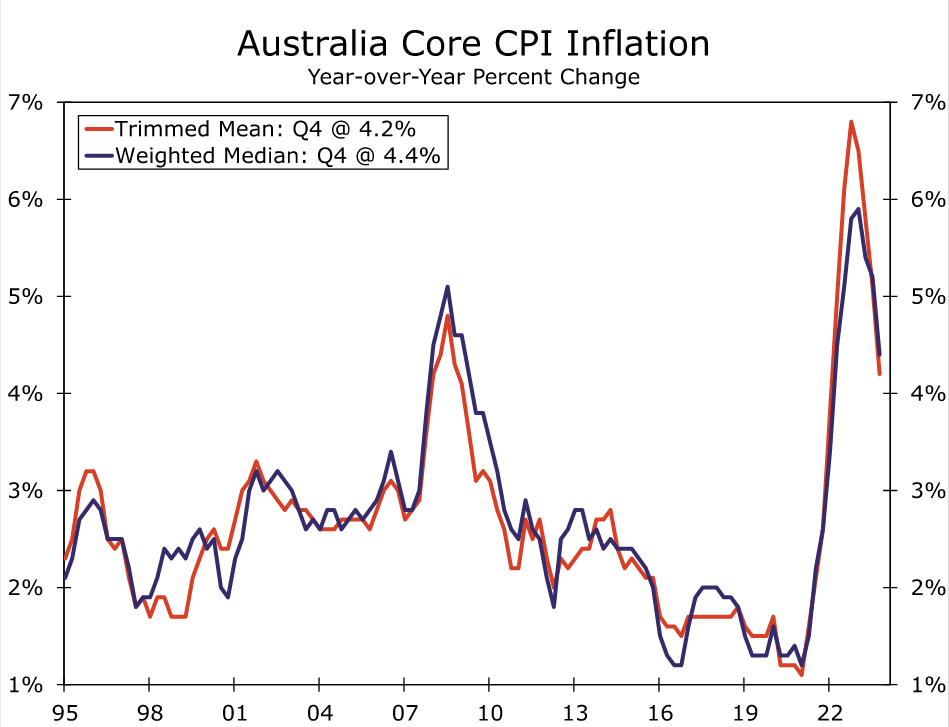
          Importantly, therefore, the RBA kept the possibility of a rate increase on the table, even as it lowered both its GDP growth and CPI inflation forecasts. With respect to economic activity, the RBA now forecasts annual average GDP growth of 1.5% for 2024, down from the 1.8% it forecast in November. It also projects a slightly faster rise in the unemployment rate to 4.3% by the end of this year, compared to 4.2% previously. Meanwhile, despite a downside surprise for Australia’s CPI in Q4-2023, inflation is expected to remain above the 2%-3% inflation target range for an extended period. Both headline inflation and trimmed mean inflation are not forecast to return to that target range until the end of 2025, and are not forecast to be at the midpoint of that range until mid-2026.

          Keep in mind these forecasts are all predicated on the technical assumption of a policy rate path that is broadly consistent with market implied pricing, which sees the policy rate at 4.3% in mid-2024 and 3.9% by end-2024. Even with that technical assumption, however, the RBA projects inflation remaining above the target range for an extended period. In our view, given that RBA continues to highlight that “returning inflation to target within a reasonable timeframe remains the Board’s highest priority”, at the very least that suggests rate cuts are unlikely to come before the second half of this year. That is, we view the RBA’s announcement and forecasts as consistent with interest rate cuts starting in the second half of this year or later.

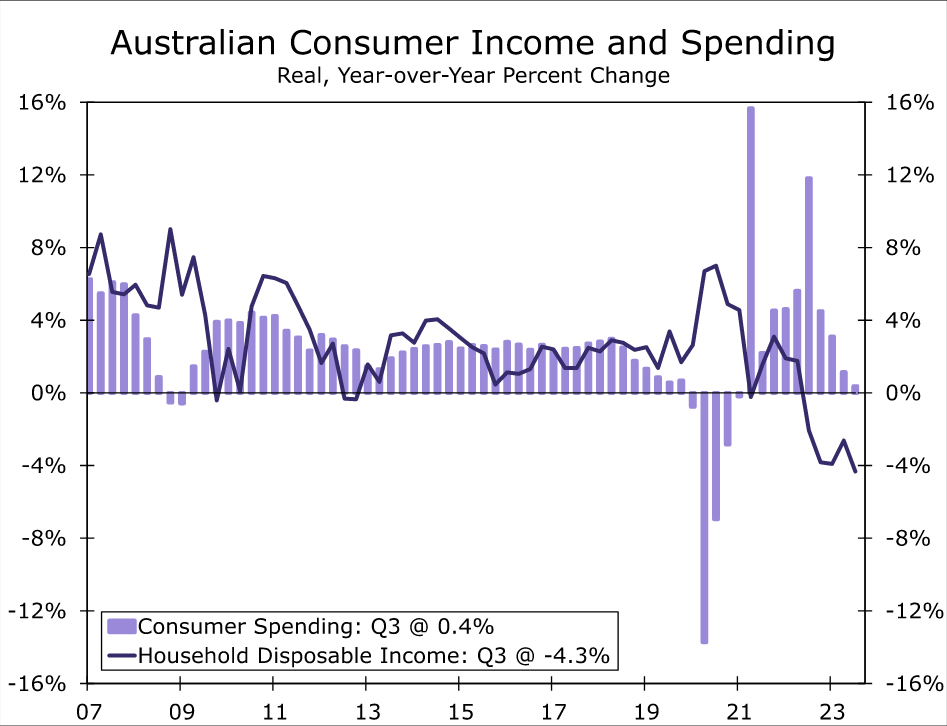
          Against this backdrop, we doubt that sluggish economic growth will elicit early easing from Australia’s central bank. The RBA has repeatedly highlighted an uncertain outlook for the consumer, uncertainty that is reflected in recent data. Q4 real retail sales rose a modest 0.3% quarter-over-quarter and, while that was better than expected, it was offset by a downward revision to Q3 sales. In fact, the increase in quarterly sales was the first since Q3-2022, and thus, in our view, represents more stabilization than strength in retail activity. In terms of consumer fundamentals, real household disposable incomes fell 4.3% year-over-year in Q3-2023 and the household saving rate dropped to just 1.1% of disposable income, arguing against a quick rebound in consumer spending. Perhaps on a more encouraging note however, tax cuts scheduled for 1 July have been adjusted to provide greater support to lower income earners, which should at least offer some support for consumer spending, and help to limit the extent of any slowdown in the overall economy.

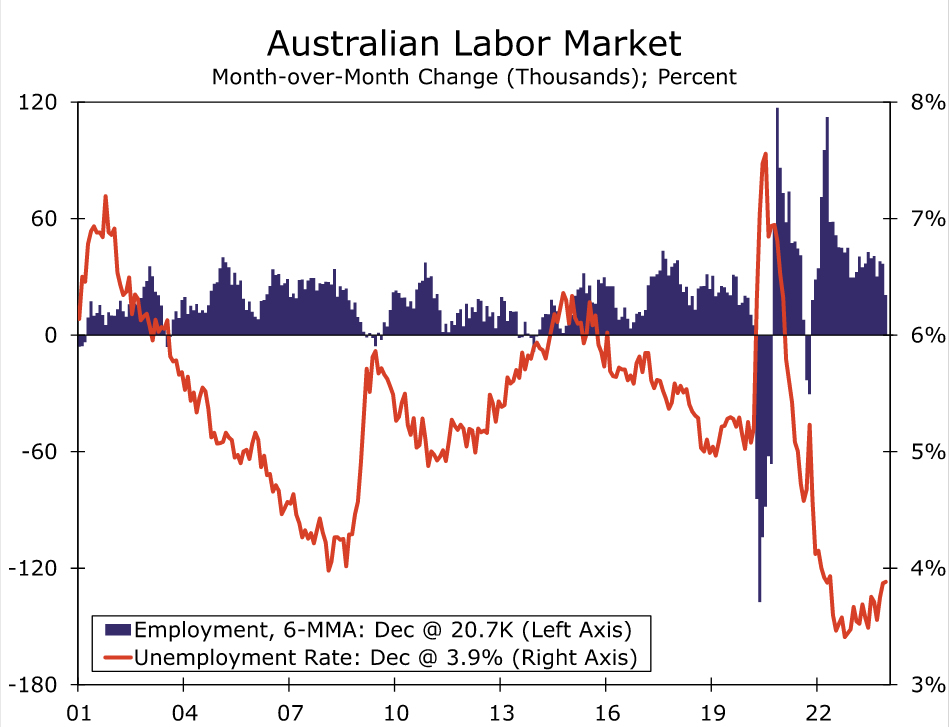
          Even amid slow growth, the labor market has remained reasonably resilient so far. Employment has been particularly volatile in recent months, with a large December decline in jobs broadly offsetting a big November increase. Looking through that volatility, the average monthly employment increase slowed during the second half of last year to a still-respectable 20,700 per month. The unemployment rate has also increased to 3.9%, from as low as 3.4% in late 2022. While the labor market has loosened to some extent, we note that a further moderate increase in unemployment and slowing in wage growth (from the current 4.1% year-over-year for the Wage Price Index) would be in line with the RBA’s forecast, and could make the central bank more comfortable that inflation is returning sustainably to the target range.

          Accordingly, we think an initial RBA rate cut remains some way off. At this time, we remain comfortable with our outlook for an initial 25 bps rate reduction to 4.10% at the August monetary policy announcement, by which time the labor market will likely have softened further, and wage and price pressures will likely have moderated somewhat. We also expect the pace of rate cuts to be quite gradual even after that initial easing, at just 25 bps per quarter, which means the RBA’s policy rate would not reach a low of 3.10% until the second half of 2025. While we see risks around this policy rate outlook in both directions, those risks are perhaps tilted toward a later rate cut than an earlier rate cut. Persistence in services or wage inflation could easily see an initial rate cut pushed back to Q4 of this year while, although it is not our base case, an especially sharp slowdown in consumer spending or inflation pressures could still prompt the RBA to move earlier than August.

          The pace of monetary easing we forecast for the RBA, at least through the end of 2024, is broadly in line with that implied by market pricing. As mentioned, however, the risks are more heavily tilted toward a later move. Moreover, even our base case for an initial RBA rate cut in August sees Australia’s central bank moving noticeably later than the Federal Reserve, where we expect an initial rate cut to occur in May. Overall, a gradual moderation of Australian economic growth and inflation that leads to only a gradual pace of monetary easing from the Reserve Bank of Australia should be supportive of the Australian dollar versus the greenback over time.

          High Inflation and Recovering Economy Keeping New Zealand Central Bank Hawkish

          In New Zealand, the economy appears to be moving toward recovery after what was a challenging year through much of 2023. The impact of elevated inflation and the Reserve Bank of New Zealand’s (RBNZ) aggressive monetary tightening contributed to GDP reporting sequential declines in three out of four quarters through Q3-2023, according to the latest available figures. Election-related uncertainty may have also provided a temporary restraint to growth late last year. Q3-2023 saw New Zealand’s GDP fall 0.3% quarter-over-quarter and 0.6% year-over-year: economic underperformance that occurred even as immigration, and population growth, surged.

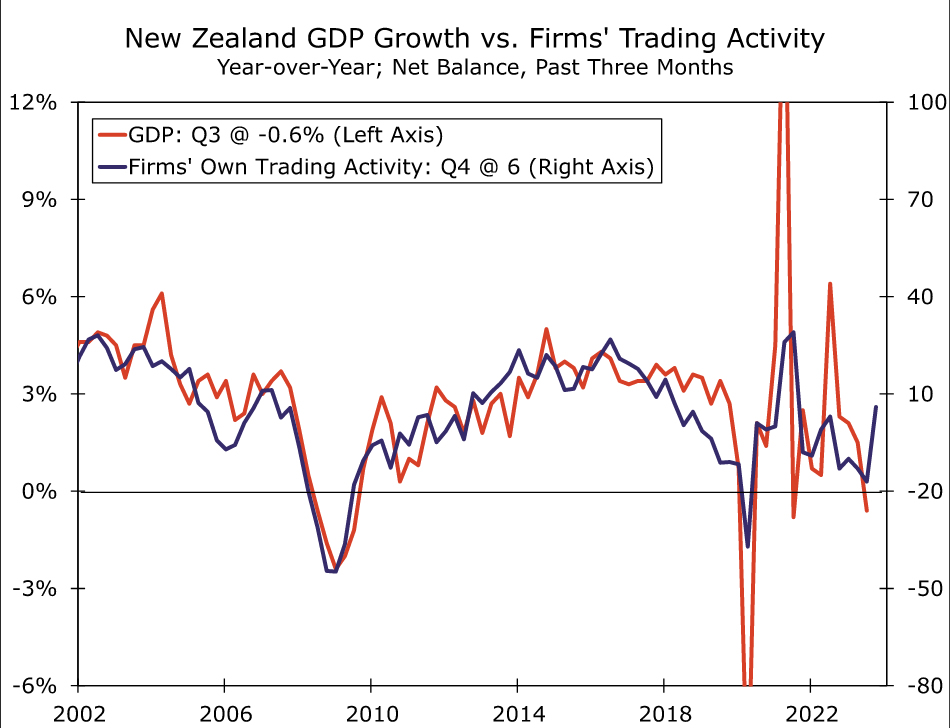
          Some key economic headwinds facing New Zealand are now starting to abate; inflation has peaked, and we also believe the RBNZ has come to the end of its rate hike cycle. We think that should gradually allow for the economy to transition to a recovery phase, even if these key fundamentals have not turned to significant tailwinds just yet. That appears to be reflected in some available economic indicators for Q4 of last year. Most importantly, the Quarterly Survey of Business Opinion saw businesses become much less downbeat, as just a net 2% of businesses were pessimistic in Q4, compared to the net 52% of businesses who were pessimistic in Q3. Moreover, a net 6% of respondents reported an increase in their own trading activity in Q4, compared to net 17% who reported a decrease in Q3. This latter point is significant as, historically, it is firms’ assessment of their own trading activity that has tended to be more closely correlated with overall GDP growth.

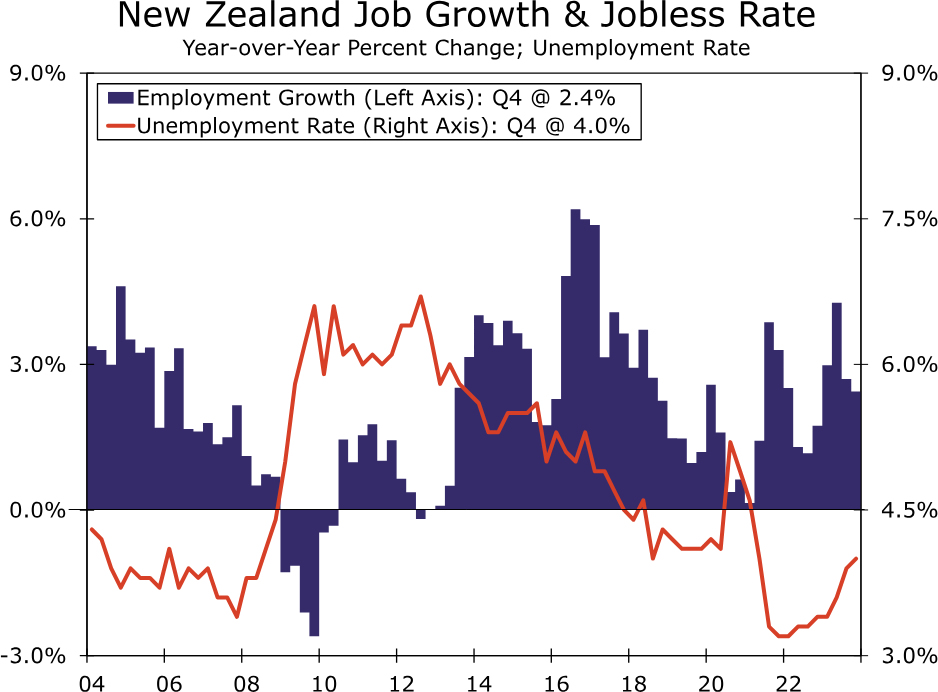
          The improvement in sentiment in Q4 suggests that a gradual economic recovery may be upon us, a message that is also reflected in labor market data for the fourth quarter. Q4 employment rose 0.4% quarter-over-quarter, rebounding following a small decline in Q3, while employment was also up 2.4% year-over-year. The unemployment rate did edge higher to 4.0%, though in part, that stems from surging population growth. In fact, if anything, rising unemployment may help to place some restraint on wage pressures. The fourth quarter also saw the Labor Cost Index for the private sector rise to 1.0% quarter-over-quarter and ease to 3.9% year-over-year. Overall, we believe the New Zealand economy can enjoy a moderate recovery this year. We forecast GDP growth of 1.2% for 2024, which would be up from an estimated 0.8% growth in 2023.

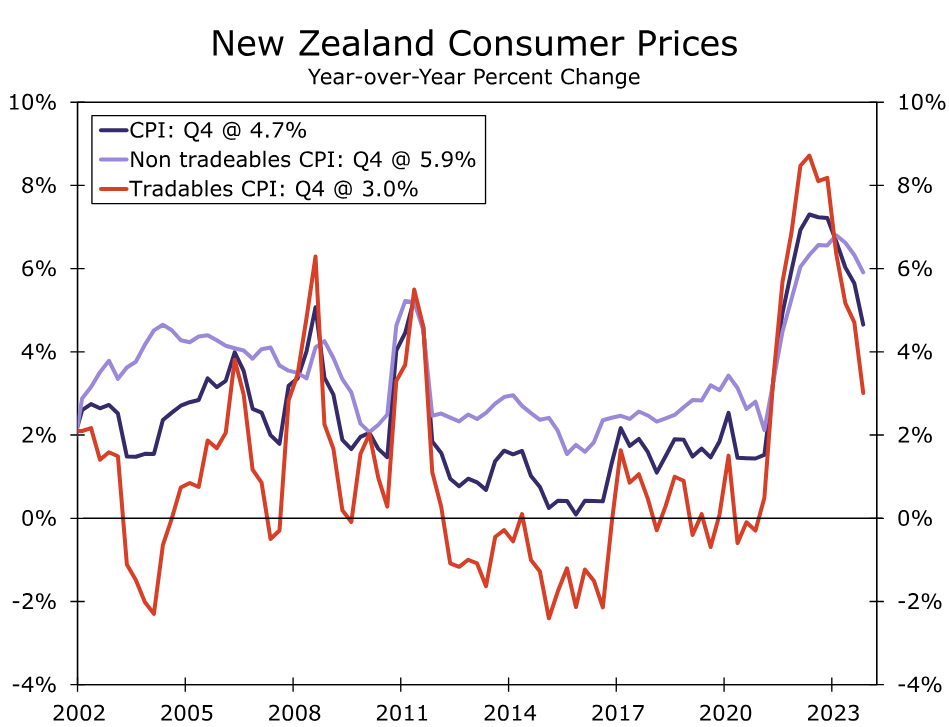
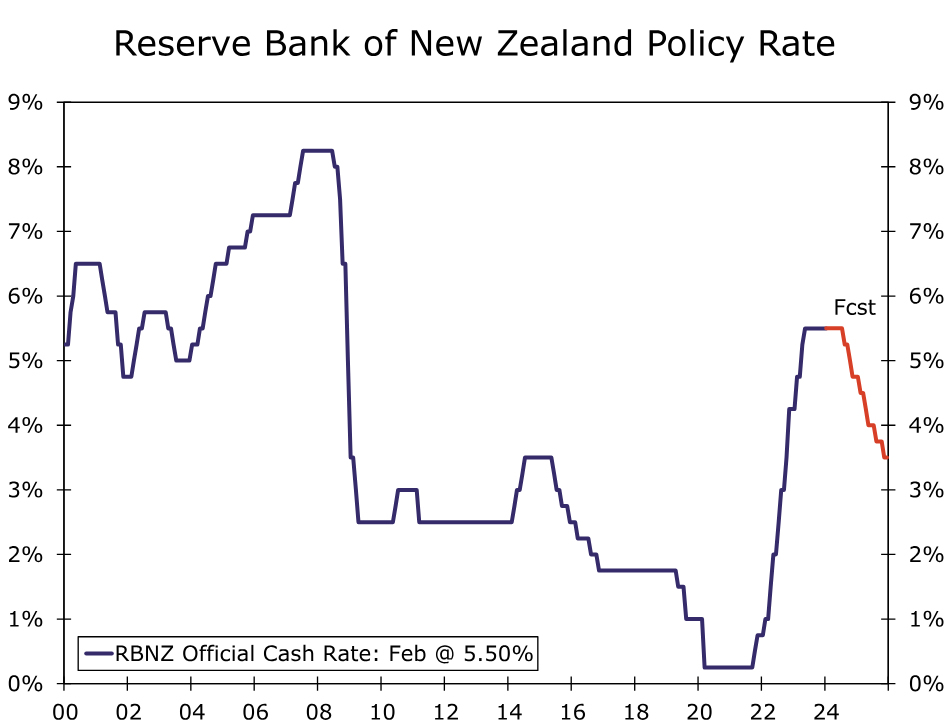
          On the inflation front, consumer prices have started to recede, although domestically oriented inflation pressures remain persistent. Q4 CPI inflation slowed to 4.7% year-over-year, matching the consensus forecast. However, although tradeables inflation surprised to the downside and slowed to 3.0%, non-tradeables inflation surprised to the upside, with only a moderate slowing to 5.9%. Both headline inflation and, more particularly, domestically-oriented inflation, remain well above the central bank’s 2% inflation target. As a result, the RBNZ has maintained a relatively hawkish monetary policy stance. At its most recent announcement in November, the RBNZ said that despite some decline, inflation remains too high, and policymakers maintain a wariness of inflationary pressures. In fact, the central bank said if inflationary pressures were stronger than expected, the policy rate would likely need to increase further. In more recent comments, RBNZ Chief Economist Conway offered additional hawkish comments. Conway said non-tradeables inflation was higher than expected and a long way from 2%, and that the central bank still has a way to go to get inflation back to target. Given the backdrop of improving sentiment, domestic inflationary pressures and a hawkish central bank, we now see RBNZ policy rate cuts occurring later than previously envisaged. We expect an initial 25 bps rate cut to 5.25% at the August announcement. Beyond that, we see a relatively steady pace of easing, with our forecast for a cumulative 75 bps of rate cuts in 2024, and a further cumulative 125 bps of rate cuts in 2025, which would see the RBNZ’s policy rate reach 3.50% by the end of next year. Against a backdrop of a U.S economic slowdown and Fed easing, we believe a moderate rebound in NZ economic growth and gradual RBNZ monetary easing should see the New Zealand dollar enjoy moderate gains against the U.S. dollar over time.

          Article Source: ACTIONFOREX

          To stay updated on all economic events of today, please check out our Economic calendar
          Risk Warnings and Disclaimers
          You understand and acknowledge that there is a high degree of risk involved in trading. Following any strategies or investment methods may lead to potential losses. The content on the site is provided by our contributors and analysts for information purposes only. You are solely responsible for determining whether any trading assets, securities, strategy, or any other product is suitable for investing based on your own investment objectives and financial situation.
          Comments
          Add to Favorites
          Share

          It Wasn't AI: How Fiscal Supports, Supply Chain Healing, & Full Employment Explain Exceptional Productivity In 2023

          Owen Li
          Impressive Q4 and 2023 Data: Last Thursday’s Q4 GDP release showed impressive strength and a sneaky upshot for data officially released tomorrow (February 1): productivity growth is set to look exceptionally strong for 2023. Real GDP in 2023Q4 grew at a 3.3% annualized rate as of the first preliminary estimate, with non-farm real gross value-added growing at a 3.7% annualized rate. Meanwhile, the preliminary estimate of hours worked in 2023Q4 showed only 0.8% annualized growth. Put the two together, and it implies a 2.8% annualized gain in nonfarm output-per-hour labor productivity. For some perspective, in the 5-15 years that preceded the pandemic, productivity growth only averaged about 1.45%.
          Not a Fluke: It’s not as if this is merely one quarter of upside amidst a noisy trend; year-over-year productivity growth has flipped decisively from -2.0% in 2022Q3 to +2.4% in 2023Q3, and is now set to accelerate further to 2.7% in Q4. These numbers would put nonfarm productivity at a level above the pre-pandemic trend and on an encouraging trajectory. It Wasn't AI: How Fiscal Supports, Supply Chain Healing, & Full Employment Explain Exceptional Productivity In 2023_1
          Looking Strong Versus History: As we’ve noted before, productivity growth has rarely looked this good over the past 50 years, especially if we exclude recession-related periods of job loss in which productivity first spikes before fully reverting back over time.It Wasn't AI: How Fiscal Supports, Supply Chain Healing, & Full Employment Explain Exceptional Productivity In 2023_2
          Why Do We Care About Higher Productivity Growth? Faster productivity growth implies that wages and gross labor income growth can grow faster without straining inflationary constraints. As we’ve written before, “potential output” and “maximum employment” are dynamic concepts with time-varying locations. When jobs and wages can grow faster without straining inflation, it reveals improvement in potential output and maximum employment, thereby allowing everyone the chance to earn and enjoy a higher standard of living.

          The Investment Data Does Not Show An AI-Driven Upturn

          It’s Unlikely That This Productivity Upturn Was Driven By Advances in AI: It might be tempting to attribute any prospect of higher productivity growth to the latest and highest hyped technological trend. Unfortunately, it does not match up with details of what’s driving output and output per hour growth. Fixed investment in software, technological hardware, and R&D were all slowing and relatively tepid in 2023. To the extent there is an AI boom that catalyzes more capital spending and capital deepening, we’re just not seeing in the data thus far. It Wasn't AI: How Fiscal Supports, Supply Chain Healing, & Full Employment Explain Exceptional Productivity In 2023_3
          Construction and Fiscal Policy Mattered More: Real fixed investment growth rebounded in 2023 thanks to (1) a housing market shifting from contraction to stabilization and (2) an accelerating expansion in nonresidential construction. Two key facts supported growth here, neither of which had much to do with AI developments: (1) cooling construction cost inflation (as supply chains healed) and (2) the hyperbolic rise in manufacturing plant construction. Manufacturing plant construction itself seems to be a downstream and anticipated effect of how fiscal and industrial-level policies (CHIPS, IRA) are meant to support private investment. It Wasn't AI: How Fiscal Supports, Supply Chain Healing, & Full Employment Explain Exceptional Productivity In 2023_4
          It Wasn't AI: How Fiscal Supports, Supply Chain Healing, & Full Employment Explain Exceptional Productivity In 2023_5AI Might Matter To Productivity In 2024:It would not surprise us to see faster real investment in tech hardware and software, but it’s a better forward-looking view than a good description of what has already transpired. As tempting as it might be, we would resist the urge to invoke a hot technology trend to explain productivity data on a "just-so" basis; that’s precisely the kind of evidence-free (or evidence-confirming) approach to macro that we seek to avoid. It Wasn't AI: How Fiscal Supports, Supply Chain Healing, & Full Employment Explain Exceptional Productivity In 2023_6

          The Consumer Drove Most Of The Output Outperformance In 2023

          Consumer-Led Outperformance: While real fixed investment typically outperforms real consumption in business cycle expansions, in 2023, the two were virtually equal. Given the consumer’s outsized share of total final spending, it’s safe to describe 2023 GDP outperformance as consumer-led in total-dollar and total-chained-dollar terms. It Wasn't AI: How Fiscal Supports, Supply Chain Healing, & Full Employment Explain Exceptional Productivity In 2023_7
          Nominal Consumer Spending Growth Was Strong But It Didn’t Drive The Acceleration: While real consumer spending growth accelerated meaningfully, nominal consumer spending did not accelerate. Make no mistake, consumer spending is still growing at a reasonably solid clip, but it did slow over the course of 2023. Real consumption acceleration was therefore directly brought about through the same force that caused price disinflation, a clear sign of supply-side improvement.It Wasn't AI: How Fiscal Supports, Supply Chain Healing, & Full Employment Explain Exceptional Productivity In 2023_8
          If You Zoom Into Consumption, You’ll See That The Acceleration Was Concentrated In Durable Goods: While real consumption on services actually stabilized over the course of 2023, and real consumption nondurable goods only marginally popped reverted from contraction back into expansion, durable goods are the clear positive stand out. Real durable goods consumption accelerated from 0% year-over-year growth in 2022Q4 to 6% year-over-year growth in 2023Q4. Any narrative about “supply-side improvement” should be able to explain why it was durable goods consumption that most visibly benefited.It Wasn't AI: How Fiscal Supports, Supply Chain Healing, & Full Employment Explain Exceptional Productivity In 2023_9
          Real Durable Goods Consumption Acceleration Was Broad-Based: While goods that had some adjacency to the “chip shortage” (motor vehicles and parts, recreational information processing equipment) saw outsized outperformance, the pickup in real durable goods consumption growth was visible across all major categories.
          Supply-Side Improvement Was Likely About Supply Chain Healing, Not Labor Supply: Durable goods production and distribution are not typically understood to involve a high intensity of domestic labor. The biggest challenge with durable goods in 2021 and 2022 was the physical capacity to produce key inputs, which were constrained on a global scale as a result of bullwhipped demand and the idiosyncratic policy measures to mitigate a global pandemic. As these issues have gradually unwound, motor vehicle production exited a 2-year supply-driven depression and consumers were in a better position to purchase and secure the technological hardware and software they had demanded. As much as the labor market also went through bullwhips and shortages of its own, it’s not clear that domestic labor availability was a key factor in this dimension of productivity improvement. Domestic labor content in consumed durable goods is quite low.

          The Dividends of Full Employment Are Growing More Visible

          Full Employment Has Helped: Productivity, as measured in terms of “output-per-hour,” is a ratio of real output to hours worked. Real output indeed accelerated, but hours worked also decelerated, falling from 3% year-over-year in 2022Q4 to 1.1% year-over-year in 2023Q4 (as per the latest estimate).
          The Evidence Keeps Pointing To High Employment Rates Aiding Productivity Growth. We now have three distinct episodes in which productivity growth outperformed in the past 40 years for reasons other than aggregate job loss: the late 1990s, 2019, and 2023. What do those periods have in common? The Prime-Age 25-54 Employment Rate was elevated and above 80%, such that labor market was in a more mature state and job and hours growth was primed to endogenously cool. Productivity growth is a multi-causal phenomenon, but recent history suggests that getting to elevated levels of prime-age employment raise the odds of achieving impressive growth outcomes. In a univariate linear specification that excludes recession-distorted observations, 1% higher on the Prime-Age Employment Rate translates into an additional 0.3% of productivity growth.It Wasn't AI: How Fiscal Supports, Supply Chain Healing, & Full Employment Explain Exceptional Productivity In 2023_10
          If You Take The “Time-To-Train” Effects Seriously, A Faster Recovery Is A Better Recovery: There will be a lot of consternation about whether it was really worth it for fiscal and monetary policymakers to err on the side of an aggressive and swift employment recovery. There will be enough time for such retrospectives, but we would flag one key channel we discussed in an earlier piece: it takes time to unlock the productivity gains from an initial hire. A hire takes time to materially add to output and productivity, and that’s why strong hiring tends to coincide with weak productivity growth at first (hours grow faster than output). Layoffs and separations also do not have their full effect on productivity instantaneously, and that’s why productivity tends to spike when job loss is most acute. The sooner prospective workers are hired and trained up, the sooner the prospect for "true" productivity gains to shine through. The faster we get to a fully recovered state of the labor market, the sooner we might see outsized productivity gains and escape stagnant growth.
          2024 Productivity Improvement Is Far From A Given: Continued productivity growth will require a variety of policy efforts and some good fortune. The interest in specialized hardware and software for AI applications has the potential to unlock more meaningful “capital deepening” in 2024. The scale of public investment legislation (IIJA, IRA, CHIPS) is admirable, but it will require judicious implementation decisions (and a data-dependent Fed) to ensure that these acts optimally “crowd in” private investment. Amidst an array of risks, the state of supply chains and commodity availability will also need continuous monitoring and tailored solutions along the way. As for maintaining full employment outcomes, the Fed is best positioned to be a first line of defense given the unique discretion they wield. We hope Fed officials will see the full supply- and demand-side stakes of achieving a soft landing in 2024.

          Source:EMPLOY AMERICA

          Risk Warnings and Disclaimers
          You understand and acknowledge that there is a high degree of risk involved in trading. Following any strategies or investment methods may lead to potential losses. The content on the site is provided by our contributors and analysts for information purposes only. You are solely responsible for determining whether any trading assets, securities, strategy, or any other product is suitable for investing based on your own investment objectives and financial situation.
          Comments
          Add to Favorites
          Share

          Will January’s US CPI Inflation Be a Game Changer?

          XM

          Economic

          Central Bank

          US economy has a blockbuster performance

          The US economy has left analysts speechless. Although the Fed has raised interest rates to the highest in four decades, the economy kept growing at a healthy pace in the last quarter of 2023 and six months after the central bank paused its tightening cycle.
          The first data releases of the new year pointed to a soft landing or no landing at all. Nonfarm payrolls increased by 353k in January, and December’s reading was revised upwards by more than 100k. On the negative side, part-time jobs were mainly responsible for the increase in new job positions, but overall, the unemployment rate remained around record lows. On top of that, average hourly earnings continued to gain momentum for the third consecutive month and comfortably above the diminishing inflation rate, suggesting that consumers have enough purchasing power to fuel more demand for goods and services.
          Retail sales for January could reflect the latest changes in spending habits on Thursday at 13:30 GMT. Analysts expect a monthly slowdown to 0.1% from 0.6% previously. The retail sales control group data, which excludes volatile items, could ease from 0.8% m/m to 0.5%.
          Will January’s US CPI Inflation Be a Game Changer?_1
          Developments on the business front were encouraging, too. The ISM and S&P global business PMI readings expanded faster than analysts expected in January, reporting a notable increase in new orders and hiring. However, what caused a stir was a significant pickup in cost pressures in the services sector. The price index jumped by 7.3 points to 64.00 to the highest since March 2023, reminding investors that the fight against inflation is far from over.

          How could CPI inflation data affect sentiment?

          On Tuesday, investors will search for more clues on recent price tendencies when January’s CPI inflation data come into the public eye. Forecasts point to a stable headline CPI inflation of 3.4% y/y and a weaker core CPI of 3.7% y/y compared to 3.9% previously.
          If forecasts materialize, investors may defend the May rate cut scenario. Note that the probability of a late spring rate cut declined to a toss-up following last week’s upbeat data. Hence, any surprise in the data could be a game changer for rate prospects, but perhaps a tweak in the total number of projected rate cuts could cause more volatility since investors remain confident that the Fed will deliver more than four 25 bps rate cuts despite the central bank projecting only three.
          Will January’s US CPI Inflation Be a Game Changer?_2

          USD/JPY

          In FX markets, weaker-than-expected CPI data could oppose the Fed’s wait-and-see stance over rate cuts, putting USDJPY under pressure. Still, from a technical perspective, only a clear close back below the 147.00-147.40 zone, where its 20-day simple moving average (SMA) is positioned, could raise new selling interest.
          In the opposite scenario where inflation extends December’s upturn and, more importantly, the core CPI drifts higher too, investors might move the case of a rate cut from May to the summer. There are multiple risk events, from a potential wage-price spiral to rising geopolitical tensions affecting global trade routes, which could still lift business costs and therefore send positive price shockwaves to consumers throughout the year.
          Will January’s US CPI Inflation Be a Game Changer?_3
          At the same time, the more persistent inflation is, the more fragile the economy can become to a potential downturn as households’ savings ratio is currently at the lowest since the 2007-2009 financial crisis. Moreover, the latest bank episode with the regional New York Community Bancorp revealed that the drop in commercial property values – partially on the back of remote jobs – could raise risks in the financial system. The Fed chief admitted that smaller banks could close or merge, but he added that the issue should be manageable, with the Treasury secretary Jannet Yellen backing that narrative too.
          Will January’s US CPI Inflation Be a Game Changer?_4
          Nevertheless, talks of economic struggles could be a topic for another day. In the meantime, an upside surprise in CPI figures would justify the Fed’s guidance and bode well for the greenback, sending USDJPY above the 149.70 barrier and towards 151.00.

          Source:XM

          To stay updated on all economic events of today, please check out our Economic calendar
          Risk Warnings and Disclaimers
          You understand and acknowledge that there is a high degree of risk involved in trading. Following any strategies or investment methods may lead to potential losses. The content on the site is provided by our contributors and analysts for information purposes only. You are solely responsible for determining whether any trading assets, securities, strategy, or any other product is suitable for investing based on your own investment objectives and financial situation.
          Comments
          Add to Favorites
          Share

          Persistent Weakness Persists in the Natural Gas Landscape

          Chandan Gupta

          Traders' Opinions

          Commodity

          Energy

          In the current market scenario, investors are on the lookout for a potential bottom as natural gas grapples with persistent weakness. Thursday witnessed the continuation of a downward trajectory, with prices teetering around the $2 mark. Despite a brief attempt at a rally, natural gas prices surrendered gains, painting a picture of prevailing negativity in the market. Now, with prices flirting with the $2 threshold, concerns are mounting about further downside potential, and the $1.80 level is emerging as a potential support zone.
          Blame it on the lackluster winter season – milder temperatures have taken a toll on natural gas demand. As we shift our focus towards the impending spring season, sentiment towards natural gas remains subdued. This shift in attention highlights the challenges the market is grappling with, and prospects for an immediate recovery seem limited.
          While a trading range for the year might still come into play, the $1.80 level is a crucial consideration for potential support. Historical technical analysis indicates a precedent for support at this level, offering a glimmer of stability amid the current turbulence.
          Now, here's where it gets interesting – caution is in order for those eyeing short positions. Yes, the market is on a downward spiral, but the extended movement southward hints at the potential for a sharp about-face in the future. While signs of such a reversal aren't crystal clear yet, the risk-reward dynamics of shorting at current levels might not be playing in favor of the shorts.
          Given this uncertain outlook, a cautious approach is the name of the game for market participants. While opportunities for a rebound might pop up, predicting the timing and extent of such a turnaround is akin to predicting the weather – it's a bit tricky. So, maintaining a watchful stance and keeping an eye on key technical levels is just smart investing 101.
          Looking ahead, the $2.50 level could be the apple of buyers' eyes, serving as a target for those looking to capitalize on potential swing trades. This level holds a special place in the market – it's like the cool kid at school that everyone wants to be friends with. Options traders might find it particularly intriguing, adding to its significance.
          In a nutshell, the natural gas market is stuck in a rut, grappling with persistent downward pressure. While potential support around the $1.80 level throws a lifeline for stabilization, the overall sentiment is pretty subdued. The looming risk of a sharp reversal is the elephant in the room, making caution and vigilance the golden rules for investors navigating this challenging market environment.Persistent Weakness Persists in the Natural Gas Landscape_1
          Risk Warnings and Disclaimers
          You understand and acknowledge that there is a high degree of risk involved in trading. Following any strategies or investment methods may lead to potential losses. The content on the site is provided by our contributors and analysts for information purposes only. You are solely responsible for determining whether any trading assets, securities, strategy, or any other product is suitable for investing based on your own investment objectives and financial situation.
          Comments
          Add to Favorites
          Share

          S&P 500 Surges, Maintaining Upward Trajectory in Market Trends

          Chandan Gupta

          Stocks

          Traders' Opinions

          The S&P 500 is on a positive trajectory, inching closer to the much-anticipated 5000 level that has the attention of investors worldwide. The early hours of Thursday's trading session have shown stability, hinting at a potential continuation of the upward trend established in Wednesday's positive conclusion.
          The significance of breaching the 5000 level is hard to overlook, as it marks a prominent round number and a highly anticipated target for many in the market. All eyes are now on the unfolding events in the near term, with the potential for a breakthrough prompting both profit-taking activities and a surge in Fear of Missing Out (FOMO) trading, adding more momentum to the market.
          It's important to note that despite its name, the S&P 500 is dominated by a handful of influential stocks, making the performance of key constituents like Tesla and Amazon crucial. This is particularly true given the prevalence of passive investing strategies.
          Amidst the prevailing bullish sentiment, short-term pullbacks are expected to create buying opportunities. The market dynamics suggest a retracement towards the 4900 level, with additional support anticipated around the 4800 mark. However, the psychological significance of the 5000 level is expected to introduce noise and volatility, urging caution among investors.
          While maintaining a prudent approach to position sizing, it's clear that the prevailing bullish pressure leans towards a bullish bias in trading decisions. The overall sentiment remains firmly tilted towards further upside potential.
          The S&P 500's relentless pursuit of the 5000 level reflects the optimism among investors. As we brace for potential milestones, including profit-taking and heightened FOMO trading, a cautious yet bullish stance is warranted. In the midst of noise and volatility surrounding key psychological levels, strategic positioning and vigilance are imperative in navigating the evolving landscape of the S&P 500.
          The S&P 500's reliance on seven key stocks highlights the significance of a handful of major players in steering the index's course. The ongoing prosperity of these market leaders appears to be the linchpin for further gains in the index. Still, the true extent of this upward trajectory remains uncertain, with all eyes fixed on the eagerly anticipated 5,000 milestone.
          In the grand scheme of things, the S&P 500's bullish momentum persists, fueled by robust market dynamics and a generally optimistic investor sentiment. While there are undoubtedly challenges on the horizon, particularly as we approach the psychological hurdle of 5,000, the market's fundamental strength and resilience seem unwavering. Successful navigation of the market's intricacies and capitalizing on emerging opportunities calls for pragmatic trading approaches and a sharp awareness of potential risks.S&P 500 Surges, Maintaining Upward Trajectory in Market Trends_1
          Let's dive a bit deeper into this scenario. The dominance of a select group of stocks in the S&P 500 raises intriguing questions about the nature of market dynamics. It's almost like a squad of star players leading the charge in a sports team – as long as they're in top form, the team tends to perform well. In this case, our star players are those seven key stocks, and their performance is steering the broader market trends.
          The uncertainty, however, lies in the fact that the market's gaze is fixed firmly on the magic number – 5,000. It's like waiting for a milestone in a video game, not quite sure what happens when you reach that level but knowing it's a big deal. The anticipation surrounding this number adds an element of suspense to the market, and everyone is eager to see how the story unfolds.
          Now, as we wrap our heads around this situation, it's essential to acknowledge that challenges are part and parcel of the game. Think of it like navigating a tricky obstacle course – there might be a few hurdles to overcome, especially as we approach the psychological threshold of 5,000. It's akin to that moment when you're close to beating a difficult level, and suddenly, the difficulty spikes. But fear not, because just like in a game, our market seems to have a knack for overcoming hurdles.
          What keeps the game interesting is the market's underlying strength and resilience. It's like having a reliable character in your team – even when the going gets tough, you know you can count on them. Similarly, the market seems to have this underlying strength that helps it weather storms and emerge on the other side.
          Now, let's talk strategy. Navigating through the twists and turns of the market requires a bit of finesse, much like playing a strategic board game. Adopting a pragmatic approach to trading is like having a well-thought-out game plan – it minimizes the chances of making rash decisions and maximizes the potential for success. Pair that with a keen awareness of potential risks, and you've got a winning combination.
          In conclusion, the S&P 500's reliance on a select few stocks and the impending 5,000 milestone create an intriguing narrative in the world of finance. It's a bit like being part of an unfolding story, where the plot twists keep us on the edge of our seats. As we navigate through these financial adventures, staying mindful of potential risks and employing smart trading strategies becomes our compass. After all, in the dynamic world of markets, it pays to be both strategic and nimble, ready to seize opportunities and tackle challenges as they come our way.S&P 500 Surges, Maintaining Upward Trajectory in Market Trends_2
          Risk Warnings and Disclaimers
          You understand and acknowledge that there is a high degree of risk involved in trading. Following any strategies or investment methods may lead to potential losses. The content on the site is provided by our contributors and analysts for information purposes only. You are solely responsible for determining whether any trading assets, securities, strategy, or any other product is suitable for investing based on your own investment objectives and financial situation.
          Comments
          Add to Favorites
          Share

          EUR/USD Outlook: Keeping a Close Eye on the 1.07 Level

          Chandan Gupta

          Traders' Opinions

          Forex

          Economic

          Fundamental Analysis

          Thursday saw the Euro keeping things low-key, sticking to a designated range without much excitement. All eyes are on the 1.07 level, with a clear focus on exploring the lower boundary of what seems to be a significant consolidation zone. It's like peering into a microscope, honing in on the details of a specific spot.
          Why all the attention on 1.07? Well, it's become a hotspot for traders, a place where potential shifts in the Euro's stance are under the microscope. Think of it as a buzzworthy location in a bustling city – everyone's talking about it, and the market is buzzing with the anticipation of some action.
          Now, as we zoom out for a broader view, the Federal Reserve's plans for rate cuts in 2024 have set the stage for a dance between the Euro and the US dollar. It's a bit like a choreographed routine – the Euro taking a step back due to expectations of similar measures by the European Central Bank (ECB). Throw in some concerns about the German economy potentially slipping into a recession, and you've got a storyline with twists and turns.
          Considering this backdrop, it seems like the Euro might be gearing up for a rollercoaster ride this year. Picture it as a theme park attraction – you know there will be ups and downs, but the anticipation builds as you strap in for the ride. However, signs point more towards the lower end of the spectrum than reaching its peak. So, market watchers are on high alert, keeping their eyes peeled for any hints of a rebound on the horizon.
          In the grand finale, the Euro's recent performance reflects a cautious dance within a set trading range. It's a bit like a careful waltz, navigating the intricacies of global economic factors and the policies of central banks that are shaping the Euro's trajectory. As traders keep tabs on key levels and anticipate potential shifts, the Euro's journey in the trading landscape unfolds like a captivating story, keeping everyone hooked for the next chapter.

          Technical Analysis

          If the Euro dips below the 1.07 level, it could be signaling a potential journey down to the 1.05 mark. Now, why is 1.05 a big deal? Think of it as a milestone birthday – it's a round number that tends to attract a lot of attention, almost like the center of the stage at a party. Traders would likely be giving it the side-eye, and it might even become a solid support system for the Euro.
          On the flip side, picture this: if the Euro manages to break free and soar above the 200-day Exponential Moving Average (EMA), it could be setting the stage for a dance towards the 50-day EMA. It's a bit like a gymnast nailing a challenging routine – a move that signifies the US dollar might be losing some of its strength, leading to a broader decline. Cue the metaphorical applause.
          Now, let's talk about the current market vibe. It's like trying to find the perfect playlist for a road trip – there's a constant effort to find the right mix. Right now, the market is trying to figure out the Euro's groove within its annual range. Trading the Euro is like navigating through a familiar landscape, and it has this habit of sticking to well-established ranges. It's a bit like your favorite TV show – you know what to expect, but there's always a twist or two to keep things interesting.
          This annual range is a recurring theme in the EUR/USD pair's storyline. It's like a reliable character trait – you almost always see it every year. The Euro isn't exactly known for its wild, unpredictable side. Instead, it's more of a steady player, like that friend who always has a level head and stays within their comfort zone.
          So, as traders gear up for the next act in this market drama, the focus is on how the Euro navigates within its established ranges. It's not about expecting sudden twists and turns but rather understanding the well-defined patterns it tends to follow. It's a bit like being on a familiar road – you know the bends and curves, making it easier to anticipate what might be around the corner.
          In essence, the Euro's journey in the trading landscape involves these familiar markers – the 1.07 and 1.05 levels, the dance between EMAs, and the annual range. It's like following a roadmap that traders use to navigate through the currency market. The Euro might not be the flashy, attention-grabbing star, but its consistency and adherence to established ranges make it a reliable character in the unfolding narrative of currency trading.EUR/USD Outlook: Keeping a Close Eye on the 1.07 Level_1
          To stay updated on all economic events of today, please check out our Economic calendar
          Risk Warnings and Disclaimers
          You understand and acknowledge that there is a high degree of risk involved in trading. Following any strategies or investment methods may lead to potential losses. The content on the site is provided by our contributors and analysts for information purposes only. You are solely responsible for determining whether any trading assets, securities, strategy, or any other product is suitable for investing based on your own investment objectives and financial situation.
          Comments
          Add to Favorites
          Share

          Canadian Employment Surpasses Expectations, While Wage Growth Slows to 5.3%

          Ukadike Micheal

          Economic

          Forex

          Canada's labor market kicked off the new year with robust job gains, reporting the largest increase in four months. The addition of 37,000 jobs in January, primarily driven by part-time work, surpassed expectations, leading to a decline in the unemployment rate to 5.7%, marking the first decrease since December 2022. While the positive job figures indicate economic resilience, slowing wage growth suggests potential relief from inflationary pressures, potentially paving the way for the Bank of Canada to contemplate rate cuts in the months ahead.
          The unexpected employment surge, exceeding the estimated gain of 15,000 positions, reflects a notable shift in the labor market landscape. Part-time jobs and the service sector played a pivotal role in driving these gains. This positive momentum resulted in the unemployment rate falling to 5.7%, offering a promising start to the year and a departure from the trend seen over the past 12 months.
          However, the headline figures also reveal a nuanced story. Despite the job gains, the spotlight turns to wage growth, which decelerated to 5.3% for permanent employees, down from 5.7% in the previous month. This slowing wage growth suggests a potential easing of inflationary pressures, a crucial factor influencing the monetary policy decisions of the Bank of Canada.
          As the Canadian dollar initially strengthened post-release, markets reacted to the unexpected positive employment data. The currency's rise and the yield on the benchmark Canadian two-year note slipping indicate investor sentiment and expectations surrounding the economic outlook.
          The broader economic context includes considerations of population growth, largely fueled by robust immigration, outpacing employment gains. This underscores a scenario of expanding supply amidst cooling demand, particularly influenced by high borrowing costs that have put a stall on economic activity. The increased slack in the economy appears to be contributing to the cooling of wages, a key metric closely monitored by the central bank.
          The data provides policymakers with room for potential interest rate adjustments. While the Bank of Canada maintained policy rates at 5% in January, the door appears open for discussions on adjusting borrowing costs in the future. The January data suggests that while the labor market has tightened slightly, conditions remain more relaxed compared to a year ago.
          Despite elevated wage growth, policymakers interpret these gains as largely catching up with the cost of living, emphasizing the lagging nature of wage growth as an indicator of labor market activity. The expectation is for a gradual moderation in wage growth, with labor shortages now considered at "normal levels," and the economy demonstrating more supply than demand. Anticipated future labor market adjustments are likely to manifest through increases in unemployment.
          Looking ahead, the next rate decision on March 6 will be pivotal. Economists widely anticipate policymakers to maintain policy rates at 5% for the fifth consecutive meeting, with the easing cycle potentially commencing between April and July. Total hours worked in January rose by 1.1% from a year ago, signaling ongoing economic activity, though the participation rate declined slightly to 65.3%.
          The decline in the participation rate, particularly among the youth aged 15 to 24, indicates evolving dynamics in the labor force. While the employment rate witnessed a slight dip, the proportion of the working-age population employed remains a critical metric for understanding broader economic health.
          Employment gains were distributed across various sectors, with notable contributions from wholesale and retail trade, finance and real estate, and educational services. However, declines were observed in accommodation and food services, professional and technical services, as well as health care and social assistance.
          Canada's January job report paints a complex picture of a resilient labor market, where positive job gains counterbalance the nuanced challenge of slowing wage growth. The economic landscape suggests considerations for potential monetary policy adjustments, with implications for investors and market dynamics. As the Bank of Canada navigates these nuances, the future trajectory of interest rates will be closely watched, influencing broader economic sentiments and investment strategies.

          Source: Bloomberg

          To stay updated on all economic events of today, please check out our Economic calendar
          Risk Warnings and Disclaimers
          You understand and acknowledge that there is a high degree of risk involved in trading. Following any strategies or investment methods may lead to potential losses. The content on the site is provided by our contributors and analysts for information purposes only. You are solely responsible for determining whether any trading assets, securities, strategy, or any other product is suitable for investing based on your own investment objectives and financial situation.
          Comments
          Add to Favorites
          Share
          FastBull
          Copyright © 2025 FastBull Ltd

          728 RM B 7/F GEE LOK IND BLDG NO 34 HUNG TO RD KWUN TONG KLN HONG KONG

          TelegramInstagramTwitterfacebooklinkedin
          App Store Google Play Google Play
          Products
          Charts

          Chats

          Q&A with Experts
          Screeners
          Economic Calendar
          Data
          Tools
          Membership
          Features
          Function
          Markets
          Copy Trading
          Latest Signals
          Contests
          News
          Analysis
          24/7
          Columns
          Education
          Company
          Careers
          About Us
          Contact Us
          Advertising
          Help Center
          Feedback
          User Agreement
          Privacy Policy
          Business

          White Label

          Data API

          Web Plug-ins

          Poster Maker

          Affiliate Program

          Risk Disclosure

          The risk of loss in trading financial instruments such as stocks, FX, commodities, futures, bonds, ETFs and crypto can be substantial. You may sustain a total loss of the funds that you deposit with your broker. Therefore, you should carefully consider whether such trading is suitable for you in light of your circumstances and financial resources.

          No decision to invest should be made without thoroughly conducting due diligence by yourself or consulting with your financial advisors. Our web content might not suit you since we don't know your financial conditions and investment needs. Our financial information might have latency or contain inaccuracy, so you should be fully responsible for any of your trading and investment decisions. The company will not be responsible for your capital loss.

          Without getting permission from the website, you are not allowed to copy the website's graphics, texts, or trademarks. Intellectual property rights in the content or data incorporated into this website belong to its providers and exchange merchants.

          Not Logged In

          Log in to access more features

          FastBull Membership

          Not yet

          Purchase

          Become a signal provider
          Help Center
          Customer Service
          Dark Mode
          Price Up/Down Colors

          Log In

          Sign Up

          Position
          Layout
          Fullscreen
          Default to Chart
          The chart page opens by default when you visit fastbull.com