- XAUUSD
- XAGUSD
- WTI
- USDX
Markets
Analysis
User
24/7
Economic Calendar
Education
Data
- Names
- Latest
- Prev


Signal Accounts for Members
All Signal Accounts
All Contests


According To The General Administration Of Customs, China's Refined Oil Exports Reached 19.233 Million Tons From January To May
According To The General Administration Of Customs, China Imported 3.775 Million Tons Of Soybeans From January To May
China's Year-on-Year Import Growth In May, Denominated In U.S. Dollars, Was 27.4%, Compared With An Expectation Of 25% And A Previous Reading Of 25.30%
China's Year-on-Year Import Growth In May Was 21.5%, Compared To The Previous Reading Of 20.60%
China's Total Imports In May Amounted To RMB 1,863.8 Billion, Compared To The Previous Reading Of RMB 1,896.03 Billion
China's Total Exports In May Amounted To RMB 2,587.78 Billion, Compared To The Previous Figure Of RMB 2,481.72 Billion
China's Trade Surplus In May Was RMB 723.98 Billion, Compared To RMB 585.69 Billion In The Previous Month
China's Trade Surplus In May, Denominated In U.S. Dollars, Stood At USD 105.43 Billion, Compared With An Expected Surplus Of USD 92.1 Billion And A Prior Reading Of USD 84.82 Billion
The Main Polysilicon Futures Contract Fell 4.00% During The Day, Currently Trading At 34,115 Yuan/ton
The China Earthquake Networks Center Officially Reported That A Magnitude 3.6 Earthquake Struck Wensu County, Aksu Prefecture, Xinjiang, At 10:17 AM On June 9th, With A Focal Depth Of 12 Kilometers
The Main Coking Coal Futures Contract Fell 4.50% Intraday, Currently Trading At 1948.50 Yuan/ton
The Main Coking Coal Futures Contract Plunged 7.99% Intraday, Currently Trading At 1340.50 Yuan/ton, Hitting The Daily Limit Down
Fuel Oil Futures (2609 Contract) Fell More Than 2% Intraday, Last Quoted At 3797 Yuan/ton, A Slight Recovery From The Intraday Low Of 3765 Yuan/ton; Trading Volume Was Approximately 9.593 Billion Yuan, With A Decrease Of 13,500 Lots In Open Interest, Indicating A Decline In Open Positions
The Main Lithium Carbonate Futures Contract Rose 2.21% Intraday, Currently Trading At 166,400 Yuan/ton

U.S. Nonfarm Payrolls (SA) (May)A:--
F: --
U.S. Average Hourly Wage YoY (May)A:--
F: --
P: --
U.S. Average Hourly Wage MoM (SA) (May)A:--
F: --
P: --
U.S. U6 Unemployment Rate (SA) (May)A:--
F: --
P: --
U.S. Manufacturing Employment (SA) (May)A:--
F: --
U.S. Labor Force Participation Rate (SA) (May)A:--
F: --
P: --
U.S. Average Weekly Working Hours (SA) (May)A:--
F: --
P: --
U.S. Private Nonfarm Payrolls (SA) (May)A:--
F: --
Canada Ivey PMI (SA) (May)A:--
F: --
P: --
Canada Ivey PMI (Not SA) (May)A:--
F: --
P: --
U.S. Weekly Total Oil Rig CountA:--
F: --
P: --
U.S. Weekly Total Rig CountA:--
F: --
P: --
BOE Gov Bailey Speaks
U.S. Consumer Credit (SA) (Apr)A:--
F: --
Richmond Federal Reserve President Barkin delivered a speech.
China, Mainland Foreign Exchange Reserves (May)A:--
F: --
P: --
Japan Trade Balance (Apr)A:--
F: --
P: --
Japan Nominal GDP Revised QoQ (Q1)A:--
F: --
P: --
Euro Zone Sentix Investor Confidence Index (Jun)A:--
F: --
P: --
India Trade Balance (Q1)A:--
F: --
P: --
Canada National Economic Confidence IndexA:--
F: --
P: --
U.S. Conference Board Employment Trends Index (SA) (May)A:--
F: --
China, Mainland Imports (CNH) (May)A:--
F: --
P: --
China, Mainland Exports (May)A:--
F: --
P: --
China, Mainland Exports YoY (USD) (May)A:--
F: --
P: --
China, Mainland Imports YoY (CNH) (May)A:--
F: --
P: --
China, Mainland Imports YoY (USD) (May)A:--
F: --
P: --
U.K. BRC Overall Retail Sales YoY (May)A:--
F: --
P: --
U.K. BRC Like-For-Like Retail Sales YoY (May)A:--
F: --
P: --
China, Mainland Trade Balance (USD) (May)A:--
F: --
P: --
China, Mainland Trade Balance (CNH) (May)A:--
F: --
P: --
Germany Industrial Output MoM (SA) (Apr)--
F: --
P: --
Germany Exports MoM (SA) (Apr)--
F: --
P: --
South Africa GDP YoY (Q1)--
F: --
P: --
U.S. NFIB Small Business Optimism Index (SA) (May)--
F: --
P: --
Mexico CPI YoY (May)--
F: --
P: --
U.S. Trade Balance (Apr)--
F: --
P: --
Canada Trade Balance (SA) (Apr)--
F: --
P: --
Canada Imports (SA) (Apr)--
F: --
P: --
Canada Exports (SA) (Apr)--
F: --
P: --
U.S. Exports (Apr)--
F: --
P: --
U.S. Weekly Redbook Index YoY--
F: --
P: --
U.S. Existing Home Sales Annualized Total (May)--
F: --
P: --
U.S. Existing Home Sales Annualized MoM (May)--
F: --
P: --
U.S. Wholesale Sales MoM (SA) (Apr)--
F: --
P: --
China, Mainland M1 Money Supply YoY (May)--
F: --
P: --
China, Mainland M2 Money Supply YoY (May)--
F: --
P: --
China, Mainland M0 Money Supply YoY (May)--
F: --
P: --
U.S. EIA Natural Gas Production Forecast For The Next Year (Jun)--
F: --
P: --
U.S. EIA Short-Term Crude Production Forecast For The Year (Jun)--
F: --
P: --
U.S. EIA Short-Term Crude Production Forecast For The Next Year (Jun)--
F: --
P: --
EIA Monthly Short-Term Energy Outlook
U.S. 3-Year Note Auction Yield--
F: --
P: --
U.S. API Weekly Crude Oil Stocks--
F: --
P: --
U.S. API Weekly Refined Oil Stocks--
F: --
P: --
U.S. API Weekly Gasoline Stocks--
F: --
P: --
U.S. API Weekly Cushing Crude Oil Stocks--
F: --
P: --
Japan Domestic Enterprise Commodity Price Index MoM (May)--
F: --
P: --
Japan Domestic Enterprise Commodity Price Index YoY (May)--
F: --
P: --
Japan PPI MoM (May)--
F: --
P: --
China, Mainland CPI YoY (May)--
F: --
P: --


No matching data
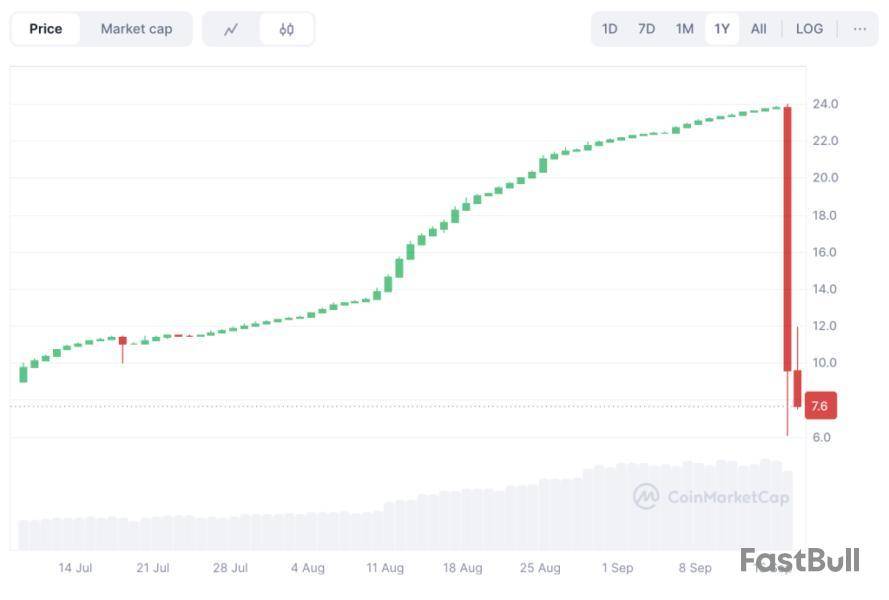
The crypto market never fails to surprise, and this time it was JuCoin’s turn in the spotlight. The platform’s native token, JU, shocked traders when its price suddenly dropped from a high of $24 to $7 in just a few minutes.
That’s a stunning 70% crash that has shaken investor confidence and wiped billions from its market cap.
$1 Billion Sell-Off and Liquidations
JU token markets were shaken by a wave of heavy sell orders and liquidations that quickly dragged prices lower. In just one day, more than $1.39 billion worth of JU was traded, as holders rushed for the exits in reaction to mounting regulatory scrutiny.
The panic didn’t stop there. JU’s 24-hour trading volume dropped by 23.9% to $1.03 billion, showing how quickly demand dried up once fear took over.
At the same time, the token’s turnover ratio jumped to 7.24, a clear signal of sharp volatility in an already fragile, low-liquidity environment.
Analysts note that the spike in JU’s unusual trading activity looks abnormal compared to Bitcoin or Ethereum. Such unstable swings hint at possible manipulation and raise doubts about JU’s long-term stability.
JuCoin’s quick response
Not long after the incident, JuCoin stepped in with a public statement. The team insisted that all operations are running as usual and, most importantly, that users’ funds are safe.
They explained that business functions remain unaffected, trying to calm fears of a deeper problem. Although the exchange didn’t provide clear details about what triggered the collapse.
Ju Token Technical Analysis
After dropping to $7, attention now turns to whether it can stay above the yearly low of $6.03. Some traders see room for a small rebound after the steep fall, but the overall market mood is still weak.
The RSI shows oversold levels, which often signal panic selling. At the same time, the MACD histogram has turned negative (-0.17), confirming a loss of momentum and a stronger bearish trend.
For now, a close above $9.87 could spark a short-lived bounce, often called a “dead-cat bounce.” But analysts warn that a real recovery can only happen if JU climbs back to $15 and holds that level.
The risk of loss in trading financial instruments such as stocks, FX, commodities, futures, bonds, ETFs and crypto can be substantial. You may sustain a total loss of the funds that you deposit with your broker. Therefore, you should carefully consider whether such trading is suitable for you in light of your circumstances and financial resources.
No decision to invest should be made without thoroughly conducting due diligence by yourself or consulting with your financial advisors. Our web content might not suit you since we don't know your financial conditions and investment needs. Our financial information might have latency or contain inaccuracy, so you should be fully responsible for any of your trading and investment decisions. The company will not be responsible for your capital loss.
Without getting permission from the website, you are not allowed to copy the website's graphics, texts, or trademarks. Intellectual property rights in the content or data incorporated into this website belong to its providers and exchange merchants.
Not Logged In
Log in to access more features
Log In
Sign Up