Markets
News
Analysis
User
24/7
Economic Calendar
Education
Data
- Names
- Latest
- Prev


The UN nuclear watchdog urgently met on Ukraine's imperiled nuclear safety, citing grave threats from Russian power grid attacks.
The UN's nuclear watchdog held an emergency meeting on Friday to address growing fears over the safety of Ukraine's nuclear facilities, as Russian attacks continue to cripple the country's power grid.
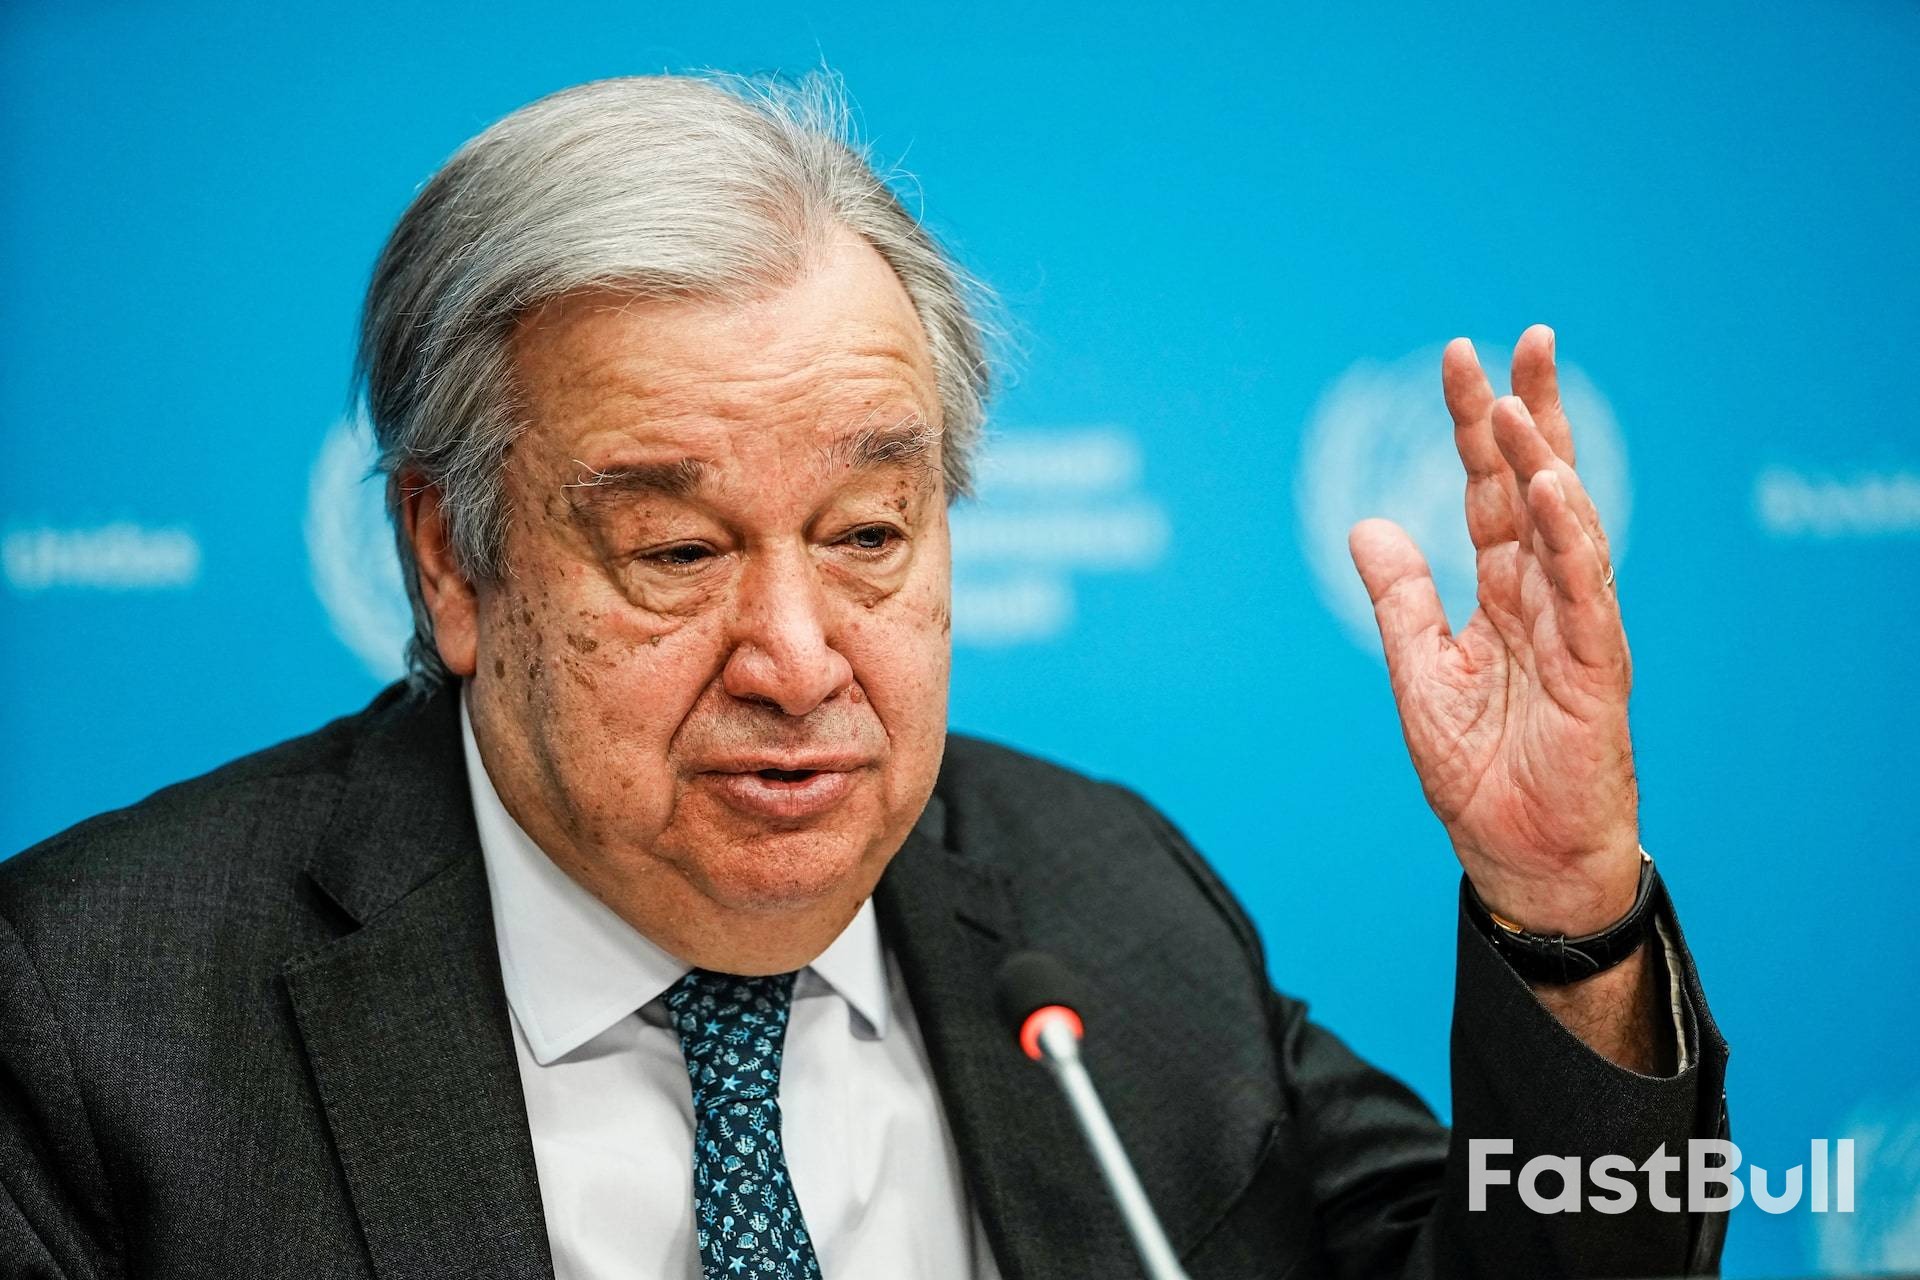
Rafael Grossi, Director General of the International Atomic Energy Agency (IAEA), opened the board meeting by stating that the war in Ukraine "continues to pose the world's biggest threat to nuclear safety." The primary concern is that a loss of electricity supply to nuclear plants could lead to a catastrophic disaster.
The four-hour extraordinary session in Vienna was prompted by a letter from 13 countries, led by the Netherlands, expressing "growing concern about the severity and urgency of nuclear safety risks."
Ahead of the meeting, Ukrainian ambassador Yurii Vitrenko emphasized that it was "high time" for the IAEA board to confront the situation. In response, an IAEA expert mission is currently assessing 10 Ukrainian substations and power plants considered "crucial to nuclear safety," with its work expected to conclude next month.
Since its 2022 invasion, Russia has systematically targeted Ukraine's energy infrastructure. These attacks have repeatedly jeopardized the external power needed by nuclear plants to run essential cooling and security systems, even when their reactors are shut down.
The Zaporizhzhia plant, Europe's largest nuclear facility, has been under Russian occupation since March 2022 and has been a constant source of international alarm. Its six reactors are currently shut down, but the site still requires a stable electricity connection to prevent overheating.
Earlier this month, Russia and Ukraine agreed to a localized ceasefire to permit repairs on the last remaining backup power line to the Zaporizhzhia plant, which had been disconnected by military activity in early January. Last week, the Chernobyl nuclear power plant also temporarily lost all of its off-site power, further highlighting the system's vulnerability.
The diplomatic tensions were evident at the meeting. While Ukraine urged for more decisive action, Russian Ambassador Mikhail Ulyanov dismissed the gathering as "absolutely politically motivated," claiming there was "no real need to hold such a meeting."
Both Moscow and Kyiv have consistently accused each other of risking a nuclear catastrophe by launching attacks near the Zaporizhzhia site.
728 RM B 7/F GEE LOK IND BLDG NO 34 HUNG TO RD KWUN TONG KLN HONG KONG


The risk of loss in trading financial instruments such as stocks, FX, commodities, futures, bonds, ETFs and crypto can be substantial. You may sustain a total loss of the funds that you deposit with your broker. Therefore, you should carefully consider whether such trading is suitable for you in light of your circumstances and financial resources.
No decision to invest should be made without thoroughly conducting due diligence by yourself or consulting with your financial advisors. Our web content might not suit you since we don't know your financial conditions and investment needs. Our financial information might have latency or contain inaccuracy, so you should be fully responsible for any of your trading and investment decisions. The company will not be responsible for your capital loss.
Without getting permission from the website, you are not allowed to copy the website's graphics, texts, or trademarks. Intellectual property rights in the content or data incorporated into this website belong to its providers and exchange merchants.
Not Logged In
Log in to access more features


Log In
Sign Up


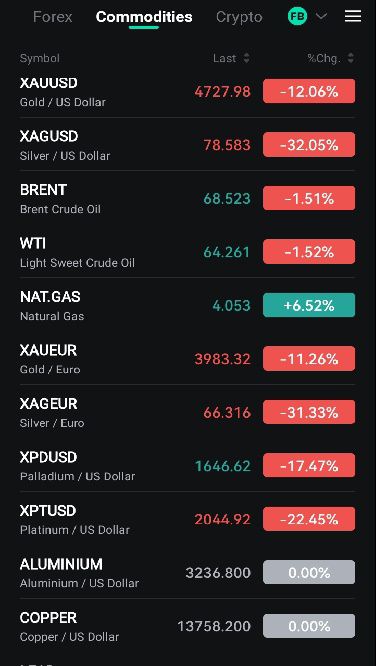
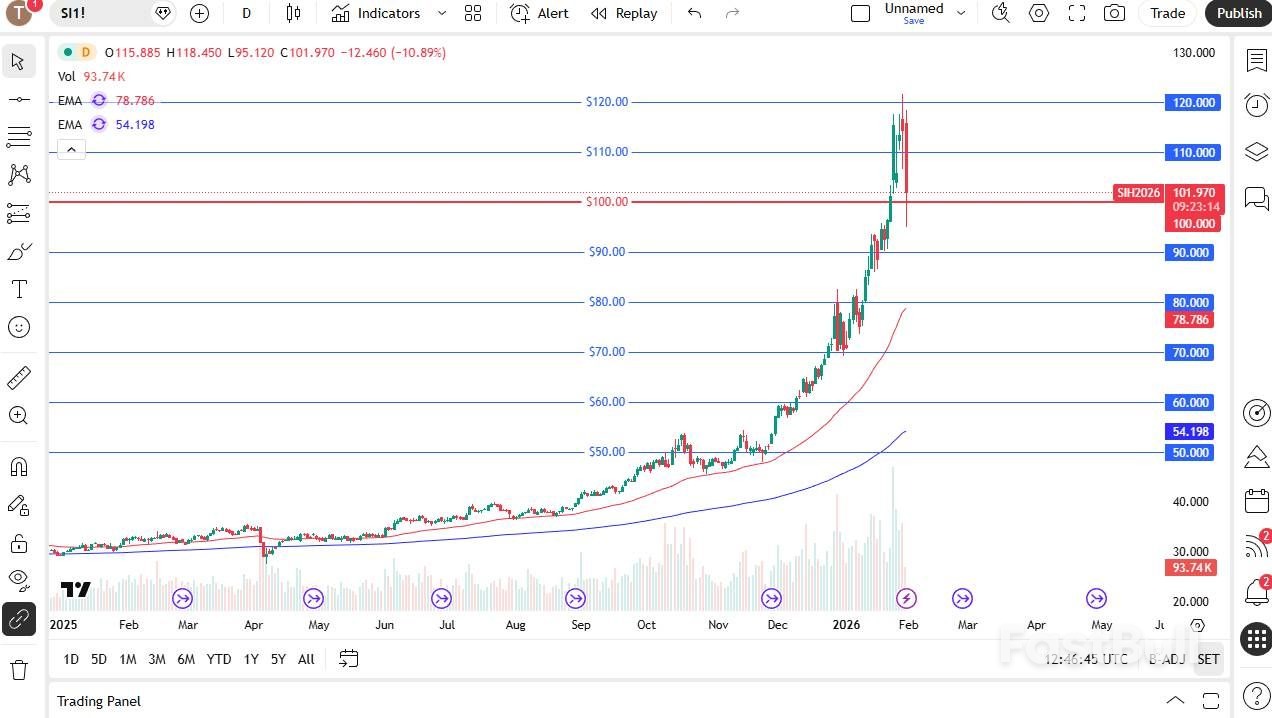 Silver daily chart.
 Silver - daily
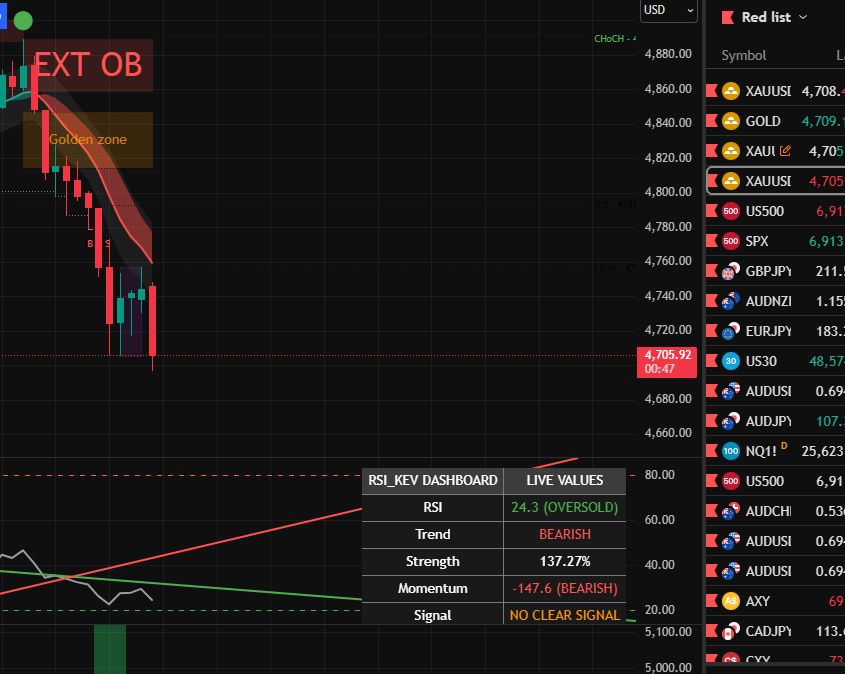
 Silver - 4 hour
 Silver - 1 hour