• Trade
  • Markets
  • Copy
  • Contests
  • News
  • 24/7
  • Calendar
  • Q&A
  • Chats
Screeners
SYMBOL
LAST
ASK
BID
HIGH
LOW
NET CHG.
%CHG.
SPREAD
SPX
S&P 500 Index
6930.54
6930.54
6930.54
6993.09
6926.87
-45.90
-0.66%
--
DJI
Dow Jones Industrial Average
49293.39
49293.39
49293.39
49653.13
49290.34
-114.26
-0.23%
--
IXIC
NASDAQ Composite Index
23296.58
23296.58
23296.58
23691.60
23268.30
-295.52
-1.25%
--
USDX
US Dollar Index
97.230
97.310
97.230
97.510
97.170
-0.180
-0.18%
--
EURUSD
Euro / US Dollar
1.18125
1.18132
1.18125
1.18241
1.17798
+0.00227
+ 0.19%
--
GBPUSD
Pound Sterling / US Dollar
1.36969
1.36978
1.36969
1.37064
1.36501
+0.00300
+ 0.22%
--
XAUUSD
Gold / US Dollar
4982.67
4983.08
4982.67
4993.67
4665.80
+324.07
+ 6.96%
--
WTI
Light Sweet Crude Oil
62.614
62.644
62.614
62.836
60.864
+0.532
+ 0.86%
--

Community Accounts

Signal Accounts
--
Profit Accounts
--
Loss Accounts
--
View More

Become a signal provider

Sell trading signals to earn additional income

View More

Guide to Copy Trading

Get started with ease and confidence

View More

Signal Accounts for Members

All Signal Accounts

Best Return
  • Best Return
  • Best P/L
  • Best MDD
Past 1W
  • Past 1W
  • Past 1M
  • Past 1Y

All Contests

  • All
  • Trump Updates
  • Recommend
  • Stocks
  • Cryptocurrencies
  • Central Banks
  • Featured News
Top News Only
Share

Russian President Putin: Russia's GDP Up 1% In 2025

Share

MSCI's Nordic Countries Index Rose 0.3%, Marking Its Third Consecutive Day Of Gains, Closing At 394.43 Points. Among The Ten Sectors, The Nordic Industrials Sector Saw The Largest Increase. Boliden Ab Closed Up 5.3%, Leading The Pack Among Nordic Stocks

Share

Europe's STOXX Index Down 0.17%, Euro Zone Blue Chips Index Down 0.29%

Share

France's CAC 40 Down 0.02%, Spain's IBEX Up 0.02%

Share

[Italian Banking Sector Hits Record Closing High] Germany's DAX 30 Index Closed Down 0.02% At 24,793.06 Points. France's Stock Index Closed Down 0.13%, Italy's Stock Index Closed Up 0.80% With The Banking Index Up 1.24%, And The UK Stock Index Closed Down 0.39%

Share

Executive: Marathon Purchased Two Cargoes Of Venezuelan Crude At The End Of January

Share

New York Gold Futures Broke Through $5,000 Per Ounce, Rising 7.47% On The Day

Share

[Bitcoin Falls Below $77,000, 24-Hour Decline Of 2.8%] February 4Th, According To Htx Market Data, Bitcoin Fell Below $77,000, Now Trading At $76,900, A 24-Hour Decrease Of 2.8%

Share

Sudanese Army Says It Has Broken Siege Of Famine-Stricken Kadugli

Share

Billionaire Investor Ken Griffin Says US Dollar Lost Some Of Its Luster In The Last 12 Months

Share

Spot Gold Surged $302.83 During The Day, Currently Trading At $4,963.79 Per Ounce, A Gain Of 6.50%

Share

ICE Raw Sugar Futures Rise 3% To 14.69 Cents Per Lb

Share

Slovenia's Lawmakers Approve Central Bank Deputy Dolenc As New Governor, Media Report

Share

Denmark's Forex Reserves 673.9 Billion DKK At End-January Versus 651.1 Billion At End-December

Share

Fitch: Forecasts UK's Inflation Outlook To Be More Benign This Year And For Bank Of England To Respond With Three Rate Cuts In 2026

Share

London Robusta Coffee Futures Fall 5% To $3827 Per Metric Ton

Share

EU 2025/26 Palm Oil Imports At 1.75 Million T By Feb 1 Versus Year-Earlier 1.81 Million T

Share

EU 2025/26 Soymeal Imports At 10.40 Million T By Feb 1 Versus Year-Earlier 11.48 Million T

Share

EU 2025/26 Rapeseed Imports At 2.38 Million T By Feb 1 Versus Year-Earlier 3.91 Million T

Share

EU 2025/26 Soybean Imports At 7.29 Million T By Feb 1 Versus Year-Earlier 8.42 Million T

TIME
ACT
FCST
PREV
U.K. Manufacturing PMI Final (Jan)

A:--

F: --

P: --

Turkey Trade Balance (Jan)

A:--

F: --

P: --

Brazil IHS Markit Manufacturing PMI (Jan)

A:--

F: --

P: --

Canada National Economic Confidence Index

A:--

F: --

P: --

Canada Manufacturing PMI (SA) (Jan)

A:--

F: --

P: --

U.S. IHS Markit Manufacturing PMI Final (Jan)

A:--

F: --

P: --

U.S. ISM Output Index (Jan)

A:--

F: --

P: --

U.S. ISM Inventories Index (Jan)

A:--

F: --

P: --

U.S. ISM Manufacturing Employment Index (Jan)

A:--

F: --

P: --

U.S. ISM Manufacturing New Orders Index (Jan)

A:--

F: --

P: --

U.S. ISM Manufacturing PMI (Jan)

A:--

F: --

P: --

US President Trump delivered a speech
South Korea CPI YoY (Jan)

A:--

F: --

P: --

Japan Monetary Base YoY (SA) (Jan)

A:--

F: --

P: --

Australia Building Approval Total YoY (Dec)

A:--

F: --

P: --
Australia Building Permits MoM (SA) (Dec)

A:--

F: --

P: --
Australia Building Permits YoY (SA) (Dec)

A:--

F: --

P: --

Australia Private Building Permits MoM (SA) (Dec)

A:--

F: --

P: --
Australia Overnight (Borrowing) Key Rate

A:--

F: --

P: --

RBA Rate Statement
Japan 10-Year Note Auction Yield

A:--

F: --

P: --

The U.S. House of Representatives voted on a short-term spending bill to end the partial government shutdown.
Saudi Arabia IHS Markit Composite PMI (Jan)

A:--

F: --

P: --

RBA Press Conference
Turkey PPI YoY (Jan)

A:--

F: --

P: --

Turkey CPI YoY (Jan)

A:--

F: --

P: --

Turkey CPI YoY (Excl. Energy, Food, Beverage, Tobacco & Gold) (Jan)

A:--

F: --

P: --

U.K. 10-Year Note Auction Yield

A:--

F: --

P: --

Richmond Federal Reserve President Barkin delivered a speech.
U.S. Weekly Redbook Index YoY

A:--

F: --

P: --

Mexico Manufacturing PMI (Jan)

A:--

F: --

P: --

U.S. API Weekly Refined Oil Stocks

--

F: --

P: --

U.S. API Weekly Gasoline Stocks

--

F: --

P: --

U.S. API Weekly Cushing Crude Oil Stocks

--

F: --

P: --

U.S. API Weekly Crude Oil Stocks

--

F: --

P: --

Japan IHS Markit Services PMI (Jan)

--

F: --

P: --

Japan IHS Markit Composite PMI (Jan)

--

F: --

P: --

China, Mainland Caixin Services PMI (Jan)

--

F: --

P: --

China, Mainland Caixin Composite PMI (Jan)

--

F: --

P: --

India HSBC Services PMI Final (Jan)

--

F: --

P: --

India IHS Markit Composite PMI (Jan)

--

F: --

P: --

Russia IHS Markit Services PMI (Jan)

--

F: --

P: --

South Africa IHS Markit Composite PMI (SA) (Jan)

--

F: --

P: --

Italy Services PMI (SA) (Jan)

--

F: --

P: --

Italy Composite PMI (Jan)

--

F: --

P: --

Germany Composite PMI Final (SA) (Jan)

--

F: --

P: --

Euro Zone Composite PMI Final (Jan)

--

F: --

P: --

Euro Zone Services PMI Final (Jan)

--

F: --

P: --

U.K. Composite PMI Final (Jan)

--

F: --

P: --

U.K. Total Reserve Assets (Jan)

--

F: --

P: --

U.K. Services PMI Final (Jan)

--

F: --

P: --

U.K. Official Reserves Changes (Jan)

--

F: --

P: --

Euro Zone Core CPI Prelim YoY (Jan)

--

F: --

P: --

Euro Zone Core HICP Prelim YoY (Jan)

--

F: --

P: --

Euro Zone PPI MoM (Dec)

--

F: --

P: --

Euro Zone HICP Prelim YoY (Jan)

--

F: --

P: --

Euro Zone Core HICP Prelim MoM (Jan)

--

F: --

P: --

Italy HICP Prelim YoY (Jan)

--

F: --

P: --

Euro Zone Core CPI Prelim MoM (Jan)

--

F: --

P: --

Euro Zone PPI YoY (Dec)

--

F: --

P: --

U.S. MBA Mortgage Application Activity Index WoW

--

F: --

P: --

Q&A with Experts
    • All
    • Chatrooms
    • Groups
    • Friends
    Agues45 flag
    Let my money be eaten by greedy markets..
    srinivas flag
    EuroTrader
    @EuroTradernot yet.. patience
    EuroTrader flag
    delight
    @delightof it continues to the upside all we have to do is continue in the direction of the overall direction
    SlowBear ⛅ flag
    srinivas
    btc crashing 😎😎
    @srinivas crashing hard bro, real serious crash
    EuroTrader flag
    srinivas
    @srinivasYeahh .we gotta wait fir some structure shift lower before we engage those sells on Gold
    srinivas flag
    EuroTrader
    @EuroTraderexactly
    CRT flag
    Hi guys, which strategy is the best between the two: 1. A strategy with a high win rate and low risk to reward. 2. A strategy with a low win rate and high risk to reward
    srinivas flag
    SlowBear ⛅
    @SlowBear ⛅i told you
    SlowBear ⛅ flag
    srinivas
    expect violent moves
    @srinivas I really wants to be part of that move
    srinivas flag
    SlowBear ⛅
    @SlowBear ⛅wait then
    SlowBear ⛅ flag
    srinivas
    @srinivas I know what you said just chilling and watching
    SlowBear ⛅ flag
    srinivas
    @srinivas I sure would bro, share when you joined though to keep track
    3529128 flag
    Gold is falling, but there's no bottom at 4383 in a few days.
    EuroTrader flag
    CRT
    Hi guys, which strategy is the best between the two: 1. A strategy with a high win rate and low risk to reward. 2. A strategy with a low win rate and high risk to reward
    @CRTBoth are great it all depends on your psychology and which would be better for you
    srinivas flag
    btc is in a serious Ness
    srinivas flag
    mess
    margopal flag
    59528
    srinivas flag
    btc will wipe off one more trillion
    946789 flag
    please give me a gold signal bro
    Gz flag
    srinivas
    btc will wipe off one more trillion
    can considr long @ 64613.01-70015.86[@srinivas]
    Type here...
    Add Symbol or Code

      No matching data

      All
      Trump Updates
      Recommend
      Stocks
      Cryptocurrencies
      Central Banks
      Featured News
      • All
      • Russia-Ukraine Conflict
      • Middle East Flashpoint
      • All
      • Russia-Ukraine Conflict
      • Middle East Flashpoint
      Search
      Products

      Charts Free Forever

      Chats Q&A with Experts
      Screeners Economic Calendar Data Tools
      Membership Features
      Data Warehouse Market Trends Institutional Data Policy Rates Macro

      Market Trends

      Market Sentiment Order Book Forex Correlations

      Top Indicators

      Charts Free Forever
      Markets

      News

      News Analysis 24/7 Columns Education
      From Institutions From Analysts
      Topics Columnists

      Latest Views

      Latest Views

      Trending Topics

      Top Columnists

      Latest Update

      Signals

      Copy Rankings Latest Signals Become a signal provider AI Rating
      Contests
      Brokers

      Overview Brokers Assessment Rankings Regulators News Claims
      Broker listing Forex Brokers Comparison Tool Live Spread Comparison Scam
      Q&A Complaint Scam Alert Videos Tips to Detect Scam
      More

      Business
      Events
      Careers About Us Advertising Help Center

      White Label

      Broker API

      Data API

      Web Plug-ins

      Affiliate Program

      Awards Institution Evaluation IB Seminar Salon Event Exhibition
      Vietnam Thailand Singapore Dubai
      Fans Party Investment Sharing Session
      FastBull Summit BrokersView Expo
      Recent Searches
        Top Searches
          Markets
          News
          Analysis
          User
          24/7
          Economic Calendar
          Education
          Data
          • Names
          • Latest
          • Prev

          View All

          No data

          Scan to Download

          Faster Charts, Chat Faster!

          Download App
          English
          • English
          • Español
          • العربية
          • Bahasa Indonesia
          • Bahasa Melayu
          • Tiếng Việt
          • ภาษาไทย
          • Français
          • Italiano
          • Türkçe
          • Русский язык
          • 简中
          • 繁中
          Open Account
          Search
          Products
          Charts Free Forever
          Markets
          News
          Signals

          Copy Rankings Latest Signals Become a signal provider AI Rating
          Contests
          Brokers

          Overview Brokers Assessment Rankings Regulators News Claims
          Broker listing Forex Brokers Comparison Tool Live Spread Comparison Scam
          Q&A Complaint Scam Alert Videos Tips to Detect Scam
          More

          Business
          Events
          Careers About Us Advertising Help Center

          White Label

          Broker API

          Data API

          Web Plug-ins

          Affiliate Program

          Awards Institution Evaluation IB Seminar Salon Event Exhibition
          Vietnam Thailand Singapore Dubai
          Fans Party Investment Sharing Session
          FastBull Summit BrokersView Expo

          Natural Gas And Oil Forecast: Is Oil Stabilizing At $61 Or Slipping Toward $60 Next?

          Winkelmann

          Commodity

          Summary:

          Oil and gas prices slide as easing geopolitical risk and steady OPEC+ supply push WTI toward $60, while natural gas consolidates near $3.20 support.

          Key Points:

          · Oil prices slide as easing geopolitical risk and steady OPEC+ output push WTI back toward the $60 support zone.
          · WTI crude trades near $61.80 after a channel breakdown, with sellers eyeing $60.20 if $61 support fails.
          · Natural gas cools near $3.23, pulling back inside a rising channel as momentum slows without triggering a trend reversal.

          Market Overview

          Oil and natural gas prices are falling as geopolitical tensions ease, removing recent risk premiums and shifting focus back to strong supply. WTI crude is now around $61 to $62 per barrel, down from late January highs of $65 to $66, after dropping nearly 5% in one day earlier this week.

          A stronger US dollar is adding pressure, and OPEC+ has confirmed it will keep output steady, supporting the view that global supply will remain high. With demand growth expected to stay below 1 million barrels per day in 2026 and inventories likely to rise, prices are now testing important support near $60.

          Volatility is still high, but the market has clearly moved from risk-driven rallies to a more cautious, balanced approach.

          Natural Gas Forecast: $3.20 Holds as Price Pulls Back Within Rising Channel

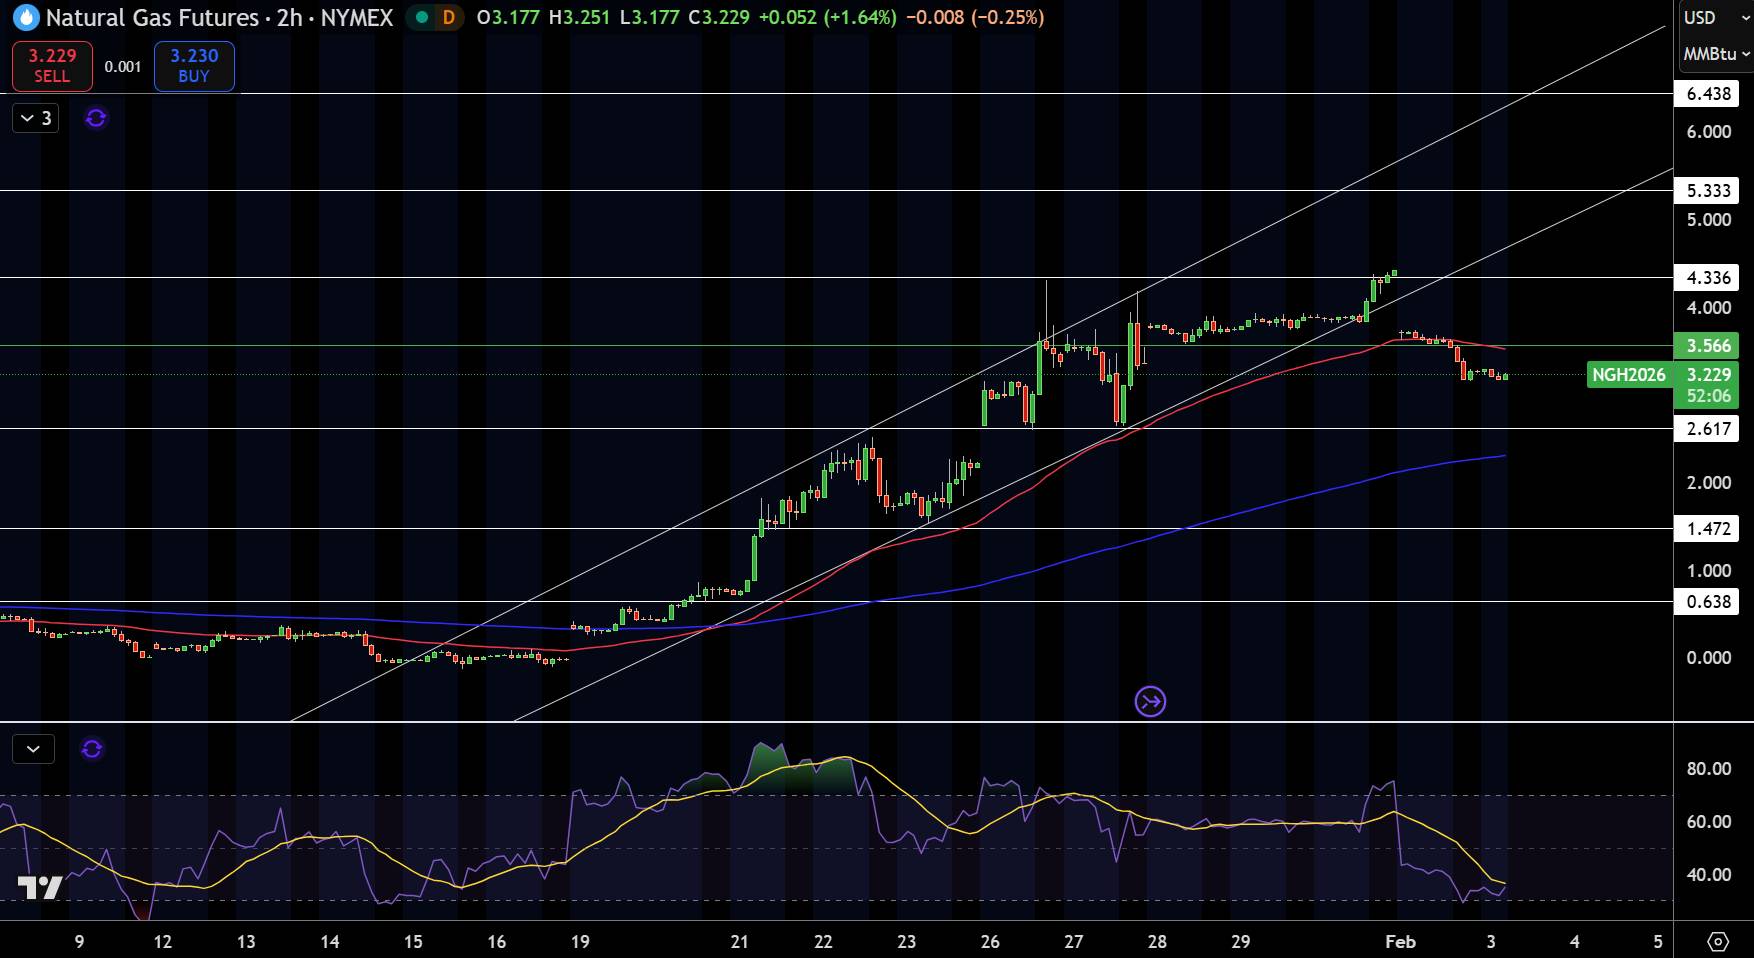
          Natural Gas (NG) Price Chart

          Natural gas is trading near $3.23, easing after failing to hold above the recent swing high near $3.55. On the 2-hour chart, price remains inside a rising channel, but recent candles show smaller bodies and lower highs, pointing to short-term consolidation. The pullback has brought price back toward the 50-EMA, which is flattening and acting as near-term support.

          The broader trend stays constructive as long as price holds above $3.10–$3.15, a zone aligned with prior resistance turned support. The 200-EMA near $2.60 continues to slope higher, reinforcing the medium-term uptrend. The RSI around 40–45 shows cooling momentum, not aggressive selling.

          Trade idea: Buy dips near $3.15, targeting $3.55, invalidated below $3.00.
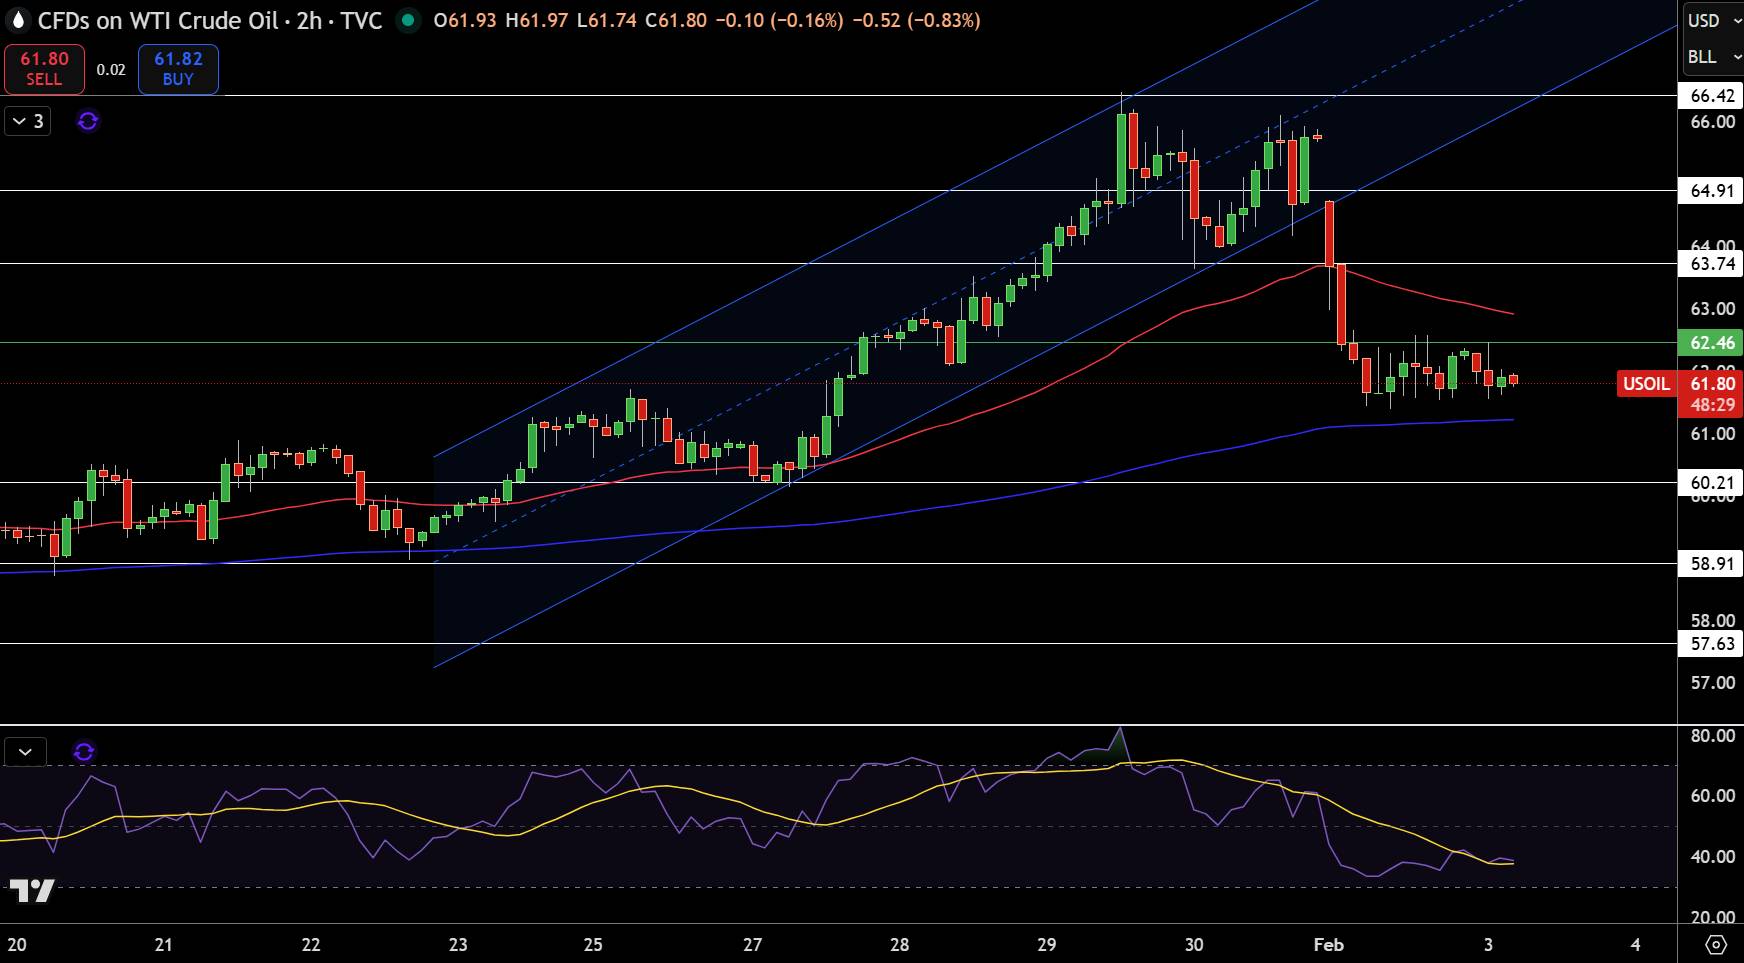
          WTI Crude Oil Forecast: $61.80 Holds After Channel Breakdown—What's Next?

          WTI Price Chart

          WTI crude oil is trading near $61.80, consolidating after a sharp rejection from the upper boundary of a rising channel. On the 2-hour chart, a strong bearish engulfing candle marked the breakdown below the channel midline, signaling a shift from momentum buying to profit-taking. Price is now below the 50-EMA, while the 200-EMA near $61.00 is acting as near-term support.

          Former resistance around $63.70–$64.00 has turned into a supply zone. The RSI near 40 shows weak momentum, suggesting sellers still control the pace but without panic selling. A clean break below $61.00 could open room toward $60.20, while recovery needs a move back above $62.50.

          Trade idea: Sell rallies near $62.50, targeting $60.20, invalidated above $63.80.

          Brent Crude Forecast: $66 Holds as Bulls Lose Control Below Rising Channel
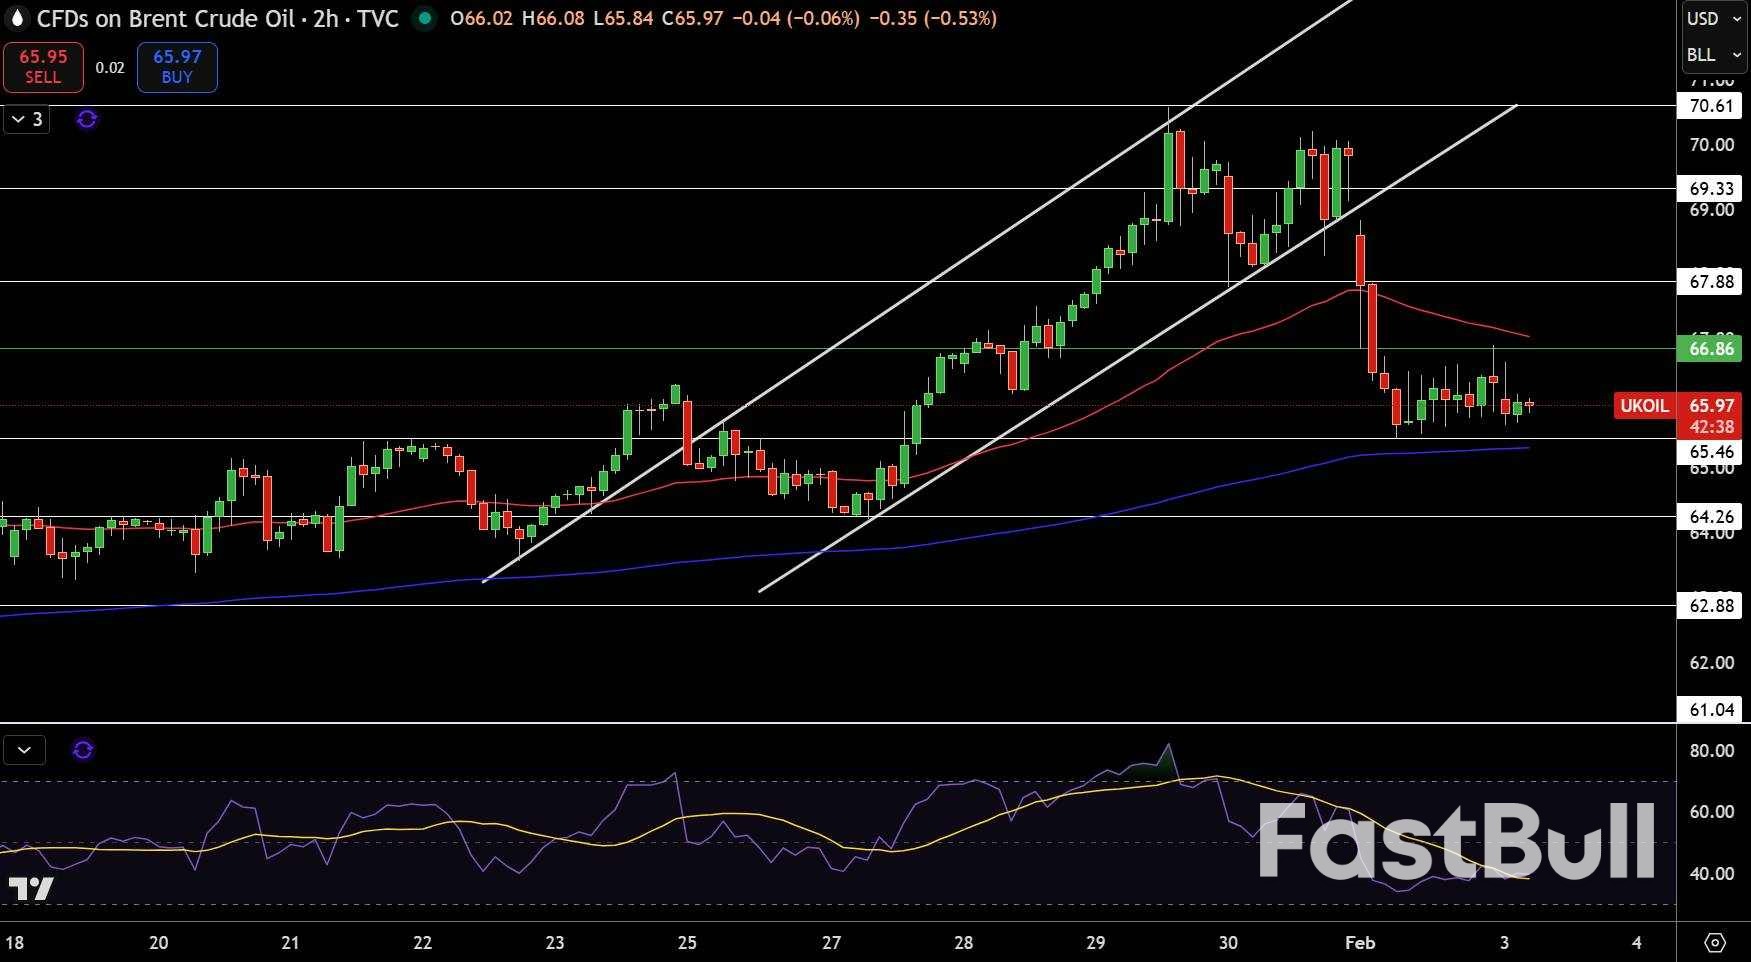
          Brent Price Chart

          Brent crude is trading near $66.00, moving sideways after a sharp rejection from the top of a rising channel. On the 2-hour chart, a strong bearish candle broke price below the channel support and the 50-EMA, signaling a loss of upside momentum. Since then, candles have been smaller, showing consolidation rather than a quick rebound.

          The area around $66.80–$67.00 now acts as resistance, while the 200-EMA near $65.50 is providing short-term support. A break below $65.40 could open the door toward $64.25, a prior demand zone. The RSI near 40 reflects weak momentum, suggesting sellers remain in control without extreme pressure.

          Trade idea: Sell rebounds near $66.80, targeting $64.30, invalidated above $67.90.

          Source: FX Empire

          Risk Warnings and Disclaimers
          You understand and acknowledge that there is a high degree of risk involved in trading. Following any strategies or investment methods may lead to potential losses. The content on the site is provided by our contributors and analysts for information purposes only. You are solely responsible for determining whether any trading assets, securities, strategy, or any other product is suitable for investing based on your own investment objectives and financial situation.
          Add to Favorites
          Share

          Deutsche Bank Downgrades Merck KGaA To "hold" After Estimate Cuts, Limited Upside

          Samantha Luan

          Stocks

          Deutsche Bank downgraded Merck KGaA (ETR:MRCG) to "hold" from "buy" and raised its price target to €132 from €127, citing reduced earnings expectations and limited upside after a recent share price recovery, sending shares down over 3%.

          In a note ahead of the company's upcoming fourth-quarter results and 2026 guidance, analyst Falko Friedrichs said Deutsche Bank cut its adjusted earnings per share estimate for 2026 by about 5%.

          The reduction reflects higher foreign exchange headwinds and slightly higher interest costs than previously assumed, according to the report.

          Deutsche Bank said it expects the fourth-quarter results to be largely a non-event, with investor attention likely centered on the 2026 guidance.

          The brokerage said the guidance is likely to indicate another operational transition year. Friedrichs noted that the revised adjusted EPS forecast is 7% below Bloomberg consensus for 2026 and as much as 10% below consensus for the outer years.

          The downgrade was driven by the gap between Deutsche Bank's estimates and consensus forecasts, as well as valuation considerations.

          Friedrichs said the revised €132 target price no longer offers significant upside following a roughly 15% recovery in the share price in recent weeks. Deutsche Bank said it is waiting for a better entry point and for consensus estimates to be reset.

          Source: Investing

          Risk Warnings and Disclaimers
          You understand and acknowledge that there is a high degree of risk involved in trading. Following any strategies or investment methods may lead to potential losses. The content on the site is provided by our contributors and analysts for information purposes only. You are solely responsible for determining whether any trading assets, securities, strategy, or any other product is suitable for investing based on your own investment objectives and financial situation.
          Add to Favorites
          Share

          Russia Braces for End of New START Nuclear Treaty

          James Riley

          Russia-Ukraine Conflict

          Remarks of Officials

          Political

          Russia has signaled it is prepared for a "new reality" where no nuclear arms control treaty exists with the United States, as the landmark New START agreement is set to expire this week.

          Without a last-minute deal, the expiration on Thursday will remove all constraints on the long-range strategic nuclear arsenals of both nations for the first time in over half a century.

          "This is a new moment, a new reality—we are ready for it," Russian Deputy Foreign Minister Sergei Ryabkov, Moscow's lead arms control negotiator, told Russian news agencies. He made the comments during a visit to Beijing for "strategic stability consultations."

          The New START treaty, signed in 2010, limits each country to a maximum of 1,550 deployed strategic warheads.

          US Silence Signals Treaty's Demise

          Last month, U.S. President Donald Trump suggested he would let the treaty lapse. His administration has not formally replied to a Russian offer to maintain the pact's missile and warhead limits for another year, which would have provided time to negotiate a successor agreement.

          "The lack of an answer is also an answer," Ryabkov was quoted as saying by the TASS news agency.

          Arms control advocates in both Moscow and Washington warn that the treaty's end will do more than just remove warhead limits. It is also expected to erode confidence, undermine trust, and eliminate the ability to verify the nuclear intentions of the other side. Many experts now fear the possibility of an unrestrained nuclear arms race.

          The Broader Collapse of Arms Control

          The network of agreements designed to prevent nuclear war, painstakingly built since the 1962 Cuban Missile Crisis, has been steadily deteriorating. This trend is accelerating amid growing confrontation between Russia and the West over Ukraine and U.S. concerns about China's growing arsenal.

          The United States has proposed that China, the world's third-largest nuclear power, should be included in future arms control negotiations. However, Beijing has shown no interest in participating. Ryabkov stated that China has a clear position on the matter and that Moscow respects it.

          Warnings of a New Arms Race

          Former U.S. President Barack Obama, who signed the New START treaty with then-Russian President Dmitry Medvedev in 2010, called on the U.S. Congress to take action.

          "If Congress doesn't act, the last nuclear arms control treaty between the U.S. and Russia will expire," he said on X. "It would pointlessly wipe out decades of diplomacy, and could spark another arms race that makes the world less safe."

          Medvedev echoed these concerns, stating that the world should be alarmed if the treaty expires without a clear path forward, suggesting it would advance the "Doomsday Clock."

          In a sign of escalating military calculations, Ryabkov also noted that if the U.S. were to place missile defense systems on Greenland, an autonomous territory of Denmark, Russia would be forced to take compensatory military measures.

          Risk Warnings and Disclaimers
          You understand and acknowledge that there is a high degree of risk involved in trading. Following any strategies or investment methods may lead to potential losses. The content on the site is provided by our contributors and analysts for information purposes only. You are solely responsible for determining whether any trading assets, securities, strategy, or any other product is suitable for investing based on your own investment objectives and financial situation.
          Add to Favorites
          Share

          Poland's Central Bank at a Crossroads: Rate Cut or Hold?

          Michael Ross

          Economic

          Central Bank

          Data Interpretation

          Traders are learning to ignore the official commentary from the National Bank of Poland (NBP). After a history of inconsistent messaging, the market is focused on economic data to predict the central bank's next move, not its governor's statements.

          At the January press conference, Governor Adam Glapiński confirmed this reality, stating that monetary policy decisions are made month-by-month and are strictly dependent on incoming data. This has left economists divided ahead of the February meeting, as recent figures present a conflicting picture.

          The Case for Holding Rates Steady

          Recent macroeconomic data provides a strong argument for the NBP to maintain its wait-and-see approach. Several key indicators have surprised to the upside:

          • Stronger Economic Activity: Both manufacturing and construction figures for December were much stronger than expected, suggesting economic growth is becoming more broad-based.

          • Impressive GDP Growth: The full-year 2025 GDP growth was estimated at 3.6%, which implies an economic expansion of around 4% year-on-year in the fourth quarter.

          • Robust Wage Dynamics: December wage growth also beat expectations. While driven partly by annual bonuses in sectors like mining, the reading broke a downward trend seen in previous months.

          These figures make it difficult to justify a rate cut and suggest the Polish economy is carrying significant momentum.

          The Argument for an Imminent Rate Cut

          Despite the strong activity data, the primary argument for resuming rate cuts is the inflation outlook. According to internal estimates, year-on-year inflation in January likely fell below 2%.

          It is possible that the NBP's own staff forecasts, presented to the Monetary Policy Committee (MPC), show a similar trend. This could create a compelling case for a rate cut in February, even before the official January CPI data is released or the central bank publishes its updated March inflation projection.

          Our Outlook: A February Pause, Followed by Cuts

          Our baseline scenario is that the NBP will keep interest rates unchanged this week. The strong economic data released recently makes a rate cut difficult to defend. Furthermore, the absence of an official January CPI reading gives policymakers a clear reason to wait for more information to confirm that disinflation is continuing alongside the economic recovery.

          The MPC will likely seek more clarity on whether wage and core inflation pressures will continue to ease throughout 2026 before acting.

          However, we still expect the next cut to occur in March, with further easing to follow in the subsequent months. We see the terminal NBP rate reaching 3.25% this year, and potentially even lower if the inflation outlook improves beyond our current forecasts. We project that CPI will hover near the lower bound of the NBP's target range of 2.5% (+/-1%) in 2026, and a series of low inflation reports should be enough to trigger further rate cuts from the central bank.

          To stay updated on all economic events of today, please check out our Economic calendar
          Risk Warnings and Disclaimers
          You understand and acknowledge that there is a high degree of risk involved in trading. Following any strategies or investment methods may lead to potential losses. The content on the site is provided by our contributors and analysts for information purposes only. You are solely responsible for determining whether any trading assets, securities, strategy, or any other product is suitable for investing based on your own investment objectives and financial situation.
          Add to Favorites
          Share

          Turkey to Host High-Stakes US-Iran Talks

          James Riley

          Middle East Situation

          Remarks of Officials

          Political

          Turkey is set to host high-level talks between the United States and Iran on Friday, a diplomatic effort aimed at de-escalating rising tensions between the two nations.

          The summit in Istanbul will reportedly be attended by senior officials from both sides. Sources familiar with the plans said the US delegation includes envoy Steve Witkoff and President Donald Trump's son-in-law, Jared Kushner. Iran is expected to be represented by Foreign Minister Abbas Araghchi.

          According to the sources, who requested anonymity due to the sensitivity of the discussions, Turkish Foreign Minister Hakan Fidan anticipates that other regional powers may also participate.

          A Critical Meeting Amid Heightened Tensions

          This meeting would mark the first public engagement between American and Iranian officials since a recent spike in hostilities. The talks come as President Trump has threatened Tehran with military action if a new agreement to curb its nuclear program is not reached.

          The geopolitical climate is tense, with the US having already dispatched naval assets to the region. This move has raised concerns about a potential conflict, echoing previous US-Israeli attacks on Iran's nuclear facilities last year.

          President Trump’s recent threats followed a deadly crackdown by Iranian authorities on mass protests last month. In response, Iran's Supreme Leader Ali Khamenei issued a stark warning on Sunday, stating that any attack on his country could trigger a "regional war."

          Diplomatic Preliminaries

          Ahead of the Istanbul summit, US envoy Steve Witkoff is scheduled to travel to Israel on Tuesday. An official with knowledge of the trip confirmed that Witkoff will meet with Prime Minister Benjamin Netanyahu and his senior security team.

          The possibility of a US-Iran meeting was also reported earlier by The New York Times, which noted that discussions would take place in Istanbul with the participation of some Middle Eastern countries.

          Risk Warnings and Disclaimers
          You understand and acknowledge that there is a high degree of risk involved in trading. Following any strategies or investment methods may lead to potential losses. The content on the site is provided by our contributors and analysts for information purposes only. You are solely responsible for determining whether any trading assets, securities, strategy, or any other product is suitable for investing based on your own investment objectives and financial situation.
          Add to Favorites
          Share

          S&P 500 Futures See Moderate Pickup While Nasdaq, Russell Remain Neutral

          Samantha Luan

          Stocks

          S&P 500 futures experienced a moderate pickup in new long risk flows last week, while Nasdaq 100 and Russell 2000 positioning levels remained close to neutral, according to Citigroup strategists.

          The team, including David Chew, noted in a report that the positioning gap between these indexes suggests investors have not yet fully rotated into a broad risk-on stance.

          While S&P 500 futures activity dominated trading, Nasdaq and Russell 2000 positioning showed stabilization but fell short of indicating a wider risk-on consensus.

          In European markets, positioning in bank futures has become extended and crowded. The strategists warned that new long additions in this sector increase the likelihood of near-term profit-taking. FTSE and DAX futures positioning has been losing momentum as investors reduce long positions.

          Asian equity flows presented a mixed picture last week. South Korea's Kospi was identified as particularly vulnerable due to stretched positioning and ongoing profit-taking.

          Source: Investing

          Risk Warnings and Disclaimers
          You understand and acknowledge that there is a high degree of risk involved in trading. Following any strategies or investment methods may lead to potential losses. The content on the site is provided by our contributors and analysts for information purposes only. You are solely responsible for determining whether any trading assets, securities, strategy, or any other product is suitable for investing based on your own investment objectives and financial situation.
          Add to Favorites
          Share

          Risk-On Asia And Hawkish RBA Propel Aussie Higher

          Justin

          Forex

          Economic

          Australian Dollar surged broadly in Asia session, drawing fresh strength from a hawkish RBA rate hike that reinforced expectations of further tightening later this year. The move gave the Aussie an extra tailwind on top of an already constructive regional backdrop.

          Risk appetite in Asia has been firm, with the latest boost to sentiment coming from a surprise breakthrough on trade. The US and India reached an agreement to immediately lower tariffs on each other's goods. Under the deal, US tariffs on Indian goods will be cut sharply to 18% from 50%, bringing India broadly in line with Asian peers at 15–19%. In return, India agreed to halt purchases of Russian oil and reduce a range of trade barriers, according to US President Donald Trump.

          Indian Prime Minister Narendra Modi also committed to significantly increase purchases of US products. Modi later confirmed the tariff reduction in a post on X, hailing the agreement as a major win for Indian exports. The announcement followed closely on the heels of India's landmark free trade agreement with the European Union, which Modi described as the "mother of all deals."

          While the trade news supported risk currencies, Yen remained under pressure amid mixed messaging from Tokyo. Japan's Finance Minister Satsuki Katayama today defended Prime Minister Sanae Takaichi's recent remarks on the benefits of a weaker yen, saying they reflected standard economic theory. Katayama stressed that Takaichi was speaking in general terms, noting that while a weak Yen has downsides, it can also support corporate revenues, domestic investment, and exports. The comments added to confusion over how tolerant authorities are of further yen depreciation.

          Overall this week so far, the Aussie sits firmly at the top of the FX performance table, followed by Kiwi and Dollar. Swiss Franc trails at the bottom, with Yen and Euro also lagging. Sterling and Loonie are trading in the middle of the pack.

          In Asia, at the time of writing, Nikkei is up 3.85%. Hong Kong HSI is down -0.06%. China Shanghai SSE is up 0.44%. Singapore Strait Times is up 0.92%. Japan 10-year JGB yield is up 0.018 at 2.255. Overnight, DOW rose 1.05%. S&P 500 rose 0.54%. NASDAQ rose 0.56%. 10-year yield rose 0.034 to 4.275.

          RBA delivers expected hike, forecast path points to another move

          The RBA raised the cash rate by 25bps to 3.85% as widely expected, with the decision taken unanimously. While the accompanying statement avoided any explicit commitment to further tightening, the updated forecasts carried a more hawkish undertone.

          Notably, the new projections are built on an assumption that the policy rate rises further to around 4.2% by the end of this year. That implicitly points to at least one additional hike being needed in the Bank's view to contain resurging inflationary pressures.

          In its statement, the RBA acknowledged that a broad range of recent data confirms inflationary pressures "picked up materially" in the second half of 2025. While part of the acceleration is judged to be temporary, the Bank highlighted that private demand is growing faster than expected, capacity pressures are higher than previously assessed, and labour market conditions remain slightly tight. Against that backdrop, the Board concluded that inflation is "likely to remain above target for some time," justifying today's move.

          The message suggests policy is shifting from fine-tuning toward a more deliberate effort to re-anchor inflation expectations. The revised forecasts reinforce that view. CPI is now projected to peak at 4.2% in June 2026, up sharply from the previous 3.7% estimate, before easing to 3.6% by December 2026 and only gradually returning to 2.7% by end-2027. Trimmed mean inflation was also revised higher across the horizon, with the peak lifted to 3.7% in mid-2026.

          Growth and labour market assumptions remain resilient. Average GDP growth for 2026 was revised up to 2.1% (from 1.9%), while the unemployment rate was nudged lower to 4.3% (down from 4.4%) next year, before edging higher to 4.5% in 2027. That profile suggests the RBA sees room to keep policy restrictive without inflicting material damage on employment, keeping the door open for further tightening if inflation fails to cool as projected.

          AUD/USD uptrend to resume to 0.72 after hawkish RBA hike

          Aussie rallied broadly after the RBA raised the cash rate by 25bps to 3.85%, in line with expectations. While the decision itself was fully priced, the accompanying forecasts carried an implicit signal that another rate hike is likely later this year, providing fresh support to the currency.

          AUD/USD quickly pushed back above the 0.7000 mark following the announcement. Technically, strong support has been established at 55 4H EMA, suggesting that the recent consolidation from the 0.7093 should remain shallow and temporary.

          Decisive break above 0.7093 would confirm continuation of the broader uptrend from 0.5913 (2025 low). In this scenario, AUD/USD would be on track to 100% projection of 0.5913 to 0.6706 from 0.6420 at 0.7213 in the next leg higher.

          EUR/AUD Daily Outlook

          Daily Pivots: (S1) 1.6947; (P) 1.7016; (R1) 1.7091;

          EUR/AUD's decline resumed by breaking through 1.6892 temporary low and intraday bias is back on the downside. Sustained trading below 100% projection of 1.8554 to 1.7245 from 1.8160 at 1.6851 will pave the way to 138.2% projection at 1.6351 next. On the upside, break of 1.7145 resistance is needed to indicate short term bottoming. Otherwise, will remain bearish in case of recovery.

          In the bigger picture, fall from 1.8554 medium term top is still in progress. Sustained break of 38.2% retracement of 1.4281 to 1.8554 at 1.6922 will argue that it's already reversing whole up trend from 1.4281 (2022 low). Deeper fall would be seen to 61.8% retracement at 1.5913. For now, risk will stay on the downside as long as 55 D EMA (now at 1.7418) holds even in case of strong rebound.

          Source: ACTIONFOREX

          To stay updated on all economic events of today, please check out our Economic calendar
          Risk Warnings and Disclaimers
          You understand and acknowledge that there is a high degree of risk involved in trading. Following any strategies or investment methods may lead to potential losses. The content on the site is provided by our contributors and analysts for information purposes only. You are solely responsible for determining whether any trading assets, securities, strategy, or any other product is suitable for investing based on your own investment objectives and financial situation.
          Add to Favorites
          Share
          FastBull
          Copyright © 2026 FastBull Ltd

          728 RM B 7/F GEE LOK IND BLDG NO 34 HUNG TO RD KWUN TONG KLN HONG KONG

          TelegramInstagramTwitterfacebooklinkedin
          App Store Google Play Google Play
          Products
          Charts

          Chats

          Q&A with Experts
          Screeners
          Economic Calendar
          Data
          Tools
          Membership
          Features
          Function
          Markets
          Copy Trading
          Latest Signals
          Contests
          News
          Analysis
          24/7
          Columns
          Education
          Company
          Careers
          About Us
          Contact Us
          Advertising
          Help Center
          Feedback
          User Agreement
          Privacy Policy
          Personal Information Protection Statement
          Business

          White Label

          Broker API

          Data API

          Web Plug-ins

          Poster Maker

          Affiliate Program

          Risk Disclosure

          The risk of loss in trading financial instruments such as stocks, FX, commodities, futures, bonds, ETFs and crypto can be substantial. You may sustain a total loss of the funds that you deposit with your broker. Therefore, you should carefully consider whether such trading is suitable for you in light of your circumstances and financial resources.

          No decision to invest should be made without thoroughly conducting due diligence by yourself or consulting with your financial advisors. Our web content might not suit you since we don't know your financial conditions and investment needs. Our financial information might have latency or contain inaccuracy, so you should be fully responsible for any of your trading and investment decisions. The company will not be responsible for your capital loss.

          Without getting permission from the website, you are not allowed to copy the website's graphics, texts, or trademarks. Intellectual property rights in the content or data incorporated into this website belong to its providers and exchange merchants.

          Not Logged In

          Log in to access more features

          Connect Broker
          Become a signal provider
          Help Center
          Customer Service
          Dark Mode
          Price Up/Down Colors

          Log In

          Sign Up

          Position
          Layout
          Fullscreen
          Default to Chart
          The chart page opens by default when you visit fastbull.com