• Trade
  • Markets
  • Copy
  • Contests
  • News
  • 24/7
  • Calendar
  • Q&A
  • Chats
Trending
Screeners
SYMBOL
LAST
BID
ASK
HIGH
LOW
NET CHG.
%CHG.
SPREAD
SPX
S&P 500 Index
6920.92
6920.92
6920.92
6965.70
6919.18
-23.90
-0.34%
--
DJI
Dow Jones Industrial Average
48996.07
48996.07
48996.07
49621.43
48951.99
-466.00
-0.94%
--
IXIC
NASDAQ Composite Index
23584.26
23584.26
23584.26
23723.37
23504.22
+37.10
+ 0.16%
--
USDX
US Dollar Index
98.890
98.970
98.890
98.990
98.840
-0.030
-0.03%
--
EURUSD
Euro / US Dollar
1.16452
1.16459
1.16452
1.16518
1.16359
+0.00033
+ 0.03%
--
GBPUSD
Pound Sterling / US Dollar
1.34415
1.34425
1.34415
1.34491
1.34190
+0.00208
+ 0.15%
--
XAUUSD
Gold / US Dollar
4626.68
4627.02
4626.68
4639.52
4588.51
+40.58
+ 0.88%
--
WTI
Light Sweet Crude Oil
60.362
60.392
60.362
60.933
60.349
-0.494
-0.81%
--

Community Accounts

Signal Accounts
--
Profit Accounts
--
Loss Accounts
--
View More

Become a signal provider

Sell trading signals to earn additional income

View More

Guide to Copy Trading

Get started with ease and confidence

View More

Signal Accounts for Members

All Signal Accounts

Best Return
  • Best Return
  • Best P/L
  • Best MDD
Past 1W
  • Past 1W
  • Past 1M
  • Past 1Y

All Contests

  • All
  • Trump Updates
  • Recommend
  • Stocks
  • Cryptocurrencies
  • Central Banks
  • Featured News
Top News Only
Share

European Central Bank Deputy Governor Guindos: Geopolitical Risk Noticeably Raises Downside Risks To Growth

Share

European Central Bank Deputy Governor Guindos: High Uncertainty In The Global Environment Does Not Appear To Be Reflected In Current Market Pricing

Share

European Central Bank Deputy Governor Guindos: Excessive Fiscal Deficits And Public Debts In The Euro Area Need To Be Reduced

Share

European Central Bank Deputy Governor Guindos: Inflation Remains In A Good Place

Share

European Central Bank Deputy Governor Guindos: Financial Stability Risks Remain Elevated As Valuations Are Stretched In Increasingly Concentrated Asset Markets

Share

Bank Of Japan Puts Self Defense Ahead Of Solidarity With Fed's Chairman Powell

Share

Fresnillo Shares Hit Record High, Up 3.5% As Silver Breaks Above $90

Share

Bank Of England's Taylor: At-Target Inflation From Mid-2026 Is Likely To Be Sustainable

Share

European Central Bank Governing Council Member Villeroy: Livret A Rate Could Go Down A Bit But Should Stay Above Inflation Rate

Share

European Central Bank Governing Council Member Villeroy: If The Budget Deficit Were To Be Higher Than 5% In 2026, France Would Enter The Danger Zone

Share

China Foreign Ministry, On Trump Comment About Iran Protesters: Opposes Outside Interference In Internal Affairs

Share

Japan Chief Cabinet Secretary Kihara: Important For Currencies To Move In Stable Manner Reflecting Fundamentals

Share

Stats Office - Swedish Household Consumption 1.0% Month-On-Month In November

Share

Eurostoxx 50 Futures Up 0.08%, DAX Futures Down 0.05%, FTSE Futures Up 0.14%

Share

Swedish Industry Orders +23.0 % Year-On-Year In November

Share

Romanian Consumer Price Inflation At 9.69% Year-On-Year In December Versus Forecast 9.65% - Stats Board

Share

Romanian Consumer Price Inflation At 0.22% Month-On-Month In December - Stats Board

Share

Kuwait Oct CPI +0.07% Month-On-Month

Share

Kuwait Oct CPI +2.46% Year-On-Year

Share

French Foreign Affairs Minister: France Will Open Consulate In Greenland On Feb 6

TIME
ACT
FCST
PREV
U.S. Cleveland Fed CPI MoM (SA) (Dec)

A:--

F: --

P: --

U.S. Cleveland Fed CPI MoM (Dec)

A:--

F: --

P: --

China, Mainland M0 Money Supply YoY (Dec)

--

F: --

P: --

China, Mainland M1 Money Supply YoY (Dec)

--

F: --

P: --

China, Mainland M2 Money Supply YoY (Dec)

--

F: --

P: --

U.S. EIA Natural Gas Production Forecast For The Next Year (Jan)

A:--

F: --

P: --

U.S. EIA Short-Term Crude Production Forecast For The Next Year (Jan)

A:--

F: --

P: --

U.S. EIA Short-Term Crude Production Forecast For The Year (Jan)

A:--

F: --

P: --

EIA Monthly Short-Term Energy Outlook
U.S. 30-Year Bond Auction Avg. Yield

A:--

F: --

P: --

Argentina 12-Month CPI (Dec)

A:--

F: --

P: --

U.S. Budget Balance (Dec)

A:--

F: --

P: --

Argentina CPI MoM (Dec)

A:--

F: --

P: --

Argentina National CPI YoY (Dec)

A:--

F: --

P: --

Richmond Federal Reserve President Barkin delivered a speech.
U.S. API Weekly Cushing Crude Oil Stocks

A:--

F: --

P: --

U.S. API Weekly Crude Oil Stocks

A:--

F: --

P: --

U.S. API Weekly Refined Oil Stocks

A:--

F: --

P: --

U.S. API Weekly Gasoline Stocks

A:--

F: --

P: --

South Korea Unemployment Rate (SA) (Dec)

A:--

F: --

P: --

Japan Reuters Tankan Non-Manufacturers Index (Jan)

A:--

F: --

P: --

Japan Reuters Tankan Manufacturers Index (Jan)

A:--

F: --

P: --

China, Mainland Exports YoY (CNH) (Dec)

A:--

F: --

P: --

China, Mainland Trade Balance (USD) (Dec)

A:--

F: --

P: --

China, Mainland Trade Balance (CNH) (Dec)

A:--

F: --

P: --

China, Mainland Exports (Dec)

A:--

F: --

P: --

China, Mainland Imports YoY (CNH) (Dec)

A:--

F: --

P: --

China, Mainland Imports (CNH) (Dec)

A:--

F: --

P: --

China, Mainland Imports YoY (USD) (Dec)

A:--

F: --

P: --

China, Mainland Exports YoY (USD) (Dec)

A:--

F: --

P: --

China, Mainland Outstanding Loans Growth YoY (Dec)

--

F: --

P: --

U.K. 10-Year Note Auction Yield

--

F: --

P: --

Canada Leading Index MoM (Dec)

--

F: --

P: --

U.S. MBA Mortgage Application Activity Index WoW

--

F: --

P: --

U.S. Core PPI YoY (Nov)

--

F: --

P: --

U.S. PPI MoM (SA) (Nov)

--

F: --

P: --

U.S. PPI YoY (Nov)

--

F: --

P: --

U.S. Current Account (Q3)

--

F: --

P: --

U.S. Retail Sales YoY (Nov)

--

F: --

P: --

U.S. Retail Sales (Nov)

--

F: --

P: --

U.S. Core Retail Sales MoM (Nov)

--

F: --

P: --

U.S. PPI YoY (Excl. Food, Energy & Trade) (Nov)

--

F: --

P: --

U.S. PPI MoM Final (Excl. Food, Energy and Trade) (SA) (Nov)

--

F: --

P: --

U.S. Core Retail Sales (Nov)

--

F: --

P: --

U.S. Retail Sales MoM (Excl. Automobile) (SA) (Nov)

--

F: --

P: --

U.S. Retail Sales MoM (Nov)

--

F: --

P: --

U.S. Retail Sales MoM (Excl. Gas Stations & Vehicle Dealers) (SA) (Nov)

--

F: --

P: --

U.S. Core PPI MoM (SA) (Nov)

--

F: --

P: --

Philadelphia Fed President Henry Paulson delivers a speech
U.S. Commercial Inventory MoM (Oct)

--

F: --

P: --

U.S. Existing Home Sales Annualized Total (Dec)

--

F: --

P: --

U.S. Existing Home Sales Annualized MoM (Dec)

--

F: --

P: --

U.S. EIA Weekly Cushing, Oklahoma Crude Oil Stocks Change

--

F: --

P: --

U.S. EIA Weekly Crude Stocks Change

--

F: --

P: --

U.S. EIA Weekly Gasoline Stocks Change

--

F: --

P: --

U.S. EIA Weekly Crude Demand Projected by Production

--

F: --

P: --

U.S. EIA Weekly Crude Oil Imports Changes

--

F: --

P: --

U.S. EIA Weekly Heating Oil Stock Changes

--

F: --

P: --

U.S. Refinitiv/Ipsos Primary Consumer Sentiment Index (PCSI) (Jan)

--

F: --

P: --

Japan Domestic Enterprise Commodity Price Index YoY (Dec)

--

F: --

P: --

Japan Domestic Enterprise Commodity Price Index MoM (Dec)

--

F: --

P: --

Q&A with Experts
    • All
    • Chatrooms
    • Groups
    • Friends
    SlowBear ⛅ flag
    Nawhdir. Øt
    @Nawhdir. ØtYou cannot play the market maker and marker really just do their things and it is not personal
    EuroTrader flag
    Nawhdir. Øt
    @Nawhdir. ØtYou should be trading with brokers like Charles schwab or Td Ameritrade
    Kevedge FX flag
    SlowBear ⛅ flag
    SlowBear ⛅
    @Nawhdir. Øt hybrid broker come to you directly, if you are tagged with different risk or classiified wrongly in their system and you wen ahead to make crazy profit you will likely get smoked intentionally
    Nawhdir. Øt flag
    SlowBear ⛅
    @SlowBear ⛅yes, that's what my friend experienced
    SlowBear ⛅ flag
    Nawhdir. Øt
    @Nawhdir. Øt exactly, when you are wrongly classified as a trader on an hybrid broker platform and all of a suddent you start making crasy profits - but you are classified as a beginner to lose money in less than 2momths but you have made money consistently, you will see some crazy manipulations or failure or sow withdrwal accesss
    Nawhdir. Øt flag
    SlowBear ⛅
    @SlowBear ⛅luckily, I'm still fluent
    Nawhdir. Øt flag
    That's why I really watch my tempo on this big account, rarely make transactions, but once I make a transaction, I have to hold it for a long time, and stick to lot management.
    Nawhdir. Øt flag
    Nawhdir. Øt
    That's why I really watch my tempo on this big account, rarely make transactions, but once I make a transaction, I have to hold it for a long time, and stick to lot management.
    and should also be rare in withdrawing funds
    "Nawhdir. Øt" recalled a message
    SlowBear ⛅ flag
    Nawhdir. Øt
    That's why I really watch my tempo on this big account, rarely make transactions, but once I make a transaction, I have to hold it for a long time, and stick to lot management.
    @Nawhdir. Øt Yes i see whay you are always very cautious bro
    SlowBear ⛅ flag
    Nawhdir. Øt
    That's why I really watch my tempo on this big account, rarely make transactions, but once I make a transaction, I have to hold it for a long time, and stick to lot management.
    @Nawhdir. ØtSi even se that you mosty trade stocks and fx pairs on the big account!
    Kung Fu flag
    Nawhdir. Øt
    That's why I really watch my tempo on this big account, rarely make transactions, but once I make a transaction, I have to hold it for a long time, and stick to lot management.
    @Nawhdir. Øthehehe. That's the philosopher speaking
    Nawhdir. Øt flag
    but once I withdraw funds, the minimum I withdraw is £100,000
    N8RQ6856EK flag
    Please advise anyone I want to join the Trading contest
    Nawhdir. Øt flag
    however, I have to keep a margin of £400,000 - max £900,000 around that
    Kung Fu flag
    Nawhdir. Øt
    but once I withdraw funds, the minimum I withdraw is £100,000
    @Nawhdir. Øtdon't reveal too much ,Neighbor.
    SlowBear ⛅ flag
    Nawhdir. Øt
    but once I withdraw funds, the minimum I withdraw is £100,000
    @Nawhdir. ØtOf course, you are a big man bro, so you have to hold tarde for years
    EuroTrader flag
    Nawhdir. Øt
    That's why I really watch my tempo on this big account, rarely make transactions, but once I make a transaction, I have to hold it for a long time, and stick to lot management.
    @Nawhdir. ØtNow you have to be trading with restrictions on your account cousin
    Kung Fu flag
    N8RQ6856EK
    Please advise anyone I want to join the Trading contest
    @N8RQ6856EKjust sign up, Brother
    Type here...
    Add Symbol or Code

      No matching data

      All
      Trump Updates
      Recommend
      Stocks
      Cryptocurrencies
      Central Banks
      Featured News
      • All
      • Russia-Ukraine Conflict
      • Middle East Flashpoint
      • All
      • Russia-Ukraine Conflict
      • Middle East Flashpoint
      Search
      Products

      Charts Free Forever

      Chats Q&A with Experts
      Screeners Economic Calendar Data Tools
      Membership Features
      Data Warehouse Market Trends Institutional Data Policy Rates Macro

      Market Trends

      Market Sentiment Order Book Forex Correlations

      Top Indicators

      Charts Free Forever
      Markets

      News

      News Analysis 24/7 Columns Education
      From Institutions From Analysts
      Topics Columnists

      Latest Views

      Latest Views

      Trending Topics

      Top Columnists

      Latest Update

      Signals

      Copy Rankings Latest Signals Become a signal provider AI Rating
      Contests
      Brokers

      Overview Brokers Assessment Rankings Regulators News Claims
      Broker listing Forex Brokers Comparison Tool Live Spread Comparison Scam
      Q&A Complaint Scam Alert Videos Tips to Detect Scam
      More

      Business
      Events
      Careers About Us Advertising Help Center

      White Label

      Data API

      Web Plug-ins

      Affiliate Program

      Awards Institution Evaluation IB Seminar Salon Event Exhibition
      Vietnam Thailand Singapore Dubai
      Fans Party Investment Sharing Session
      FastBull Summit BrokersView Expo
      Recent Searches
        Top Searches
          Markets
          News
          Analysis
          User
          24/7
          Economic Calendar
          Education
          Data
          • Names
          • Latest
          • Prev

          View All

          No data

          Scan to Download

          Faster Charts, Chat Faster!

          Download App
          English
          • English
          • Español
          • العربية
          • Bahasa Indonesia
          • Bahasa Melayu
          • Tiếng Việt
          • ภาษาไทย
          • Français
          • Italiano
          • Türkçe
          • Русский язык
          • 简中
          • 繁中
          Open Account
          Search
          Products
          Charts Free Forever
          Markets
          News
          Signals

          Copy Rankings Latest Signals Become a signal provider AI Rating
          Contests
          Brokers

          Overview Brokers Assessment Rankings Regulators News Claims
          Broker listing Forex Brokers Comparison Tool Live Spread Comparison Scam
          Q&A Complaint Scam Alert Videos Tips to Detect Scam
          More

          Business
          Events
          Careers About Us Advertising Help Center

          White Label

          Data API

          Web Plug-ins

          Affiliate Program

          Awards Institution Evaluation IB Seminar Salon Event Exhibition
          Vietnam Thailand Singapore Dubai
          Fans Party Investment Sharing Session
          FastBull Summit BrokersView Expo

          Japanese Yen Forecast: USD/JPY Eyes 160 Amid Fiscal Policy Concerns

          Samantha Luan

          Forex

          Economic

          Summary:

          USD/JPY eyes 160 as Japan election risks and fiscal stimulus plans send JGB yields higher and weaken the yen despite growing BoJ rate hike expectations.

          Key Points:

          · USD/JPY targets 160 as Japan's snap election risk and fiscal stimulus fears weaken the yen amid soaring JGB yields.
          · Rising 10-year JGB yields near 2.18% reflect growing concerns over Japan's debt outlook and fiscal policy direction.
          · Despite bullish technicals, expectations of BoJ rate hikes reinforce a bearish medium-term outlook for USD/JPY.

          USD/JPY eyes 160 for the first time since the July 2024 yen carry trade unwind as political uncertainty and concerns over monetary and fiscal policy weaken the yen.

          The USD/JPY pair gained momentum in the first half of the week despite rising beyond the 157 level, a previous yen intervention threat zone. Japan's finance minister previously warned of yen intervention in the forex markets in the 157-158 range.

          This week, 10-year Japanese Government Bond (JGB) yields surged to 2.178%. The weaker yen and soaring yields reflected market sentiment toward Prime Minister Sanae Takaichi's plans for a snap election. Fading bets on a March Fed rate cut have added to USD/JPY momentum.

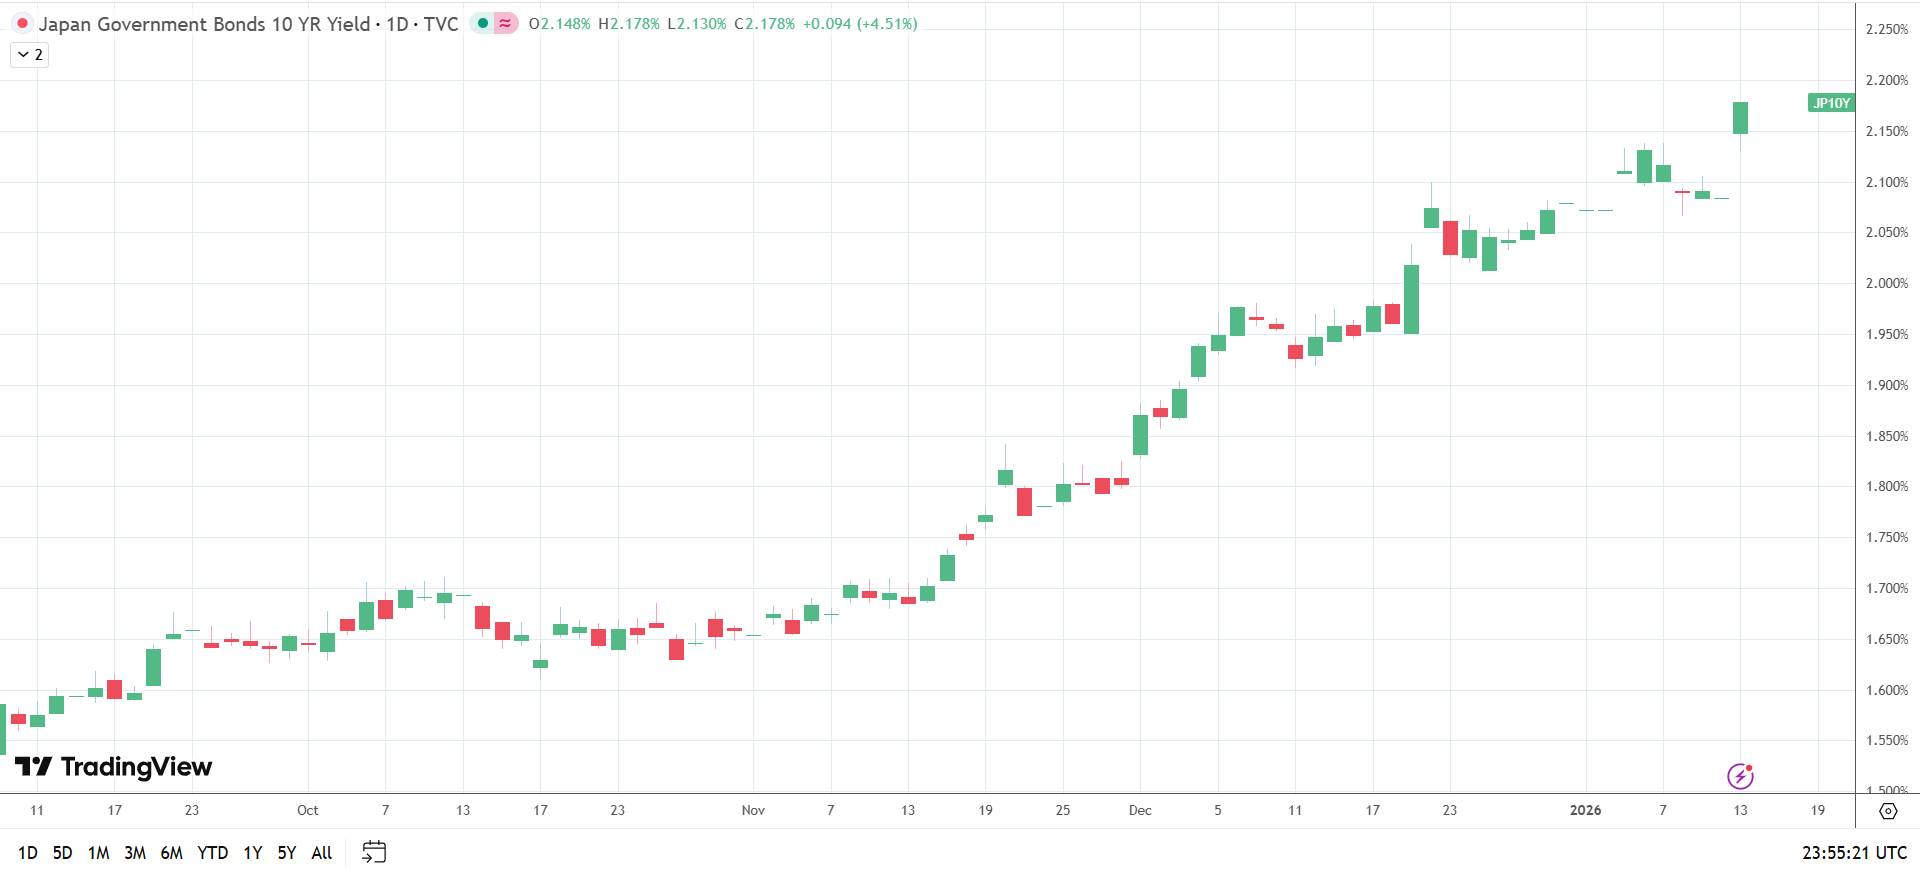
          10-Year JGB Yields – 140125 – Daily Chart

          Below, I'll discuss the macro backdrop, the near-term price catalysts, and technical levels traders should closely watch.

          Snap Election and Fiscal Policy Concerns Sink the Yen

          News outlets reported that Japan's Prime Minister Takaichi may call for a snap election in February over the weekend, her first time facing national voters. Speculation about a snap election intensified as Takaichi's approval rating jumped to 78.1% in January, according to a JNN public opinion survey.

          Meanwhile, the Liberal Democratic Party's approval rating remains below 30%, fueling uncertainty over how voters will side in a national election. A strong election win would enable Takaichi to push through fiscal stimulus plans, weighing on demand for the yen. Takaichi's fiscal stimulus plans and Japan's debt-to-GDP ratio have led to a surge in risk premiums for holding JGBs, sending yields to decade highs.

          Robin Brooks, Senior Fellow at the Brookings Institution, commented:

          "Japan is trapped in a very bad place and is the G10 country that's closest to a full-blown debt crisis. Japan's only choice is to accept higher interest rates and a debt crisis or – if it caps yields – a depreciating yen, which is nearing its 2024 lows…"

          Notably, USD/JPY has surged 8.25% since Takaichi's election win to become the LDP leader in early October. USD/JPY trends underscored market concerns about her stance on fiscal stimulus and monetary policy.

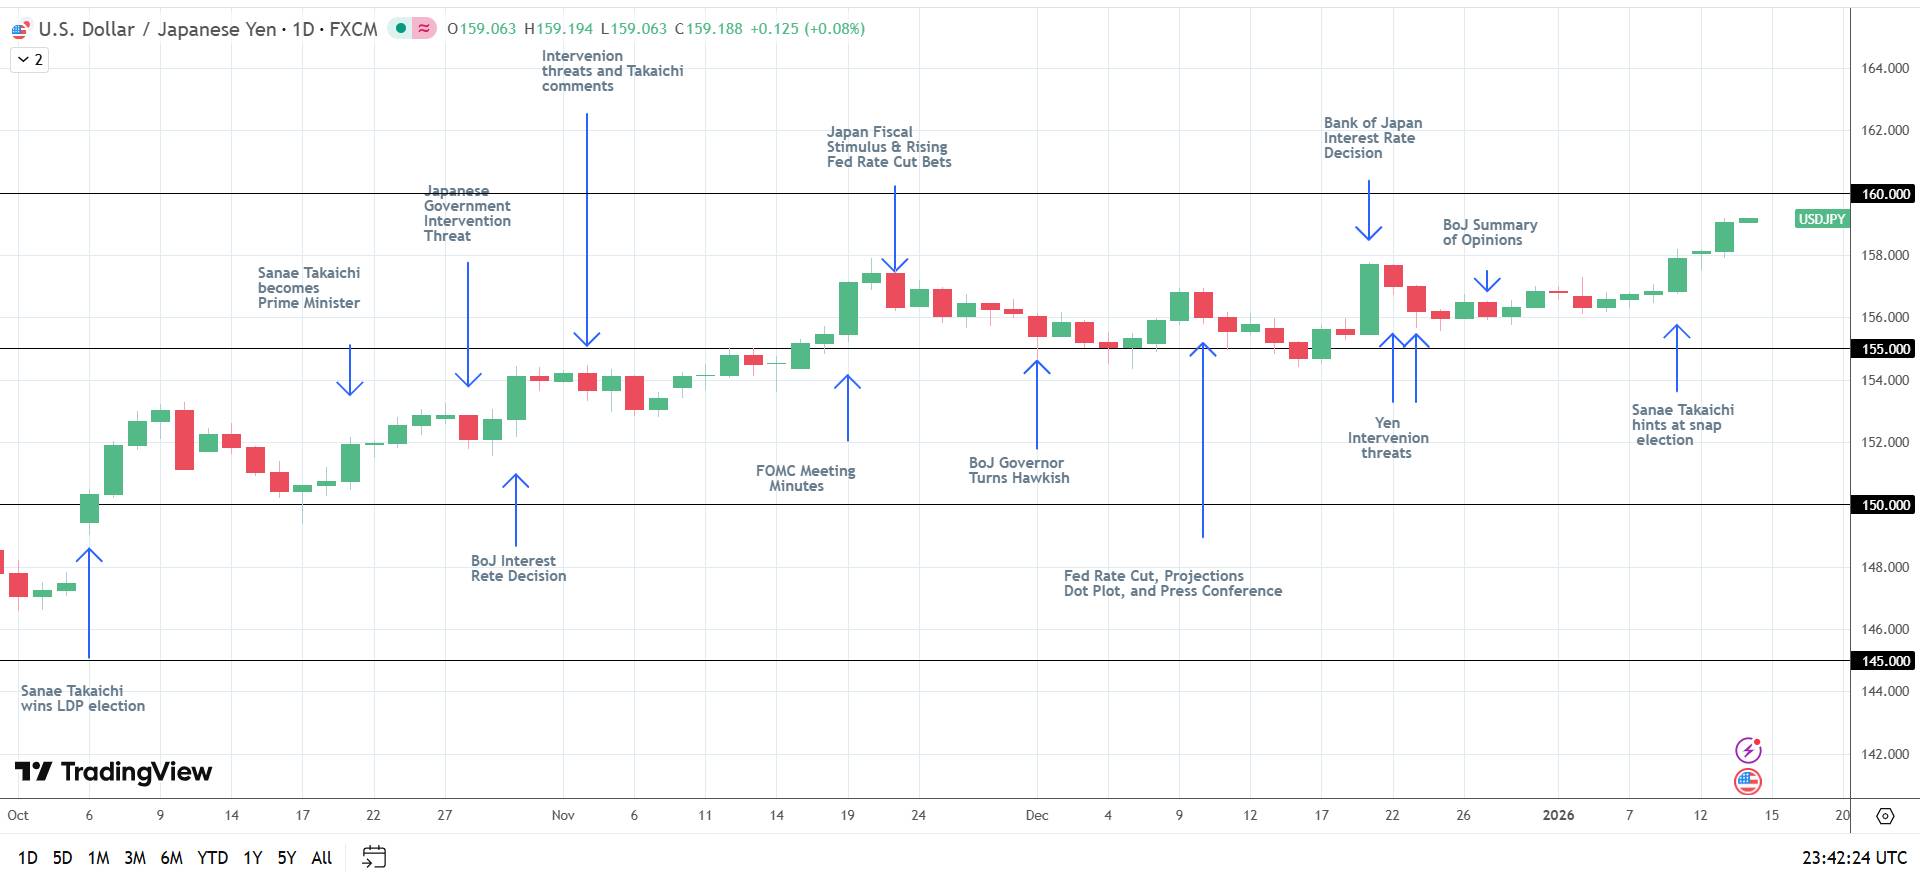
          USDJPY – Daily Chart – 140126 – Takaichi Effect

          The political uncertainty supports a cautiously bullish short-term price outlook for USD/JPY. However, potential yen interventions and the prospect of Bank of Japan rate hikes affirm the bearish medium-term projection.

          Crucially, the weaker yen would increase import prices, eroding households' purchasing power. These scenarios may force the BoJ to signal further policy tightening to strengthen the yen.

          US Producer Prices and Retail Sales to Drive Dollar Demand

          Later on Wednesday, US retail sales and producer prices are likely to influence market bets on a March Fed rate cut.

          Economists forecast retail sales to rise 3.0% year-on-year (YoY) in November, down from 3.5% in October. Weaker consumer spending would signal a softer demand-driven outlook, supporting a more dovish Fed rate path.

          Meanwhile, economists expect producer prices to increase 2.7% YoY in November, mirroring October's rise. Softer-than-expected producer prices would raise expectations of a March Fed rate cut, weighing on demand for the US Dollar. Increased bets on a March cut would support the bearish medium-term outlook for USD/JPY.

          According to the CME FedWatch Tool, the probability of a March Fed rate cut fell from 48.5% on January 6 to 25.7% on January 13. Stronger-than-expected US labor market and Services PMI data cooled expectations of a March cut.

          Today's US economic data will be key for the near-term USD/JPY price outlook. Stronger US data would signal a more hawkish Fed policy stance, strengthening the US dollar, and challenging the bearish medium-term outlook.

          Nevertheless, expectations of multiple BoJ rate hikes and a new Fed Chair potentially favoring lower interest rates remain key considerations. These factors reinforce the bearish medium-term outlook for USD/JPY.

          Technical Outlook: Key Levels to Watch

          For USD/JPY price trends, traders should consider technicals and closely monitor the fundamentals.

          Viewing the daily chart, USD/JPY trades well above its 50-day and 200-day Exponential Moving Averages (EMAs), indicating bullish momentum. While technicals remain bullish, bearish fundamentals are evolving, countering the technicals.

          A drop below 157 would bring the 50-day EMA and the 155 support level into play. A sustained fall below the 50-day EMA would signal a bearish near-term trend reversal, exposing the 200-day EMA. If breached, 150 would be the next key support level.

          Crucially, a sustained fall below the 50-day and 200-day EMAs would reinforce the bearish medium-term price outlook.

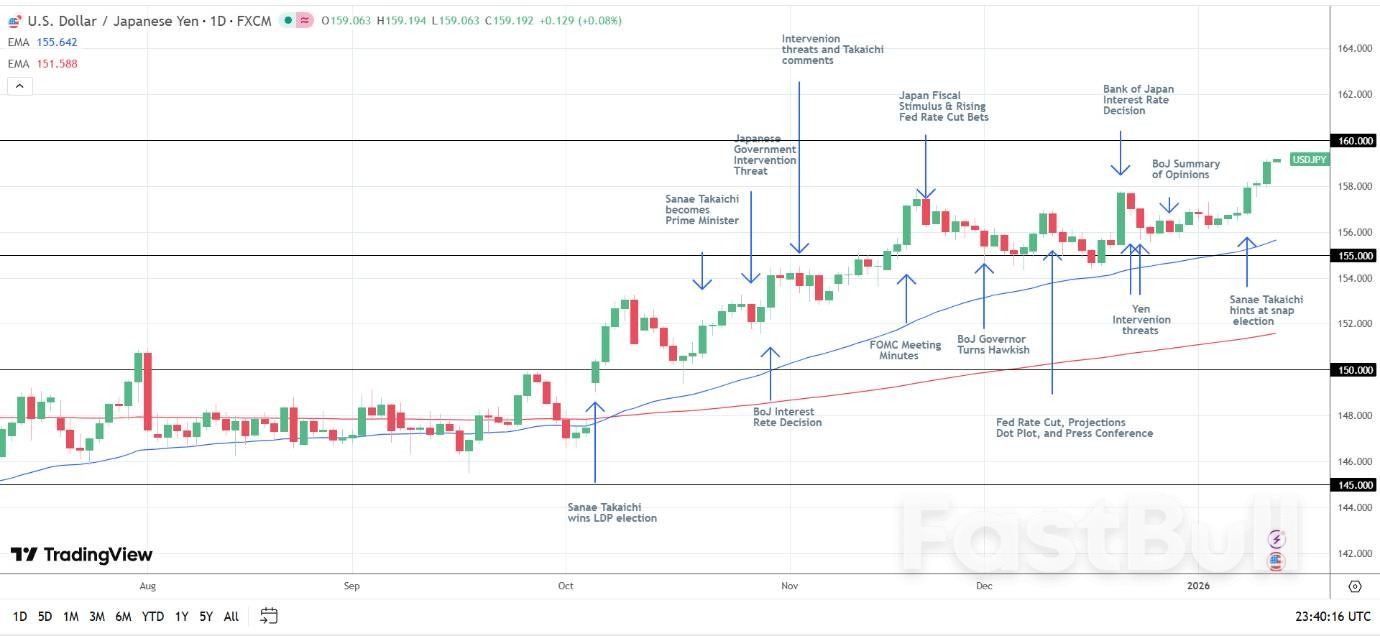
          USDJPY – Daily Chart – 140126 – EMAs

          Position and Upside Risk

          In my view, expectations for BoJ rate hikes, potential warnings of yen intervention, and bets on Fed rate cuts support a negative price outlook. However, the BoJ neutral interest rate and upcoming US data will be pivotal, given the focus on US-Japan rate differentials.

          A hawkish BoJ neutral interest rate level (potentially 1.5%-2.5%) would signal multiple BoJ rate hikes and a narrower US-Japan interest rate differential. A narrower-than-expected rate differential may trigger a yen carry unwind, sending USD/JPY toward 140 over the longer term.

          However, upside risks to the bearish outlook include:

          · Dovish BoJ chatter and a dovish neutral interest rate (potentially 1%-1.25%).
          · Strong US economic data.
          · Hawkish Fed chatter.

          These events would send USD/JPY higher. However, the threat of yen interventions is likely to cap the upside at the 160 level, based on the latest communication.

          Read the full USD/JPY forecast, including chart setups and trade ideas.

          Conclusion: Politics, Neutral Rate, and US Data in the Spotlight

          In summary, the USD/JPY trends will hinge on Prime Minister Takaichi's election and policy goals, the BoJ's neutral rate, and the Fed rate path.

          While a comfortable Takaichi election win would be USD/JPY bullish, a hawkish neutral rate (1.5%-2.5%) would indicate an aggressive BoJ rate path, delivering yen strength. Additionally, dovish Fed chatter would raise expectations of narrower rate differentials, reaffirming the bearish outlook for USD/JPY.

          Notably, a sharply stronger yen could trigger the unwinding of yen carry trades, which would likely send USD/JPY toward 140 over the longer 6-12 month timeline.

          Source: FX Empire

          To stay updated on all economic events of today, please check out our Economic calendar
          Risk Warnings and Disclaimers
          You understand and acknowledge that there is a high degree of risk involved in trading. Following any strategies or investment methods may lead to potential losses. The content on the site is provided by our contributors and analysts for information purposes only. You are solely responsible for determining whether any trading assets, securities, strategy, or any other product is suitable for investing based on your own investment objectives and financial situation.
          Add to Favorites
          Share

          Spot Silver Breaks Through $90 Per Ounce For First Time

          Justin

          Commodity

          Forex

          Spot Silver Breaks Through $90 Per Ounce For First Time_1

          Silver bars are stacked in the safe deposit boxes room of the Pro Aurum gold house in Munich, Germany, January 10, 2025. REUTERS/Angelika Warmuth

          Spot silver jumped ​above the key $90 ‌an ounce level for the first ‌time as soft ​U.S. inflation data cemented ‍interest rate cut bets by the ⁠U.S. Federal ‍Reserve on the ‌back ‌of geopolitical tensions, robust industrial and investment ⁠demand ⁠and ​tightening inventories.

          Silver prices rose more ‍than 3% to $90 per ounce ​by 0308 ‍GMT.

          Reporting by Ishaan ​Arora in Bengaluru;

          Source: Reuters

          Risk Warnings and Disclaimers
          You understand and acknowledge that there is a high degree of risk involved in trading. Following any strategies or investment methods may lead to potential losses. The content on the site is provided by our contributors and analysts for information purposes only. You are solely responsible for determining whether any trading assets, securities, strategy, or any other product is suitable for investing based on your own investment objectives and financial situation.
          Add to Favorites
          Share

          Rupee Faces Fresh Pressure As Stronger Dollar Tests RBI’s Defenses

          Gerik

          Economic

          Forex

          Dollar Strength Sets The Tone

          The Indian rupee entered Wednesday under renewed pressure after U.S. inflation data lifted the dollar to a near one-month high. The one-month non-deliverable forward market suggested the rupee would open in the 90.26 to 90.30 range against the U.S. dollar, compared with a close of 90.19 on Tuesday. Although December’s U.S. headline inflation came in line with expectations and core inflation was slightly softer than anticipated, the data did little to alter the broader outlook for U.S. monetary policy. As a result, the dollar found buyers rather than retreating, reinforcing near-term pressure on emerging market currencies such as the rupee.
          The 90.28 to 90.30 region is widely regarded by market participants as a critical near-term support for the rupee. This perception is rooted in recent market behavior rather than coincidence, as the Reserve Bank of India has been seen intervening around these levels. Traders noted that the RBI sold dollars aggressively near this zone last Monday, and the currency again found support there on Tuesday, likely reflecting renewed central bank action. The relationship here is sequential: expectations of intervention shape trader behavior, which in turn concentrates market activity around specific price levels.

          Risk Of A Technical Break

          Despite recent support, traders warned that the rupee remains vulnerable. One market participant said there was a decent chance the currency could push through 90.30 during the session. A sustained move beyond that level could open the way toward 90.50 to 90.60, shifting attention to how forcefully the RBI might respond. In this context, price action is driven less by new domestic fundamentals and more by the interaction between global dollar strength and perceived intervention thresholds.
          The dollar index edged higher in Asian trade, extending Tuesday’s 0.3% gain. Markets continue to expect the Federal Reserve’s first rate cut of 2026 around the June meeting, leaving the dollar broadly supported in the near term. Analysts at MUFG Bank noted that the overall inflationary impact from U.S. tariffs remains contained at an aggregate level, even though individual components showed volatility and lingering effects from data gaps caused by the U.S. government shutdown. MUFG added that it still expects the Fed to cut rates more aggressively than markets are currently pricing, highlighting a divergence between market consensus and some institutional forecasts. For now, however, the dollar’s strength reflects correlation with current rate expectations rather than a decisive shift in the policy outlook.

          Flows, Yields, And External Signals

          Broader market indicators offered mixed signals for the rupee. Brent crude futures were down 0.2% at $65.3 per barrel, easing some pressure on India’s import bill. The U.S. 10-year Treasury yield stood at 4.18%, reinforcing the dollar’s appeal through higher relative yields. Foreign portfolio flows remained uneven, with foreign investors selling a net $344.6 million of Indian equities on January 12, while purchasing a net $5.4 million of Indian bonds on the same day, according to NSDL data. These flows suggest selective positioning rather than a broad retreat from Indian assets.
          Overall, the rupee’s near-term direction hinges on whether global dollar strength persists and how firmly the RBI chooses to defend its perceived support zone. While U.S. inflation data has not fundamentally altered the Fed’s expected path, it has been sufficient to sustain the dollar’s bid, leaving the rupee exposed to further testing of key levels.

          Source: Reuters

          To stay updated on all economic events of today, please check out our Economic calendar
          Risk Warnings and Disclaimers
          You understand and acknowledge that there is a high degree of risk involved in trading. Following any strategies or investment methods may lead to potential losses. The content on the site is provided by our contributors and analysts for information purposes only. You are solely responsible for determining whether any trading assets, securities, strategy, or any other product is suitable for investing based on your own investment objectives and financial situation.
          Add to Favorites
          Share

          Precious Metals Surge As Softer U.S. Inflation And Political Risks Reinforce Haven Demand

          Gerik

          Economic

          Commodity

          Silver Breaks Records As Rate-Cut Expectations Build

          Silver surged to an all-time high, rising as much as 2.5% to $89.1644 an ounce, while gold traded close to its own record levels. The rally followed U.S. inflation data that came in softer than feared, reinforcing expectations that the Federal Reserve may have room to ease policy further. Although economists cautioned that December’s underlying inflation was artificially depressed by distortions linked to last year’s record-long government shutdown, the data nonetheless shifted near-term expectations toward a more accommodative policy path. This represents a causal relationship, as lower inflation readings directly reduce pressure on central banks to maintain restrictive interest rates, increasing the appeal of non-yielding assets such as gold and silver.
          Precious metals have extended the momentum built during last year’s sharp rallies, entering 2026 with renewed strength. Silver had already outperformed gold in 2025, surging almost 150% after a short squeeze in October and persistent supply tightness in the London market. The continuation of gains this year reflects both structural supply constraints and sustained investment demand, rather than a single speculative episode. Gold’s advance has been steadier, reflecting its role as a monetary and geopolitical hedge rather than a pure momentum trade.

          Federal Reserve Independence And Market Confidence

          Concerns surrounding the Federal Reserve have also played a role in supporting bullion prices. The prospect of a criminal indictment against Fed Chair Jerome Powell has revived anxieties about the central bank’s independence, a cornerstone of U.S. monetary credibility. Central bankers globally have voiced support for Powell, and JPMorgan Chase chief executive Jamie Dimon warned that political interference could backfire. These developments influence precious metals primarily through correlation, as heightened institutional uncertainty tends to lift demand for assets perceived as stores of value, even in the absence of immediate policy changes.
          Safe-haven demand has been further underpinned by a series of geopolitical flashpoints. President Donald Trump’s capture of Venezuela’s leader, renewed rhetoric over Greenland, and violent protests in Iran that carry the risk of regime instability have all contributed to a tense global backdrop. These events do not directly disrupt precious metals supply, but they elevate risk perception across markets, strengthening the appeal of gold and silver through association with geopolitical stress.

          Bullish Forecast Revisions From Analysts

          Reflecting these dynamics, Citigroup analysts raised their three-month forecasts for gold and silver to $5,000 per ounce and $100 per ounce, respectively. Such revisions highlight growing confidence that macroeconomic conditions and political uncertainty will remain supportive in the near term. While forecasts do not drive prices mechanically, they can reinforce market sentiment by shaping expectations and positioning behavior.
          As of mid-morning trading in Singapore, spot gold rose 0.6% to $4,616.28 an ounce, while silver added 2.4% to $88.9830 after paring some earlier gains. Platinum and palladium also advanced, pointing to broader strength across the precious metals complex. Meanwhile, the Bloomberg Dollar Spot Index was flat after a modest rise the previous session, offering little resistance to bullion prices. A stable dollar environment removes a common headwind for metals, allowing inflation expectations and risk sentiment to play a more prominent role.
          Overall, the surge in silver and renewed strength in gold reflect a convergence of softer inflation data, political uncertainty, and persistent geopolitical tension. While some of the recent inflation weakness may prove temporary, the broader environment continues to favor precious metals as both a hedge against policy risk and a beneficiary of shifting rate expectations.

          Source: Bloomberg

          To stay updated on all economic events of today, please check out our Economic calendar
          Risk Warnings and Disclaimers
          You understand and acknowledge that there is a high degree of risk involved in trading. Following any strategies or investment methods may lead to potential losses. The content on the site is provided by our contributors and analysts for information purposes only. You are solely responsible for determining whether any trading assets, securities, strategy, or any other product is suitable for investing based on your own investment objectives and financial situation.
          Add to Favorites
          Share

          World Bank Sees Weak Global Growth, UAE to Outperform

          King Ten

          Remarks of Officials

          Data Interpretation

          Economic

          The global economy is showing unexpected resilience but is on track for its slowest decade of growth since the 1960s, according to the World Bank's latest Global Economic Prospects report. While the worldwide outlook remains subdued, the UAE economy is projected to expand by 5% in 2026 and accelerate to 5.1% in 2027.

          Global growth is forecast to hold steady, easing to 2.6% in 2026 before rising to 2.7% in 2027. This represents a slight upgrade from previous projections, driven primarily by stronger-than-expected performance from the United States, which accounts for two-thirds of the upward revision.

          A Tale of Two Trajectories: Advanced vs. Developing Economies

          Despite the overall resilience, the report highlights a widening gap in living standards. By the end of 2025, nearly all advanced economies are expected to see per capita incomes surpass 2019 levels. In stark contrast, about one in four developing economies will remain below their pre-pandemic income benchmarks.

          "With each passing year, the global economy has become less capable of generating growth and seemingly more resilient to policy uncertainty," noted Indermit Gill, Chief Economist of the World Bank Group.

          For developing economies, growth is projected to slow from 4.2% in 2025 to 4% in 2026, before picking up to 4.1% in 2027. Per capita income growth in these nations is forecast at 3% in 2026, a full percentage point below the average from 2000–2019. At this rate, their per capita income is only expected to reach 12% of the level seen in advanced economies.

          Low-income countries are forecast to grow at a faster clip, averaging 5.6% over 2026–2027, but this pace is insufficient to close the income gap. These trends amplify the challenge of creating jobs for the 1.2 billion young people expected to enter the workforce in developing economies over the next decade.

          Regional Outlook: Middle East Shows Promise

          Growth prospects in the Middle East are more optimistic. The World Bank projects that Gulf Cooperation Council (GCC) states will see economic growth accelerate to 4.4% in 2026 and 4.6% in 2027. For the wider Middle East, North Africa, Afghanistan, and Pakistan (MENAP) region, growth is expected to hit 3.6% in 2026 and rise further to 3.9% in 2027.

          The global economy in 2025 was buoyed by a surge in trade and rapid adjustments in supply chains. As these effects fade, softening domestic demand is expected in 2026. However, easing global financial conditions and a projected decline in global inflation to 2.6% should provide a cushion against the slowdown.

          The Urgent Need for Fiscal Reform

          The report emphasizes that overcoming these challenges requires a comprehensive policy response from developing economies. The World Bank outlines a three-pillar strategy:

          • Strengthening Capital: Bolster physical, digital, and human capital to boost productivity.

          • Improving Business Environment: Enhance policy credibility and regulatory certainty to encourage business expansion.

          • Mobilizing Private Capital: Attract private investment on a large scale.

          A critical focus is the need to restore fiscal sustainability, which has been weakened by successive shocks, rising debt-servicing costs, and growing development needs.

          "With public debt in emerging and developing economies at its highest level in more than half a century, restoring fiscal credibility has become an urgent priority," said M. Ayhan Kose, Deputy Chief Economist at the World Bank. He added that well-designed fiscal rules can help stabilize debt and build resilience, but their success hinges on credibility, enforcement, and political commitment.

          To stay updated on all economic events of today, please check out our Economic calendar
          Risk Warnings and Disclaimers
          You understand and acknowledge that there is a high degree of risk involved in trading. Following any strategies or investment methods may lead to potential losses. The content on the site is provided by our contributors and analysts for information purposes only. You are solely responsible for determining whether any trading assets, securities, strategy, or any other product is suitable for investing based on your own investment objectives and financial situation.
          Add to Favorites
          Share

          China's 2025 Imports: Coal Down, Oil & Soybeans Hit Records

          Devin

          Data Interpretation

          Commodity

          Remarks of Officials

          Economic

          Energy

          China–U.S. Trade War

          China's demand for key global commodities diverged sharply last year, with coal imports posting their steepest decline in a decade while crude oil, iron ore, and soybeans surged to new highs.

          Customs data from 2025 reveals a complex picture of the nation's economic priorities. While soaring imports of raw materials signal a push for industrial production and strategic stockpiling, falling purchases of coal and natural gas reflect a surge in domestic output and the growing impact of clean energy alternatives.

          Coal and Gas Imports Face Headwinds

          Coal purchases experienced their most significant drop in ten years, falling 9.6% from the previous year's record to 490 million tons. This marks the first annual decline since 2022. The downturn was driven by a combination of factors, including rising local coal production that pushed domestic prices to four-year lows and a rapid expansion of renewable energy that curbed demand for thermal power. Further pressure on shipments is expected in 2026, as Indonesia—China's largest foreign supplier—plans to cut its own coal output.

          Natural gas imports also fell for the first time in three years, slipping 2.8% to 128 million tons. This decrease was a response to record-high domestic gas production and softer industrial demand. However, the outlook for gas in 2026 appears more positive. China National Petroleum Corp. forecasts that consumption growth will double to 5% this year. A wave of new global export projects is also likely to lower prices, potentially boosting demand for seaborne liquefied natural gas (LNG).

          Oil and Copper Tell a More Complex Story

          Crude oil bucked the trend seen in other fossil fuels. Purchases rose 4.4% to 578 million tons, reversing a decline from 2024. The increase was largely due to strategic stockpiling, which helped offset a sharp drop in fuel demand caused by the ongoing energy transition. A global oil glut could further encourage Beijing to maintain high import levels as a buffer against potential sanctions or supply disruptions.

          The copper market showed a notable shift in demand. Imports of unwrought copper and related products fell 6.4% to 5.3 million tons, the lowest level this decade, weighed down by high prices and a slowing economy. However, this was counterbalanced by a record-breaking surge in purchases of copper ore and concentrate, which climbed 7.9% to 30 million tons. This highlights China's expanding domestic smelting capacity, as the country increasingly prefers to import raw materials rather than finished metal.

          Iron Ore and Soybeans Hit All-Time Highs

          Despite weakness in the domestic steel market, iron ore imports rose for a third consecutive year, increasing 1.8% to an all-time high of 1.26 billion tons. However, stockpiles of iron ore have grown in recent months, and potential headwinds are emerging. Beijing's latest efforts to curb record steel exports in the face of rising global protectionism could dampen the market this year.

          Soybean imports also set a new record for the third year in a row, rising 6.5% to 112 million tons. Chinese crushers relied heavily on Brazilian shipments early in 2025 before increasing purchases from the United States following a trade agreement made with the Trump administration in October. Under the deal, Chinese buyers are committed to purchasing 25 million tons of U.S. soybeans annually through 2028. The future size and origin of China's soybean imports will largely depend on the endurance of this trade truce.

          Broader Trade and Market Context

          Overall, China's trade surplus climbed to $1.2 trillion in 2025, continuing a record-setting run as overseas shipments grew more strongly than expected toward the end of the year.

          Looking ahead, several factors could influence trade dynamics. China may propose easing restrictions on Canadian rapeseed products if Prime Minister Mark Carney's government relaxes tariffs on Chinese-made electric vehicles during an upcoming visit. In the energy markets, a forecast for frigid weather in Northeast China, coinciding with a cold spell in Europe, threatens to drive up prices for liquefied natural gas as competition among buyers intensifies.

          To stay updated on all economic events of today, please check out our Economic calendar
          Risk Warnings and Disclaimers
          You understand and acknowledge that there is a high degree of risk involved in trading. Following any strategies or investment methods may lead to potential losses. The content on the site is provided by our contributors and analysts for information purposes only. You are solely responsible for determining whether any trading assets, securities, strategy, or any other product is suitable for investing based on your own investment objectives and financial situation.
          Add to Favorites
          Share

          Trump Signals Escalation As Iran Protests Intensify And U.S. Weighs Next Moves

          Gerik

          Political

          Public Call For Continued Protests

          President Donald Trump openly encouraged Iranians to sustain and expand protests against the government of Supreme Leader Ayatollah Ali Khamenei. Speaking at a rally in Detroit, Trump called on demonstrators to keep protesting and, if possible, take over institutions, while urging activists to document those involved in suppressing the unrest. He warned that those responsible would “pay a very big price,” framing the protests as a defining challenge to Iran’s leadership.
          In remarks before boarding Air Force One, Trump said future U.S. action would depend on updated casualty figures, which he expected to receive following a National Security Council meeting chaired by Vice President JD Vance. Trump suggested decisions could be made rapidly once those numbers were confirmed, stating he would “act accordingly.” This messaging introduced uncertainty into diplomatic and security calculations, as it linked potential U.S. responses to evolving developments on the ground rather than a clearly defined policy threshold.

          Rising Death Toll And Human Rights Warnings

          According to the U.S.-based Human Rights Activists News Agency, at least 2,000 people have been killed during the unrest, marking the deadliest wave of protests in decades and the most serious threat to Khamenei’s rule since the Islamic Republic was established in 1979. The Oslo-based Iran Human Rights group warned that the risk of mass and extrajudicial executions was extremely serious, underscoring international concern over the scale and severity of the crackdown.
          Trump’s comments revived speculation about further U.S. military strikes. A White House official said earlier that Trump had been briefed on a range of options, including strikes on non-military sites. The region has been on heightened alert following recent U.S. actions, including the capture of Venezuelan President Nicolas Maduro less than two weeks ago and strikes on Iran’s nuclear facilities seven months earlier. Trump has also approved military operations in Somalia, Yemen, Syria, Nigeria, and the Caribbean Sea, reinforcing perceptions that force remains a readily available policy instrument.

          Defining Success Through Past Interventions

          In an interview with CBS News, Trump described his objective as winning and pointed to previous operations as benchmarks of success. He cited the killing of Islamic State leader Abu Bakr al-Baghdadi, Iranian military officer Qasem Soleimani, the Venezuela operation, and strikes on Iran’s nuclear infrastructure, which he said neutralized the threat in about 15 minutes. These references framed his Iran policy within a broader narrative of decisive action rather than prolonged negotiation.
          Alongside military rhetoric, Trump reiterated economic pressure, referencing his announcement that the U.S. would impose a 25% tariff on any country doing business with Iran. He also said he had canceled all meetings with Iranian officials until the killing of protesters stops, reversing earlier comments that Tehran had reached out to seek talks. The combination of sanctions threats and suspended diplomacy has reinforced uncertainty around the future of U.S.–Iran engagement.

          Technology And Information Access

          Elon Musk’s SpaceX began offering free Starlink satellite service in Iran amid an internet blackout imposed by Iranian authorities. The move mirrors similar actions taken during Russia’s invasion of Ukraine and after the recent U.S. operation in Venezuela. Expanded access to satellite internet may influence how information flows during the protests, though its broader impact remains uncertain.
          Iran’s unrest, initially sparked by a currency crisis and worsening economic conditions, has evolved into direct challenges to the regime itself. Trump described the country as fragile and invoked the slogan “make Iran great again,” portraying the protests as a historic moment. As political pressure, economic measures, and military signaling converge, the situation remains volatile, with markets and governments closely watching whether rhetoric translates into further action or remains a tool of pressure amid a rapidly changing crisis.

          Source: Bloomberg

          Risk Warnings and Disclaimers
          You understand and acknowledge that there is a high degree of risk involved in trading. Following any strategies or investment methods may lead to potential losses. The content on the site is provided by our contributors and analysts for information purposes only. You are solely responsible for determining whether any trading assets, securities, strategy, or any other product is suitable for investing based on your own investment objectives and financial situation.
          Add to Favorites
          Share
          FastBull
          Copyright © 2026 FastBull Ltd

          728 RM B 7/F GEE LOK IND BLDG NO 34 HUNG TO RD KWUN TONG KLN HONG KONG

          TelegramInstagramTwitterfacebooklinkedin
          App Store Google Play Google Play
          Products
          Charts

          Chats

          Q&A with Experts
          Screeners
          Economic Calendar
          Data
          Tools
          Membership
          Features
          Function
          Markets
          Copy Trading
          Latest Signals
          Contests
          News
          Analysis
          24/7
          Columns
          Education
          Company
          Careers
          About Us
          Contact Us
          Advertising
          Help Center
          Feedback
          User Agreement
          Privacy Policy
          Personal Information Protection Statement
          Business

          White Label

          Data API

          Web Plug-ins

          Poster Maker

          Affiliate Program

          Risk Disclosure

          The risk of loss in trading financial instruments such as stocks, FX, commodities, futures, bonds, ETFs and crypto can be substantial. You may sustain a total loss of the funds that you deposit with your broker. Therefore, you should carefully consider whether such trading is suitable for you in light of your circumstances and financial resources.

          No decision to invest should be made without thoroughly conducting due diligence by yourself or consulting with your financial advisors. Our web content might not suit you since we don't know your financial conditions and investment needs. Our financial information might have latency or contain inaccuracy, so you should be fully responsible for any of your trading and investment decisions. The company will not be responsible for your capital loss.

          Without getting permission from the website, you are not allowed to copy the website's graphics, texts, or trademarks. Intellectual property rights in the content or data incorporated into this website belong to its providers and exchange merchants.

          Not Logged In

          Log in to access more features

          FastBull Membership

          Not yet

          Purchase

          Become a signal provider
          Help Center
          Customer Service
          Dark Mode
          Price Up/Down Colors

          Log In

          Sign Up

          Position
          Layout
          Fullscreen
          Default to Chart
          The chart page opens by default when you visit fastbull.com