Markets
News
Analysis
User
24/7
Economic Calendar
Education
Data
- Names
- Latest
- Prev


Signal Accounts for Members
All Signal Accounts
All Contests


Stats Office - Swiss December Retail Sales +2.9% Year-On-Year Versus Revised +1.7% In Previous Month
Iran's Foreign Ministry Spokesperson Baghaei Says Tehran Is Examining Details Of Various Diplomatic Processes, Hopes For Results In Coming Days
FAA Head Says Concerned Other Countries Aren't Putting Enough Resources Into Certifying USA Aircraft
German Dec Retail Sales +1.5 Percent Year-On-Year (Versus Reuters Consensus Forecast For +1.1 Percent)
Russian Security Committee's Vice Chairman Medvedev: Russia Will Not Accept NATO-Member Forces In Ukraine
Russian Security Committee's Vice Chairman Medvedev: Nuclear Arms Control For Past 60 Years Helped Verify Intentions And Build Trust
Russian Security Committee's Vice Chairman Medvedev: The Territorial Issue In Ukraine Talks Is Most Complicated
Russian Security Committee's Vice Chairman Medvedev: If New Start Expires It Does Not Necessarily Mean A Catastrophe But It Should Alarm Everyone
Russian Security Committee's Vice Chairman Medvedev: Our Proposal To USA On Extending The Limits Of New Start Remains On The Table
Kazakhstan's Central Bank Says It Sold Foreign Currency Worth 350 Billion Tenge In January To Mirror Gold Purchases, Will Sell Foreign Currency Worth 350 Billion In February

U.S. Core PPI YoY (Dec)A:--
F: --
U.S. Core PPI MoM (SA) (Dec)A:--
F: --
P: --
U.S. PPI YoY (Dec)A:--
F: --
P: --
U.S. PPI MoM (SA) (Dec)A:--
F: --
P: --
Canada GDP MoM (SA) (Nov)A:--
F: --
P: --
Canada GDP YoY (Nov)A:--
F: --
P: --
U.S. PPI MoM Final (Excl. Food, Energy and Trade) (SA) (Dec)A:--
F: --
P: --
U.S. PPI YoY (Excl. Food, Energy & Trade) (Dec)A:--
F: --
P: --
U.S. Chicago PMI (Jan)A:--
F: --
Canada Federal Government Budget Balance (Nov)A:--
F: --
P: --
U.S. Weekly Total Oil Rig CountA:--
F: --
P: --
U.S. Weekly Total Rig CountA:--
F: --
P: --
China, Mainland NBS Manufacturing PMI (Jan)A:--
F: --
P: --
China, Mainland NBS Non-manufacturing PMI (Jan)A:--
F: --
P: --
China, Mainland Composite PMI (Jan)A:--
F: --
P: --
South Korea Trade Balance Prelim (Jan)A:--
F: --
Japan Manufacturing PMI Final (Jan)A:--
F: --
P: --
South Korea IHS Markit Manufacturing PMI (SA) (Jan)A:--
F: --
P: --
Indonesia IHS Markit Manufacturing PMI (Jan)A:--
F: --
P: --
China, Mainland Caixin Manufacturing PMI (SA) (Jan)A:--
F: --
P: --
Indonesia Trade Balance (Dec)A:--
F: --
P: --
Indonesia Inflation Rate YoY (Jan)A:--
F: --
P: --
Indonesia Core Inflation YoY (Jan)A:--
F: --
P: --
India HSBC Manufacturing PMI Final (Jan)A:--
F: --
P: --
Australia Commodity Price YoY (Jan)A:--
F: --
P: --
Russia IHS Markit Manufacturing PMI (Jan)A:--
F: --
P: --
Turkey Manufacturing PMI (Jan)A:--
F: --
P: --
U.K. Nationwide House Price Index MoM (Jan)A:--
F: --
P: --
U.K. Nationwide House Price Index YoY (Jan)A:--
F: --
P: --
Germany Actual Retail Sales MoM (Dec)A:--
F: --
Italy Manufacturing PMI (SA) (Jan)--
F: --
P: --
South Africa Manufacturing PMI (Jan)--
F: --
P: --
Euro Zone Manufacturing PMI Final (Jan)--
F: --
P: --
U.K. Manufacturing PMI Final (Jan)--
F: --
P: --
Brazil IHS Markit Manufacturing PMI (Jan)--
F: --
P: --
Canada National Economic Confidence Index--
F: --
P: --
Canada Manufacturing PMI (SA) (Jan)--
F: --
P: --
U.S. IHS Markit Manufacturing PMI Final (Jan)--
F: --
P: --
U.S. ISM Output Index (Jan)--
F: --
P: --
U.S. ISM Inventories Index (Jan)--
F: --
P: --
U.S. ISM Manufacturing Employment Index (Jan)--
F: --
P: --
U.S. ISM Manufacturing New Orders Index (Jan)--
F: --
P: --
U.S. ISM Manufacturing PMI (Jan)--
F: --
P: --
South Korea CPI YoY (Jan)--
F: --
P: --
Japan Monetary Base YoY (SA) (Jan)--
F: --
P: --
Australia Building Approval Total YoY (Dec)--
F: --
P: --
Australia Building Permits MoM (SA) (Dec)--
F: --
P: --
Australia Building Permits YoY (SA) (Dec)--
F: --
P: --
Australia Private Building Permits MoM (SA) (Dec)--
F: --
P: --
Australia Overnight (Borrowing) Key Rate--
F: --
P: --
RBA Rate Statement
Japan 10-Year Note Auction Yield--
F: --
P: --
Saudi Arabia IHS Markit Composite PMI (Jan)--
F: --
P: --
RBA Press Conference
Turkey PPI YoY (Jan)--
F: --
P: --
Turkey CPI YoY (Jan)--
F: --
P: --
Turkey CPI YoY (Excl. Energy, Food, Beverage, Tobacco & Gold) (Jan)--
F: --
P: --


No matching data
Latest Views
Latest Views
Trending Topics
Top Columnists
Latest Update
White Label
Data API
Web Plug-ins
Affiliate Program
View All

No data
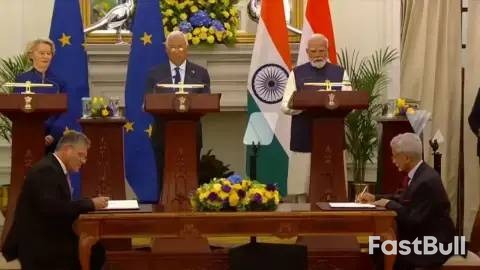
India and EU finalize a landmark FTA, poised to reshape global commerce and boost India's economy.
India and the European Union have finalized a long-awaited free trade agreement (FTA), a landmark deal that arrives at a critical moment for global commerce. As economies across Asia seek to diversify their export markets beyond the United States, this agreement provides significant momentum. The pact is being hailed as the "mother of all deals" for its sheer scale and its potential to reshape global trade alignments.

The deal underscores the EU's pragmatic approach to accommodating India's economic sensitivities—a flexibility that some argue has been missing in negotiations with the US. For India, this agreement is a milestone in its trade diversification strategy. Here’s a breakdown of what the FTA means for the country's economy.
Under the terms of the new agreement, India will gain preferential access to 97% of EU tariff lines, which covers an estimated 99.5% of its trade value. A significant portion of these goods will be eligible for immediate duty elimination, particularly benefiting labor-intensive sectors that contribute nearly 2% of India's GDP in exports.
The economic relationship is already robust. India maintains a net exporter status with the EU in both goods and services. Bilateral merchandise trade reached approximately $137 billion in fiscal year 2024–25, with India’s exports to the EU totaling $76 billion. The services trade is equally strong, hitting $83 billion in 2024.
The FTA offers India several clear advantages, from tariff elimination on goods to a major boost for its world-class services sector.
1. Pivoting Beyond the US Market
The EU is already India's second-largest export destination, accounting for 17% of its total exports, just behind the United States at 21%. The EU's share has grown by three percentage points since the pandemic. Since India's export mix to both markets is similar (with the exception of petroleum products having a larger share in EU exports), the new FTA allows India to strategically pivot toward the European market if high US tariffs persist. This move can effectively reduce its reliance on a single major trading partner without requiring a major overhaul of its export industries.
2. Boosting Jobs in Labor-Intensive Industries
The agreement will eliminate EU tariffs on a wide range of Indian products, including:
• Marine products (especially shrimp)
• Leather and footwear
• Textiles and garments
• Handicrafts
• Gems and jewellery
• Plastics and toys
These sectors are highly labor-intensive and represent areas where India competes directly with China, Bangladesh, and Vietnam. Having faced pressure from US tariffs in recent years, these industries now gain a meaningful advantage in the EU market, which can spur job creation in some of India’s largest employment sectors.
3. Strategic Access in Protected Sectors
While securing broad market access, India successfully protected its most sensitive domestic sectors, such as agriculture and dairy. At the same time, it agreed to reduce tariffs on other key goods like food, beverages, and automobiles. This balanced approach allows India to expand its export opportunities without compromising its core domestic industries.
4. Attracting More Foreign Direct Investment (FDI)
Deeper economic integration with the EU is expected to drive stronger foreign investment into India. The EU already accounts for about 15% of India's FDI inflows, led by the Netherlands, Germany, Belgium, and France. Historically, EU investment has concentrated in the services sector, particularly IT and software.
With India’s net FDI inflows softening recently, the FTA could revive investment momentum. This is especially true for manufacturing industries like automobiles, chemicals, and construction, which have previously lagged. Over time, increased FDI can fortify India's supply chains and strengthen its external financial balances.
5. Expanding India's Dominant Services Sector
The benefits of the FTA extend well beyond goods. India already exports services equivalent to about 1% of its GDP to the EU and maintains a surplus of around 0.2% of GDP. The new agreement includes "broader and deeper" commitments from the EU across 144 services subsectors.
This covers key areas where India is globally competitive, including:
• IT and Information Technology Enabled Services (ITeS)
• Professional services
• Education
• A wide range of business services
The deal creates a more stable and predictable policy environment for Indian service providers, while giving EU businesses and consumers better access to India's high-quality, cost-efficient service offerings.
Although the agreement marks a significant step, its formal signing is still several months away pending legal vetting. Its long-term success will ultimately depend on two critical factors.
First, India's manufacturing sector must meet the EU's stringent health, safety, and product standards. This may require substantial upgrades, especially for smaller manufacturers who may not be fully prepared to comply with these requirements.
Second, the ease of doing business remains a crucial factor. While India has made progress in liberalizing FDI, it continues to rank relatively high on the FDI Regulatory Restrictiveness Index. Further reforms to streamline approvals and regulatory processes will be necessary to fully unlock the potential benefits of this historic trade agreement.
China’s manufacturing sector showed unexpected signs of life in January, according to a private survey, offering a rare piece of good news for an economy facing considerable headwinds.
The RatingDog China manufacturing purchasing managers index (PMI) climbed to 50.3 in January, up from 50.1 in December. This reading surpassed the median forecast from a Bloomberg survey of economists, who had anticipated the gauge would fall to the 50.0 mark.
A PMI figure above 50 indicates expansion in the manufacturing sector, while a reading below 50 signals contraction.
The positive results from the private survey stand in contrast to the official government data released over the weekend. The official poll revealed that China's factory activity had unexpectedly worsened last month, following a brief recovery in December.
This divergence can often be explained by the different compositions of the surveys. The private RatingDog poll tends to focus more on smaller, export-oriented firms. In recent months, these results have generally been stronger than the official data, reflecting the resilience of China's export market.
This flicker of manufacturing strength comes as China's broader economy continues to lose momentum. Policymakers have shown little inclination to introduce major stimulus, as they remain focused on managing risks associated with local government debt.
There are also indications that Beijing may be recalibrating its growth expectations. President Xi Jinping has signaled a greater tolerance for slower growth in certain regions, and the government may lower its national economic growth target for the first time in four years.
In the previous year, China's gross domestic product grew by 5%, a figure largely propped up by record exports that helped offset cooling private consumption and a significant drop in investment.
Gold and silver prices extended their sharp sell-off on Monday, deepening the losses from last Friday’s rout. The decline follows a period of intense rallying that sent both metals to record highs, but a strengthening U.S. dollar and widespread profit-taking have since reversed that momentum.

Spot gold fell approximately 5% to trade at $4,617.07 per ounce. This follows a dramatic crash of nearly 10% on Friday, which saw prices fall below the $5,000 mark.
Silver also remained under heavy pressure after nosediving 30% last Friday. The metal, which had climbed on safe-haven demand, saw spot prices drop more than 4% to $80.63 per ounce.
According to analysts, the sudden reversal was triggered by a collision of market optimism over U.S. interest-rate cuts with a major leadership change at the Federal Reserve. President Donald Trump nominated former Fed Governor Kevin Warsh to succeed Jerome Powell as Chair when his term concludes in May.
Warsh is widely seen as an advocate for tighter monetary policy, and his nomination immediately bolstered the U.S. dollar.
"The 'Buy America' trade is back as a result, and the independence bid that drove gold and silver to nosebleed record heights right below $5,600 and $122 per ounce early Thursday morning is unraveling," noted José Torres, a senior economist at Interactive Brokers.
Adding to the pressure on precious metals, recent statements from Trump have suggested a potential deal with Iran, which has eased some geopolitical tensions in the market.
Despite the sharp downturn, some analysts see it as a natural market correction rather than a fundamental shift in the long-term trend for precious metals.
Christopher Forbes, head of Asia and the Middle East at CMC Markets, described gold's retreat as a "classic air-pocket after an extraordinary run." He attributes the sell-off to a combination of factors. "Profit-taking, a firmer dollar, and fresh geopolitical headlines from Washington have knocked froth off a crowded trade," Forbes said.
How a Strong Dollar Hits Precious Metals
The U.S. dollar's performance is a critical driver for gold prices. The dollar index, which tracks the greenback against other major currencies, has gained about 0.8% since Thursday.
• Pricing Power: Since gold is priced in U.S. dollars, a stronger dollar makes it more expensive for buyers using other currencies, which can dampen demand.
• Opportunity Cost: Higher interest rates, often associated with a hawkish Fed and a strong dollar, make interest-bearing assets like U.S. Treasurys more attractive. This raises the opportunity cost of holding gold, which pays no interest.
In the immediate future, Forbes expects gold prices to remain elevated but volatile as the market seeks more clarity on Warsh's potential policy direction at the Fed.
Even with the recent pullback, both metals are still showing strong year-to-date gains. Silver prices remain up around 15% since the start of the year, while gold is about 8% higher.
Looking ahead, the long-term bullish case for precious metals remains intact for some. "Renewed dollar weakness or confirmation of a dovish Warsh would bring dip-buyers back," said Forbes. He maintains a positive 12-month outlook, suggesting bullion could revisit its recent highs if the Federal Reserve continues its easing cycle amid uneven economic growth and inflation.
White Label
Data API
Web Plug-ins
Poster Maker
Affiliate Program
The risk of loss in trading financial instruments such as stocks, FX, commodities, futures, bonds, ETFs and crypto can be substantial. You may sustain a total loss of the funds that you deposit with your broker. Therefore, you should carefully consider whether such trading is suitable for you in light of your circumstances and financial resources.
No decision to invest should be made without thoroughly conducting due diligence by yourself or consulting with your financial advisors. Our web content might not suit you since we don't know your financial conditions and investment needs. Our financial information might have latency or contain inaccuracy, so you should be fully responsible for any of your trading and investment decisions. The company will not be responsible for your capital loss.
Without getting permission from the website, you are not allowed to copy the website's graphics, texts, or trademarks. Intellectual property rights in the content or data incorporated into this website belong to its providers and exchange merchants.
Not Logged In
Log in to access more features
Log In
Sign Up