- GBPUSD
- XAUUSD
- XAGUSD
- WTI
- USDX
Markets
Analysis
User
24/7
Economic Calendar
Education
Data
- Names
- Latest
- Prev


Signal Accounts for Members
All Signal Accounts
All Contests


Data Shows That India's Oil Imports From Russia In September Decreased By 13.7% Compared To August
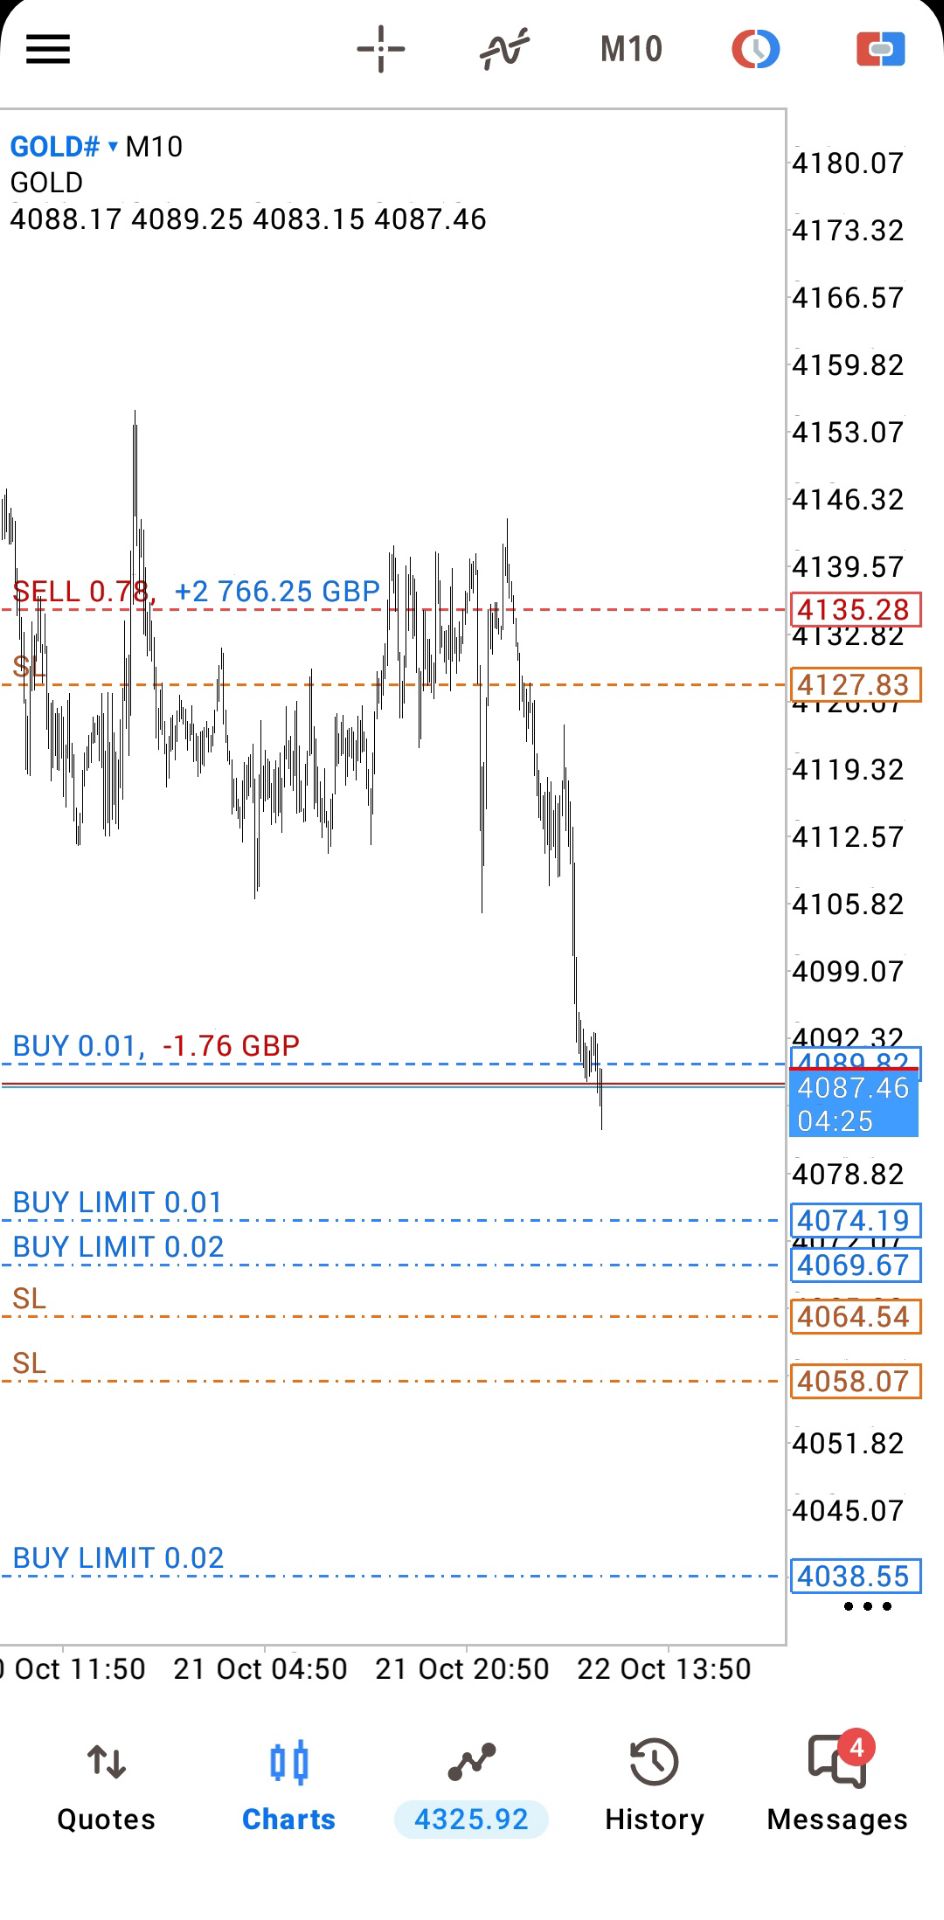
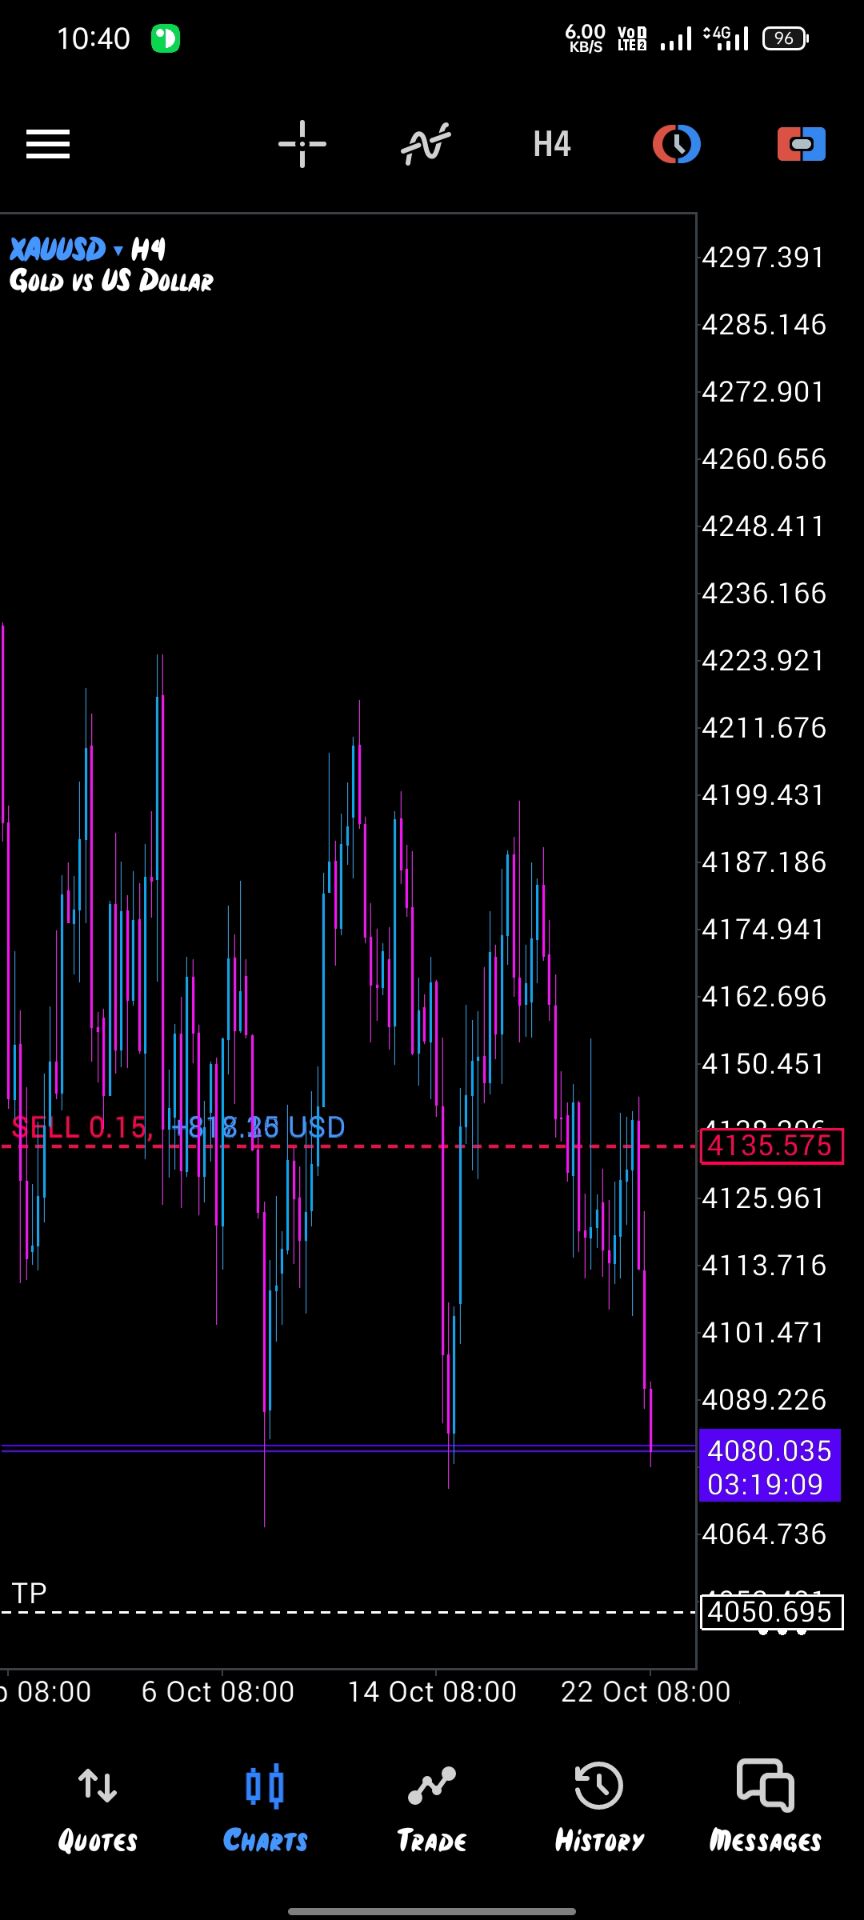
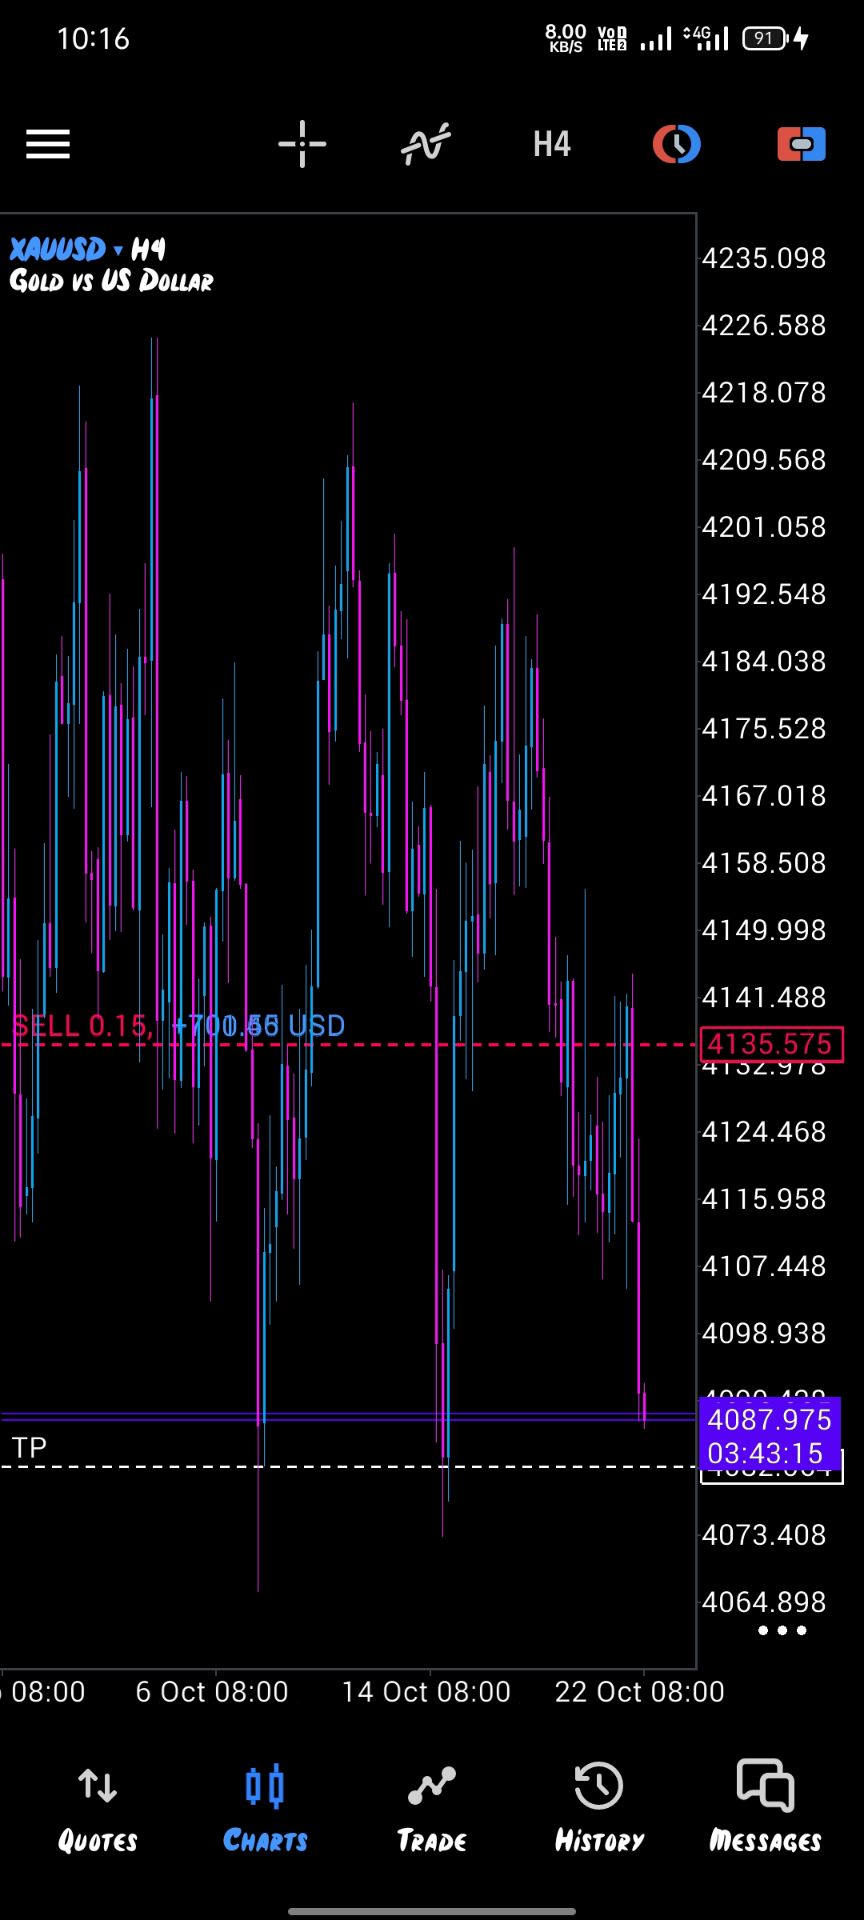
Spot Gold Fell Below $4,080 Per Ounce, Down 1.50% On The Day; Spot Silver Fell Below $56 Per Ounce, Down 3.40% On The Day
The Main Shanghai Tin Contract Fell By 2.00% During The Day, Currently Trading At 378,000.00 Yuan/ton
The Russian Ministry Of Defense Stated That Russia Launched A "massive Strike" Overnight Against Port Infrastructure And Vessels Used By The Ukrainian Army In The Odessa Region Of Ukraine
Following Talks With The US, And In Response To Russia's Attack On Kyiv, The Ukrainian Foreign Minister Stated That Appeasement, Groveling, And Flattery Cannot Prevent War
Nestlé: Due To Being Placed Under Temporary External Management, Its Business In The Russian Federation Will No Longer Be Included In Its Consolidated Financial Statements From The End Of September 2026
The Chinese Embassy In Saudi Arabia Advises Chinese Citizens To Refrain From Traveling To Saudi Arabia By Air For The Time Being
Brent Crude Oil Rose 1.00% On The Day, Currently Trading At $107.46 Per Barrel; WTI Crude Oil Rose Nearly 1%, Trading At $98.34 Per Barrel
Brent Crude Futures Rose $2.08 To $110.90 A Barrel, Pressured By Further Attacks On Saudi Arabia And Supply Concerns

U.K. Output PPI YoY (Not SA) (Sept)A:--
F: --
U.K. Output PPI MoM (Not SA) (Sept)A:--
F: --
P: --
U.K. Core CPI YoY (Sept)A:--
F: --
P: --
U.K. Core CPI MoM (Sept)A:--
F: --
P: --
U.K. Core Retail Prices Index YoY (Sept)A:--
F: --
P: --
U.K. Retail Prices Index YoY (Sept)A:--
F: --
P: --
U.K. CPI MoM (Sept)A:--
F: --
P: --
U.K. Retail Prices Index MoM (Sept)A:--
F: --
P: --
U.K. CPI YoY (Sept)A:--
F: --
P: --
Indonesia Deposit Facility Rate (Oct)A:--
F: --
P: --
Indonesia Lending Facility Rate (Oct)A:--
F: --
P: --
Indonesia Loan Growth YoY (Sept)A:--
F: --
P: --
Indonesia 7-Day Reverse Repo RateA:--
F: --
P: --
Turkey Capacity Utilization (Oct)A:--
F: --
P: --
South Africa Core CPI YoY (Sept)A:--
F: --
P: --
South Africa CPI YoY (Sept)A:--
F: --
P: --
U.S. MBA Mortgage Application Activity Index WoWA:--
F: --
P: --
South Africa Retail Sales YoY (Aug)A:--
F: --
P: --
Mexico Retail Sales MoM (Aug)A:--
F: --
P: --
BOE Gov Bailey Speaks
U.S. EIA Weekly Heating Oil Stock ChangesA:--
F: --
P: --
U.S. EIA Weekly Crude Oil Imports ChangesA:--
F: --
P: --
U.S. EIA Weekly Crude Stocks ChangeA:--
F: --
P: --
U.S. EIA Weekly Cushing, Oklahoma Crude Oil Stocks ChangeA:--
F: --
P: --
U.S. EIA Weekly Crude Demand Projected by ProductionA:--
F: --
P: --
U.S. EIA Weekly Gasoline Stocks ChangeA:--
F: --
P: --
Russia PPI MoM (Sept)A:--
F: --
P: --
Russia PPI YoY (Sept)A:--
F: --
P: --
ECB President Lagarde Speaks
South Korea Benchmark Interest RateA:--
F: --
P: --
Turkey Consumer Confidence Index (Oct)--
F: --
P: --
U.K. CBI Industrial Prices Expectations (Oct)--
F: --
P: --
U.K. CBI Industrial Trends - Orders (Oct)--
F: --
P: --
Turkey Late Liquidity Window Rate (LON) (Oct)--
F: --
P: --
Turkey Overnight Lending Rate (O/N) (Oct)--
F: --
P: --
Turkey 1-Week Repo Rate--
F: --
P: --
Mexico Unemployment Rate (Not SA) (Sept)--
F: --
P: --
Canada New Housing Price Index MoM (Sept)--
F: --
P: --
Canada Industrial Product Price Index YoY (Sept)--
F: --
P: --
Canada Industrial Product Price Index MoM (Sept)--
F: --
P: --
U.S. Weekly Initial Jobless Claims (SA)--
F: --
P: --
U.S. Initial Jobless Claims 4-Week Avg. (SA)--
F: --
P: --
U.S. Weekly Continued Jobless Claims (SA)--
F: --
P: --
BOE Gov Bailey Speaks
U.S. Conference Board Coincident Economic Index MoM (Sept)--
F: --
P: --
U.S. Conference Board Lagging Economic Index MoM (Sept)--
F: --
P: --
U.S. Conference Board Leading Economic Index (Sept)--
F: --
P: --
Euro Zone Consumer Confidence Index Prelim (Oct)--
F: --
P: --
U.S. Conference Board Leading Economic Index MoM (Sept)--
F: --
P: --
U.S. EIA Weekly Natural Gas Stocks Change--
F: --
P: --
U.S. Kansas Fed Manufacturing Production Index (Oct)--
F: --
P: --
U.S. Kansas Fed Manufacturing Composite Index (Oct)--
F: --
P: --
Argentina Retail Sales YoY (Aug)--
F: --
P: --
U.S. Weekly Treasuries Held by Foreign Central Banks--
F: --
P: --
Australia Composite PMI Prelim (Oct)--
F: --
P: --
Australia Manufacturing PMI Prelim (Oct)--
F: --
P: --
U.K. GfK Consumer Confidence Index (Oct)--
F: --
P: --
Japan National Core CPI YoY (Sept)--
F: --
P: --
Japan National CPI YoY (Sept)--
F: --
P: --
Japan National CPI MoM (Not SA) (Sept)--
F: --
P: --
Japan National CPI MoM (Sept)--
F: --
P: --


No matching data
Copper's 9% price drop signals a market correction, with speculative highs yielding to weak fundamentals.
A nearly 9% drop in copper prices over the last two trading sessions marks a sharp return to reality for a market that analysts say had surged far ahead of its underlying fundamentals.
The recent rally, which pushed copper to a record high of $14,527.50 per metric ton last Thursday, appears unsustainable when measured against weak demand, rising stockpiles, and the prospect of increased supply.
Analysts argue that the recent price action was driven more by speculative momentum than by market realities. "Prices had moved way beyond fundamentals, pushed up by investors crowding into the market," said Macquarie analyst Alice Fox, who noted the global market was in a surplus of around 600,000 tons last year.
According to Fox, copper prices remain too high and would need to fall below $11,000 a ton to accurately reflect the current supply-and-demand balance. Even at last week's peak, prices were well above the levels considered necessary to incentivize new production investments.
The correction began swiftly. On Monday, copper hit a three-week low of $12,414.50, tumbling 9% from its recent peak. The slide was partly triggered by a stronger U.S. dollar, which gained after President Donald Trump appointed Kevin Warsh as the next Federal Reserve chair.
The broader economic picture also fails to support the case for bullish copper prices. Tariffs and trade tensions under the Trump administration have pressured global manufacturing activity over the past year. While factory output in some regions expanded in January, the growth came from a low base after months of contraction, offering only tentative reassurance.
Further weighing on demand is China's upcoming Lunar New Year holiday in mid-February. The event will bring industrial activity to a standstill in the country, which consumes over half of the world's copper, estimated at 26 million tons this year.
While much of last year's price gains were fueled by supply disruptions from accidents in Indonesia and Chile, the supply landscape is changing. Production ramp-ups at mines in Zambia and Mongolia are expected to bring more copper to the market this year.
This outlook is echoed by StoneX analyst Natalie Scott-Gray. "While we forecast copper in a deeper deficit market year on year, we still do not see the market as historically out of balance," she said. Scott-Gray added that while supply risks exist, "fundamentals certainly do not support copper at current levels."
The most telling sign of weak demand is the dramatic increase in stockpiles. Inventories in warehouses registered with the London Metal Exchange (LME), Shanghai Futures Exchange (SHFE), and Comex have more than doubled since August, now totaling over 930,000 tons. This glut of metal suggests that consumption is not keeping pace with availability, signaling the potential for further price declines.
The risk of loss in trading financial instruments such as stocks, FX, commodities, futures, bonds, ETFs and crypto can be substantial. You may sustain a total loss of the funds that you deposit with your broker. Therefore, you should carefully consider whether such trading is suitable for you in light of your circumstances and financial resources.
No decision to invest should be made without thoroughly conducting due diligence by yourself or consulting with your financial advisors. Our web content might not suit you since we don't know your financial conditions and investment needs. Our financial information might have latency or contain inaccuracy, so you should be fully responsible for any of your trading and investment decisions. The company will not be responsible for your capital loss.
Without getting permission from the website, you are not allowed to copy the website's graphics, texts, or trademarks. Intellectual property rights in the content or data incorporated into this website belong to its providers and exchange merchants.
Not Logged In
Log in to access more features
Log In
Sign Up