• Trade
  • Markets
  • Copy
  • Contests
  • 24/7
  • Calendar
  • Q&A
  • Chats
Screeners
SYMBOL
LAST
BID
ASK
HIGH
LOW
NET CHG.
%CHG.
SPREAD
SPX
S&P 500 Index
7108.41
7108.41
7108.41
7147.78
7046.54
-29.49
-0.41%
--
DJI
Dow Jones Industrial Average
49310.31
49310.31
49310.31
49522.94
48861.31
-179.71
-0.36%
--
IXIC
NASDAQ Composite Index
24438.49
24438.49
24438.49
24664.87
24209.74
-219.06
-0.89%
--
USDX
US Dollar Index
98.680
98.680
98.760
98.680
98.570
+0.050
+ 0.05%
--
EURUSD
Euro / US Dollar
1.16767
1.16767
1.16774
1.16889
1.16767
-0.00055
-0.05%
--
GBPUSD
Pound Sterling / US Dollar
1.34580
1.34580
1.34589
1.34727
1.34580
-0.00075
-0.06%
--
XAUUSD
Gold / US Dollar
4673.30
4673.30
4673.68
4710.96
4673.08
-20.89
-0.45%
--
WTI
Light Sweet Crude Oil
94.976
94.976
95.011
95.935
94.676
-0.641
-0.67%
--

Community Accounts

Signal Accounts
--
Profit Accounts
--
Loss Accounts
--
View More

Become a signal provider

Sell trading signals to earn additional income

View More

Guide to Copy Trading

Get started with ease and confidence

View More

Signal Accounts for Members

All Signal Accounts

Best Return
  • Best Return
  • Best P/L
  • Best MDD
Past 1W
  • Past 1W
  • Past 1M
  • Past 1Y

All Contests

  • All
  • Trump Updates
  • Recommend
  • Stocks
  • Cryptocurrencies
  • Central Banks
  • Featured News
Top News Only
Share

Former U.S. Ambassador To Bahrain: Iran's Resilience May Outlast Trump; U.S. Domestic Politics Is A Major Variable

Share

Wildfires In Iwate Prefecture, Japan, Have Burned Over 1,100 Hectares

Share

White House: Trump To Speak At A Cryptocurrency Conference In Florida On Saturday

Share

Setting A New Record For The Same Period: Yiwu's Foreign Trade Imports And Exports Surpass RMB 200 Billion In The First Quarter Of This Year

Share

Spot Gold Fluctuated Downwards, Touching $4,680 Per Ounce, Down 0.28% On The Day

Share

Hong Kong-listed Chip Stocks Surged, With Naxin Microelectronics Rising Over 13%, Hua Hong Semiconductor Rising Over 7%, And SMIC Rising Over 5%

Share

Brent Crude Oil Fell More Than 1.00% On The Day, Currently Trading At $100.10 Per Barrel

Share

The Philippine Presidential Palace Announced That Marcos Will Meet With The Japanese Prime Minister To Discuss A Strategic Partnership

Share

The Philippine Presidential Palace Announced That Marcos Will Pay A State Visit To Japan From May 26 To 29

Share

Iran Conflict Continues; U.S. Oil Executives Expect Domestic Crude Production To Rise

Share

Iranian Ambassador To Russia: The United States Is Not Taking Iran-U.S. Talks Seriously

Share

The ChiNext Index Fell By 2% During The Day

Share

U.S. Offers $10 Million Reward For Information On Leader Of Iran-Backed Iraqi Militia

Share

Hong Kong Stocks See Widening Declines, With The Hang Seng Index Down 1% And The Tech Index Down 1.8%; Among The Constituents Of The Tech Index, Nio Falls By More Than 5%, Li Auto By More Than 4%, Bilibili By Nearly 3%, And Kuaishou, Alibaba, And Baidu By More Than 2%

Share

PLS, An Australian Mining And Exploration Company: We Are Seeing Lithium Demand Deepen And Expand

Share

The Hang Seng Index Fell Further To 1%, While The Hang Seng Tech Index Is Currently Down 1.79%

Share

U.S. Dollar Poised For First Weekly Gain In Three Weeks

Share

The Shenzhen Component Index Fell By 1%, The Shanghai Composite Index Fell By 0.7%, And The ChiNext Index Fell By 1.36%

Share

The Main Polysilicon Futures Contract Fell By More Than 8.00% Intraday, Currently Trading At 41,060 Yuan/ton

Share

Goldman Sachs: Most Of The Gulf's Oil Production Will Resume Within Months After The Strait Reopens

TIME
ACT
FCST
PREV
Canada New Housing Price Index MoM (Mar)

A:--

F: --

P: --

U.S. EIA Weekly Crude Stocks Change

A:--

F: --

P: --

U.S. EIA Weekly Cushing, Oklahoma Crude Oil Stocks Change

A:--

F: --

P: --

U.S. EIA Weekly Crude Demand Projected by Production

A:--

F: --

P: --

U.S. EIA Weekly Gasoline Stocks Change

A:--

F: --

P: --

U.S. EIA Weekly Crude Oil Imports Changes

A:--

F: --

P: --

U.S. EIA Weekly Heating Oil Stock Changes

A:--

F: --

P: --

Russia PPI YoY (Mar)

A:--

F: --

P: --

Russia PPI MoM (Mar)

A:--

F: --

P: --

ECB President Lagarde Speaks
Tesla released its earnings report after the US stock market closed.
U.K. CBI Industrial Trends - Orders (Apr)

A:--

F: --

P: --

U.K. CBI Industrial Prices Expectations (Apr)

A:--

F: --

P: --

Mexico Retail Sales MoM (Feb)

A:--

F: --

P: --

U.S. Chicago Fed National Activity Index (Mar)

A:--

F: --

P: --
U.S. Weekly Initial Jobless Claims (SA)

A:--

F: --

P: --
U.S. Initial Jobless Claims 4-Week Avg. (SA)

A:--

F: --

P: --
U.S. Weekly Continued Jobless Claims (SA)

A:--

F: --

P: --
Canada Industrial Product Price Index MoM (Mar)

A:--

F: --

P: --
Canada Industrial Product Price Index YoY (Mar)

A:--

F: --

P: --
U.S. EIA Weekly Natural Gas Stocks Change

A:--

F: --

P: --

U.S. Kansas Fed Manufacturing Production Index (Apr)

A:--

F: --

P: --

U.S. Kansas Fed Manufacturing Composite Index (Apr)

A:--

F: --

P: --

Argentina Retail Sales YoY (Feb)

A:--

F: --

P: --

U.S. Weekly Treasuries Held by Foreign Central Banks

A:--

F: --

P: --

Japan National CPI MoM (Mar)

A:--

F: --

P: --

Japan National Core CPI YoY (Mar)

A:--

F: --

P: --

Japan National CPI MoM (Not SA) (Mar)

A:--

F: --

P: --

Japan CPI MoM (Mar)

A:--

F: --

P: --

Japan National CPI YoY (Mar)

A:--

F: --

P: --

U.K. Retail Sales MoM (SA) (Mar)

--

F: --

P: --

U.K. Retail Sales YoY (SA) (Mar)

--

F: --

P: --

U.K. Core Retail Sales YoY (SA) (Mar)

--

F: --

P: --

Germany Ifo Business Expectations Index (SA) (Apr)

--

F: --

P: --

Germany IFO Business Climate Index (SA) (Apr)

--

F: --

P: --

Germany Ifo Current Business Situation Index (SA) (Apr)

--

F: --

P: --

Russia Key Rate

--

F: --

P: --

Brazil Current Account (Mar)

--

F: --

P: --

Mexico Economic Activity Index YoY (Feb)

--

F: --

P: --

Mexico Unemployment Rate (Not SA) (Mar)

--

F: --

P: --

Canada Retail Sales MoM (SA) (Feb)

--

F: --

P: --

Canada Core Retail Sales MoM (SA) (Feb)

--

F: --

P: --

Canada Federal Government Budget Balance (Feb)

--

F: --

P: --

U.S. Weekly Total Rig Count

--

F: --

P: --

U.S. Weekly Total Oil Rig Count

--

F: --

P: --

China, Mainland Industrial Profit YoY (YTD) (Mar)

--

F: --

P: --

Germany GfK Consumer Confidence Index (SA) (May)

--

F: --

P: --

U.K. CBI Distributive Trades (Apr)

--

F: --

P: --

U.K. CBI Retail Sales Expectations Index (Apr)

--

F: --

P: --

Mexico Trade Balance (Mar)

--

F: --

P: --

Canada National Economic Confidence Index

--

F: --

P: --

U.S. Dallas Fed General Business Activity Index (Apr)

--

F: --

P: --

U.S. Dallas Fed New Orders Index (Apr)

--

F: --

P: --

U.S. 5-Year Note Auction Avg. Yield

--

F: --

P: --

U.S. 2-Year Note Auction Avg. Yield

--

F: --

P: --

U.K. BRC Shop Price Index YoY (Apr)

--

F: --

P: --

Japan Unemployment Rate (Mar)

--

F: --

P: --

Japan Jobs to Applicants Ratio (Mar)

--

F: --

P: --

Japan Benchmark Interest Rate

--

F: --

P: --

BOJ Monetary Policy Statement
BOJ Press Conference
Q&A with Experts
    • All
    • Chatrooms
    • Groups
    • Friends
    Sanjeev Ku flag
    Sanjeev Ku
    @EuroTrader lets's see bro 4652/4612/4560 are my tgts below 4725
    no confusion for me already short
    RPGFX flag
    fred
    BUY GOLD NOW
    @fred Noted, you bought at CMP of 4685, take note of that, let's wait for 35-45 minutes holding time like you taught us yesterday
    RPGFX flag
    Sanjeev Ku
    no confusion for me already short
    @Sanjeev Ku Maybe he is betting on a retracement, remember he will hold for only 35-45 minutes
    fred flag
    fred flag
    buy gold now
    RPGFX flag
    srinivas
    @Shreshth B why a trade is lost? it is lost if you don't have enough money.let us say you have 1 million dollars and you are trading in 0.01 of gold, will you lose? you wont. So my idea of a structure is trigggering of SL. Once Sl gets triggered, you can trade, to me there are more sellers, so they will be wiped out first. so my focus is only on buy.
    @srinivas If you have 1 million US dollars and you trade with 0.01, there will be no need for SL, just be buying assets like gold and Bitcoin, you will never loose 😂😂
    fred flag
    RPGFX
    @fred Noted, you bought at CMP of 4685, take note of that, let's wait for 35-45 minutes holding time like you taught us yesterday
    @RPGFXis your choise to close it at any time you want
    srinivas flag
    RPGFX
    @srinivas If you have 1 million US dollars and you trade with 0.01, there will be no need for SL, just be buying assets like gold and Bitcoin, you will never loose 😂😂
    @RPGFX thats the point, why you lose? you lose because you are dumb? no. you lose as you dont have money
    RPGFX flag
    fred
    @fred Okay, you even entered at a lower price of 4683, good luck 🤞
    RPGFX flag
    fred
    @RPGFXis your choise to close it at any time you want
    @fred So in essence your timing stuff does not matter in closing of trades?
    RPGFX flag
    srinivas
    @RPGFX thats the point, why you lose? you lose because you are dumb? no. you lose as you dont have money
    @srinivasBut at the same time, for someone who has over a million dollars for trading, the profits from trading with 0.01 will be insignificant to such a personality
    srinivas flag
    RPGFX
    @srinivasBut at the same time, for someone who has over a million dollars for trading, the profits from trading with 0.01 will be insignificant to such a personality
    @RPGFX i think you dont understand what i am trying to tell you here, it is about risk assessment and risk management.
    Sanjeev Ku flag
    RPGFX
    @Sanjeev Ku Maybe he is betting on a retracement, remember he will hold for only 35-45 minutes
    @RPGFX ok bro and I will hold my shorts for my tgts no matter how long it takes today time no issue
    3834405 flag
    srinivas
    @RPGFX i think you dont understand what i am trying to tell you here, it is about risk assessment and risk management.
    @srinivasThis means using a large position to buy in small batches; as long as the funds exceed the value of the asset, liquidation will not occur.
    Sanjeev Ku flag
    Sanjeev Ku
    @EuroTrader   bro next session 4725 level to watch .if keeps trading below it blind sell for me or if opens below 4720 with SL 4725 will go blind sell . no waiting for this time or that time
    below 4725 gold was blind sell for me today
    Sanjeev Ku flag
    fred
    buy gold now
    @fred hello bro any sl
    风神1号 flag
    4663
    风神1号 flag
    等入场
    srinivas flag
    3834405
    @srinivasThis means using a large position to buy in small batches; as long as the funds exceed the value of the asset, liquidation will not occur.
    @3834405 yes..that is the basis of trading. everything else is hallucination.
    4084422 flag
    风神1号
    等入场
    @风神1号buy?
    Type here...
    Add Symbol or Code

      No matching data

      All
      Trump Updates
      Recommend
      Stocks
      Cryptocurrencies
      Central Banks
      Featured News
      • All
      • Russia-Ukraine Conflict
      • Middle East Flashpoint
      • All
      • Russia-Ukraine Conflict
      • Middle East Flashpoint

      Search
      Products

      Charts Free Forever

      Chats Q&A with Experts
      Screeners Economic Calendar Data Tools
      Membership Features
      Data Warehouse Market Trends Institutional Data Policy Rates Macro

      Market Trends

      Market Sentiment Order Book Forex Correlations

      Top Indicators

      Charts Free Forever
      Markets

      News

      24/7 Analysis Education

      Latest Views

      Latest Update

      Signals

      Copy Rankings Latest Signals Become a signal provider AI Rating
      Contests
      Brokers

      Overview Brokers Assessment Rankings Regulators News Claims
      Broker listing Forex Brokers Comparison Tool Live Spread Comparison Scam
      Q&A Complaint Scam Alert Videos Tips to Detect Scam
      More

      Business
      Events
      Careers About Us Advertising Help Center

      White Label

      Broker API

      Data API

      Web Plug-ins

      Affiliate Program

      Awards Institution Evaluation IB Seminar Salon Event Exhibition
      Vietnam Thailand Singapore Dubai
      Fans Party Investment Sharing Session
      FastBull Summit BrokersView Expo
      Recent Searches
        Top Searches
          Markets
          Analysis
          User
          24/7
          Economic Calendar
          Education
          Data
          • Names
          • Latest
          • Prev

          View All

          No data

          Scan to Download

          Faster Charts, Chat Faster!

          Download App
          English
          • English
          • Español
          • العربية
          • Bahasa Indonesia
          • Bahasa Melayu
          • Tiếng Việt
          • ภาษาไทย
          • Français
          • Italiano
          • Türkçe
          • Русский язык
          • 简中
          • 繁中
          Open Account
          Search
          Products
          Charts Free Forever
          Markets
          News
          Signals

          Copy Rankings Latest Signals Become a signal provider AI Rating
          Contests
          Brokers

          Overview Brokers Assessment Rankings Regulators News Claims
          Broker listing Forex Brokers Comparison Tool Live Spread Comparison Scam
          Q&A Complaint Scam Alert Videos Tips to Detect Scam
          More

          Business
          Events
          Careers About Us Advertising Help Center

          White Label

          Broker API

          Data API

          Web Plug-ins

          Affiliate Program

          Awards Institution Evaluation IB Seminar Salon Event Exhibition
          Vietnam Thailand Singapore Dubai
          Fans Party Investment Sharing Session
          FastBull Summit BrokersView Expo

          WTI In Focus With US-Iran Talks Cancelled – US Oil Outlook

          MarketPulse by OANDA Group

          Forex

          Commodity

          Summary:

          Oil rallies to $65 from the latest new: Iran-US talks cancelled.

          · Oil rallies to $65 from the latest new: Iran-US talks cancelled.
          · WTI lost some ground after talks were announced but tensions are coming back.
          · Exploring an in-depth Technical Analysis of the commodity.

          WTI Oil is facing renewed volatility following the latest geopolitical developments:

          US–Iran talks scheduled for Friday in Turkey have been cancelled.

          Disagreements had emerged between Iranian and US demands. Washington continued to insist on Iran abandoning its ballistic missile program, while Tehran only signaled openness on the nuclear issue.

          Markets had initially rallied on the prospect of talks, while oil shed much of its geopolitical premium after the weekend break, gapping lower from $66.00 to $61.50.

          But in the current environment, it was unlikely to remain that simple for long.

          Iranian officials have reiterated that they remain open to discussions, yet the US now appears to be weighing its options, including preparations for potential intervention.

          The core debate centers on whether an intervention could realistically lead to regime change and how escalation might be avoided to prevent a prolonged conflict.

          Since the cancellation headline, WTI has jumped back toward $65 and is holding near its relative highs as traders brace for a possible worsening of the conflict.

          Odds for a US strike in Iran – Source: Polymarket. February 4, 2026

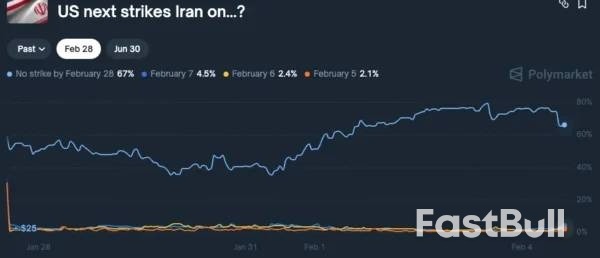
          Polymarket-based odds for a strike before February 28 are just below 30%.

          Let's dive into a bottom-up multi-timeframe analysis of WTI (US) Oil to determine whether technicals point to continued upside or if we are reaching a maximum.

          We will commence with intraday charts to explore the latest action and see how it develops to Daily charts.

          US Oil Bottom-Up Multi-Timeframe Analysis

          1H Chart

          WTI Oil 1H Chart – February 4, 2026. Source: TradingView

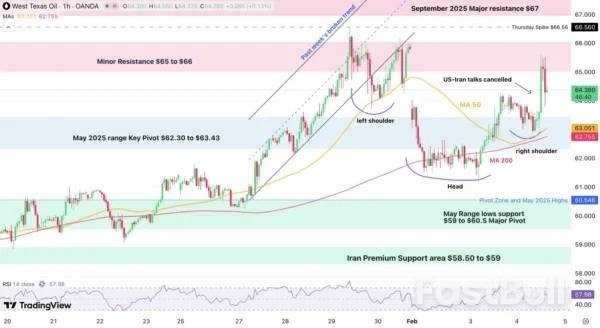
          Oil just bounced higher by 3% on the headlines but got rejected right in the middle of its $65 to $66 Key resistance.

          Despite the rejection, bears aren't for now able to bring back the commodity to the pre-headline levels so the current pullback just looks like profit-taking.

          Some warning signs are arising however with the formation of an inverted Head & Shoulders pattern which could hint to $70 in WTI (see more on the 4H chart just below)

          As long as the tensions don't aggravate, expect a $63 to $66 range.

          Any close above $66 will be accompanied with some war headlines (particularly if the past week's $66.56 highs break).

          WTI 4H Chart and Technical Levels

          WTI Oil 4H Chart – February 4, 2026. Source: TradingView

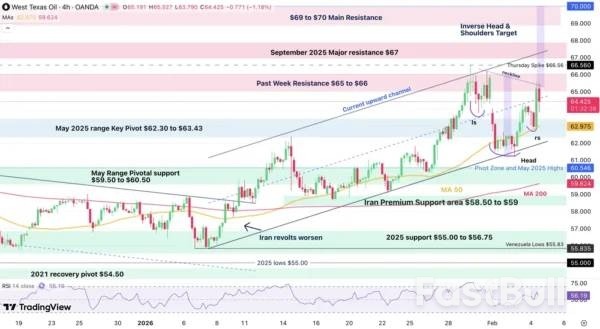
          It is difficult to discern momentum in Oil when up and down spikes are so common.

          Two things are clear from that timeframe:

          · WTI bulls are following closely the 4H 50-period MA to push prices higher
          · The action is holding within an upward channel, but any news could lead to an upside breakout

          The measured move target from the inverted Head & shoulders is shown in purple.

          WTI Technical Levels

          Levels to place on your WTI charts:

          Resistance Levels

          · Past week Spike $66.56
          · Minor Resistance $65 to $66 (daily highs $65.55)
          · September 2025 Major resistance $67 (could get breached if US attacks)
          · Psychological Resistance $70 and Inverted H&S target
          · $78.43 12-Day War highs

          Support Levels

          · $64.00 Key psychological support
          · $63.00 4H-50 MA
          · May 2025 range Key Pivot $62.30 to $63.43
          · May Range lows support $59 to $60.5 Major support
          · Iran Premium Support area $58.50 to $59

          WTI Daily Chart

          WTI Oil Daily Chart – February 4, 2026. Source: TradingView

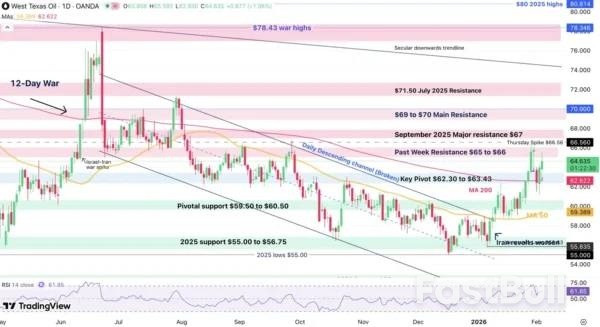
          Now trading well above its 200-Day Moving Average, Oil is turning increasingly bullish.

          Fundamental factors over greener energy are still weighing on the long-run trajectory for the commodity, but geopolitical factors say otherwise.

          Trader are pushing the commodity towards the 50% retracement of the 12-Day War from June 2025.

          Any close above $66.60 would look at high-paced continuation. This would of course be contingent on tensions remaining elevated.

          Source: MarketPulse by OANDA Group

          Risk Warnings and Disclaimers
          You understand and acknowledge that there is a high degree of risk involved in trading. Following any strategies or investment methods may lead to potential losses. The content on the site is provided by our contributors and analysts for information purposes only. You are solely responsible for determining whether any trading assets, securities, strategy, or any other product is suitable for investing based on your own investment objectives and financial situation.
          Add to Favorites
          Share
          FastBull
          Copyright © 2026 FastBull Ltd

          728 RM B 7/F GEE LOK IND BLDG NO 34 HUNG TO RD KWUN TONG KLN HONG KONG

          TelegramInstagramTwitterfacebooklinkedin
          App Store Google Play Google Play
          Products
          Charts

          Chats

          Q&A with Experts
          Screeners
          Economic Calendar
          Data
          Tools
          Membership
          Features
          Function
          Markets
          Copy Trading
          Latest Signals
          Contests
          24/7
          Analysis
          Education
          Company
          Careers
          About Us
          Contact Us
          Advertising
          Help Center
          Feedback
          User Agreement
          Privacy Policy
          Personal Information Protection Statement
          Business

          White Label

          Broker API

          Data API

          Web Plug-ins

          Poster Maker

          Affiliate Program

          Risk Disclosure

          The risk of loss in trading financial instruments such as stocks, FX, commodities, futures, bonds, ETFs and crypto can be substantial. You may sustain a total loss of the funds that you deposit with your broker. Therefore, you should carefully consider whether such trading is suitable for you in light of your circumstances and financial resources.

          No decision to invest should be made without thoroughly conducting due diligence by yourself or consulting with your financial advisors. Our web content might not suit you since we don't know your financial conditions and investment needs. Our financial information might have latency or contain inaccuracy, so you should be fully responsible for any of your trading and investment decisions. The company will not be responsible for your capital loss.

          Without getting permission from the website, you are not allowed to copy the website's graphics, texts, or trademarks. Intellectual property rights in the content or data incorporated into this website belong to its providers and exchange merchants.

          Not Logged In

          Log in to access more features

          Connect Broker
          Become a signal provider
          Help Center
          Customer Service
          Dark Mode
          Price Up/Down Colors

          Log In

          Sign Up

          Position
          Layout
          Fullscreen
          Default to Chart
          The chart page opens by default when you visit fastbull.com