

Markets
News
Analysis
User
24/7
Economic Calendar
Education
Data
- Names
- Latest
- Prev


Signal Accounts for Members
All Signal Accounts
All Contests
 France 10-Year OAT Auction Avg. Yield
A:--
F: --
P: --
 Euro Zone Retail Sales YoY (Oct)
A:--
F: --
P: --
 Brazil GDP YoY (Q3)
A:--
F: --
P: --
 U.S. Challenger Job Cuts (Nov)
A:--
F: --
P: --
U.S. Challenger Job Cuts MoM (Nov)A:--
F: --
P: --
U.S. Challenger Job Cuts YoY (Nov)A:--
F: --
P: --
U.S. Initial Jobless Claims 4-Week Avg. (SA)A:--
F: --
P: --
U.S. Weekly Initial Jobless Claims (SA)A:--
F: --
P: --
U.S. Weekly Continued Jobless Claims (SA)A:--
F: --
P: --
 Canada Ivey PMI (SA) (Nov)
A:--
F: --
P: --
Canada Ivey PMI (Not SA) (Nov)A:--
F: --
P: --
U.S. Non-Defense Capital Durable Goods Orders Revised MoM (Excl. Aircraft) (SA) (Sept)A:--
F: --
U.S. Factory Orders MoM (Excl. Transport) (Sept)A:--
F: --
P: --
U.S. Factory Orders MoM (Sept)A:--
F: --
P: --
U.S. Factory Orders MoM (Excl. Defense) (Sept)A:--
F: --
P: --
U.S. EIA Weekly Natural Gas Stocks ChangeA:--
F: --
P: --
Saudi Arabia Crude Oil ProductionA:--
F: --
P: --
U.S. Weekly Treasuries Held by Foreign Central BanksA:--
F: --
P: --
 Japan Foreign Exchange Reserves (Nov)
A:--
F: --
P: --
 India Repo Rate
A:--
F: --
P: --
India Benchmark Interest RateA:--
F: --
P: --
India Reverse Repo RateA:--
F: --
P: --
India Cash Reserve RatioA:--
F: --
P: --
Japan Leading Indicators Prelim (Oct)A:--
F: --
P: --
 U.K. Halifax House Price Index YoY (SA) (Nov)
A:--
F: --
P: --
U.K. Halifax House Price Index MoM (SA) (Nov)A:--
F: --
P: --
France Current Account (Not SA) (Oct)A:--
F: --
P: --
France Trade Balance (SA) (Oct)A:--
F: --
P: --
France Industrial Output MoM (SA) (Oct)A:--
F: --
P: --
 Italy Retail Sales MoM (SA) (Oct)
A:--
F: --
P: --
Euro Zone Employment YoY (SA) (Q3)--
F: --
P: --
Euro Zone GDP Final YoY (Q3)--
F: --
P: --
Euro Zone GDP Final QoQ (Q3)--
F: --
P: --
Euro Zone Employment Final QoQ (SA) (Q3)--
F: --
P: --
Euro Zone Employment Final (SA) (Q3)--
F: --
Brazil PPI MoM (Oct)--
F: --
P: --
 Mexico Consumer Confidence Index (Nov)
--
F: --
P: --
Canada Unemployment Rate (SA) (Nov)--
F: --
P: --
Canada Labor Force Participation Rate (SA) (Nov)--
F: --
P: --
Canada Employment (SA) (Nov)--
F: --
P: --
Canada Part-Time Employment (SA) (Nov)--
F: --
P: --
Canada Full-time Employment (SA) (Nov)--
F: --
P: --
U.S. Personal Income MoM (Sept)--
F: --
P: --
U.S. Dallas Fed PCE Price Index YoY (Sept)--
F: --
P: --
U.S. PCE Price Index YoY (SA) (Sept)--
F: --
P: --
U.S. PCE Price Index MoM (Sept)--
F: --
P: --
U.S. Personal Outlays MoM (SA) (Sept)--
F: --
P: --
U.S. Core PCE Price Index MoM (Sept)--
F: --
P: --
U.S. UMich 5-Year-Ahead Inflation Expectations Prelim YoY (Dec)--
F: --
P: --
U.S. Core PCE Price Index YoY (Sept)--
F: --
P: --
U.S. Real Personal Consumption Expenditures MoM (Sept)--
F: --
P: --
U.S. 5-10 Year-Ahead Inflation Expectations (Dec)--
F: --
P: --
U.S. UMich Current Economic Conditions Index Prelim (Dec)--
F: --
P: --
U.S. UMich Consumer Sentiment Index Prelim (Dec)--
F: --
P: --
U.S. UMich 1-Year-Ahead Inflation Expectations Prelim (Dec)--
F: --
P: --
U.S. UMich Consumer Expectations Index Prelim (Dec)--
F: --
P: --
U.S. Weekly Total Rig Count--
F: --
P: --
U.S. Weekly Total Oil Rig Count--
F: --
P: --
U.S. Consumer Credit (SA) (Oct)--
F: --
P: --
 China, Mainland Foreign Exchange Reserves (Nov)
--
F: --
P: --

No matching data
Latest Views
Latest Views
Trending Topics
Top Columnists
Latest Update
White Label
Data API
Web Plug-ins
Affiliate Program
View All
No data
As U.S. inflation stabilizes, consumers are more optimistic about their financial expectations. The U.S. consumer sentiment index rose for the first time in five months in August, according to data released by the University of Michigan.


 A short position is essentially a bet that an asset will fall in value, and a long position is a wager its price will rise.
 The bar to extending long yen positions and for further yen appreciation may be higher. The U.S. economy is still growing at a decent clip - a 2% annualized rate, according to the Atlanta Fed GDPNow model's latest estimate - and the dollar's interest rate and yield advantage over the yen remains substantial.
Data this week was about as good as even the most optimistic bull might have hoped for and any remaining bearish technical signals were put to rest with the S&P500's (SPY) move through 5390-400. There have now been 7 higher closes in a row and it appears a new leg of the bull market is underway.
The early resumption of the rally may be frustrating for many who missed the bottom. I'm unfortunately in this camp - after calling the top and a correction to 5265, I was all set to load up again, but of course the market didn't give me a nice little dip to buy. The "crash" on August 5th got me overly cautious and I am now underinvested. I'd love to see another big dip, but I'm also looking at alternative ways to buy, even when the S&P500 is approaching its all-time high; it doesn't tend to give buyers a second chance.
This week's article will identify new inflection points. These can help keep you on the right side of the trend and can be used to enter trades with minimal risk, even when the market has moved a long way. Various techniques will be applied to multiple timeframes in a top-down process which also considers the major market drivers. The aim is to provide an actionable guide with directional bias, important levels, and expectations for future price action.
The August bar has not only traded back into the July range above 5390, but is now back in positive territory. There are still 2 full weeks to go until the monthly close, but at this juncture, a bullish bar has formed and only a close below 5390 will shift it neutral/bearish.
I'm slightly surprised at the brevity of the correction in August. The monthly exhaustion took 8-9 months to set up, and came in confluence with a weekly signal and the major Fib extension at 5638. It was a full house of bearish signals and might still have some lingering effects which cap the gains over 5669.
The next major target is the 6124 level. This is a measured move where the 2022-2024 rally will be equal in size to the 2020-2022 rally. It is unlikely to be reached this side of the election, but is a possible destination at some point in this bull market.
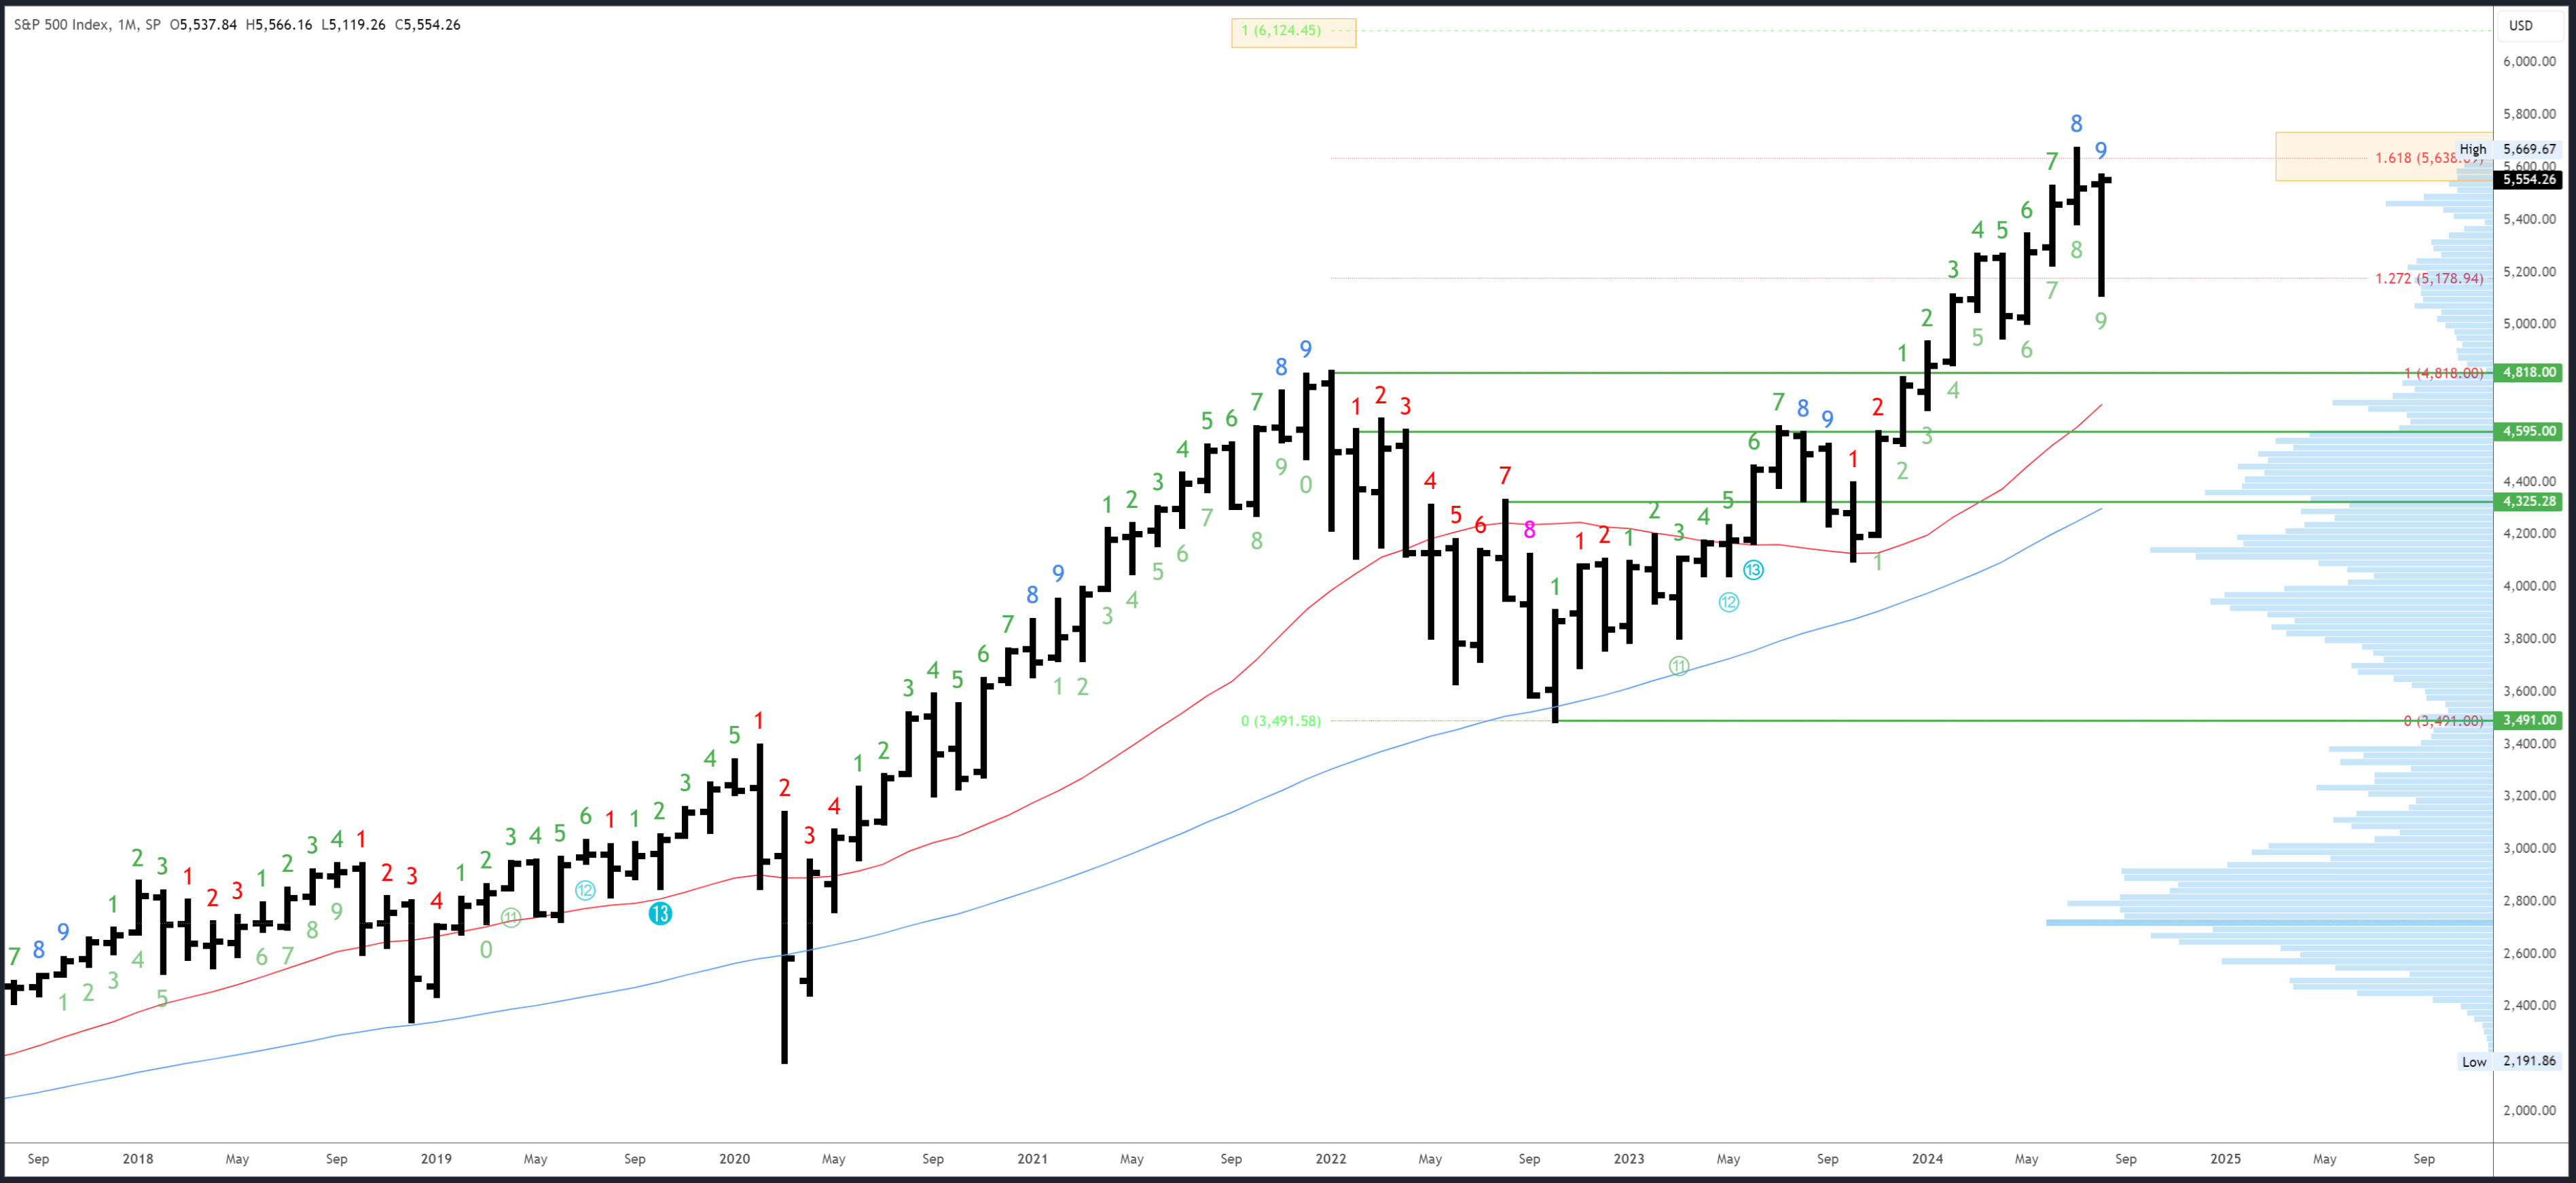
5638 and the 5669 are major resistance points.
5390 and the August low of 5119 are initial supports.
The August bar will complete the upside Demark exhaustion count. It may have played out already with the correction of nearly 10%, but its effect could linger and limit rallies ahead of the election.
Last week's article highlighted the need for a "higher low, higher high and higher close over 5344, ideally 5400" to confirm a reversal. These were provided emphatically in a very bullish weekly bar. The close at the highs suggests the rally will follow through early next week.
The comparison with the initial drop from the 2022 top (highlighted) is still valid, but less compelling with this week's strong action. A large drop next week would be needed to keep this comparison relevant,
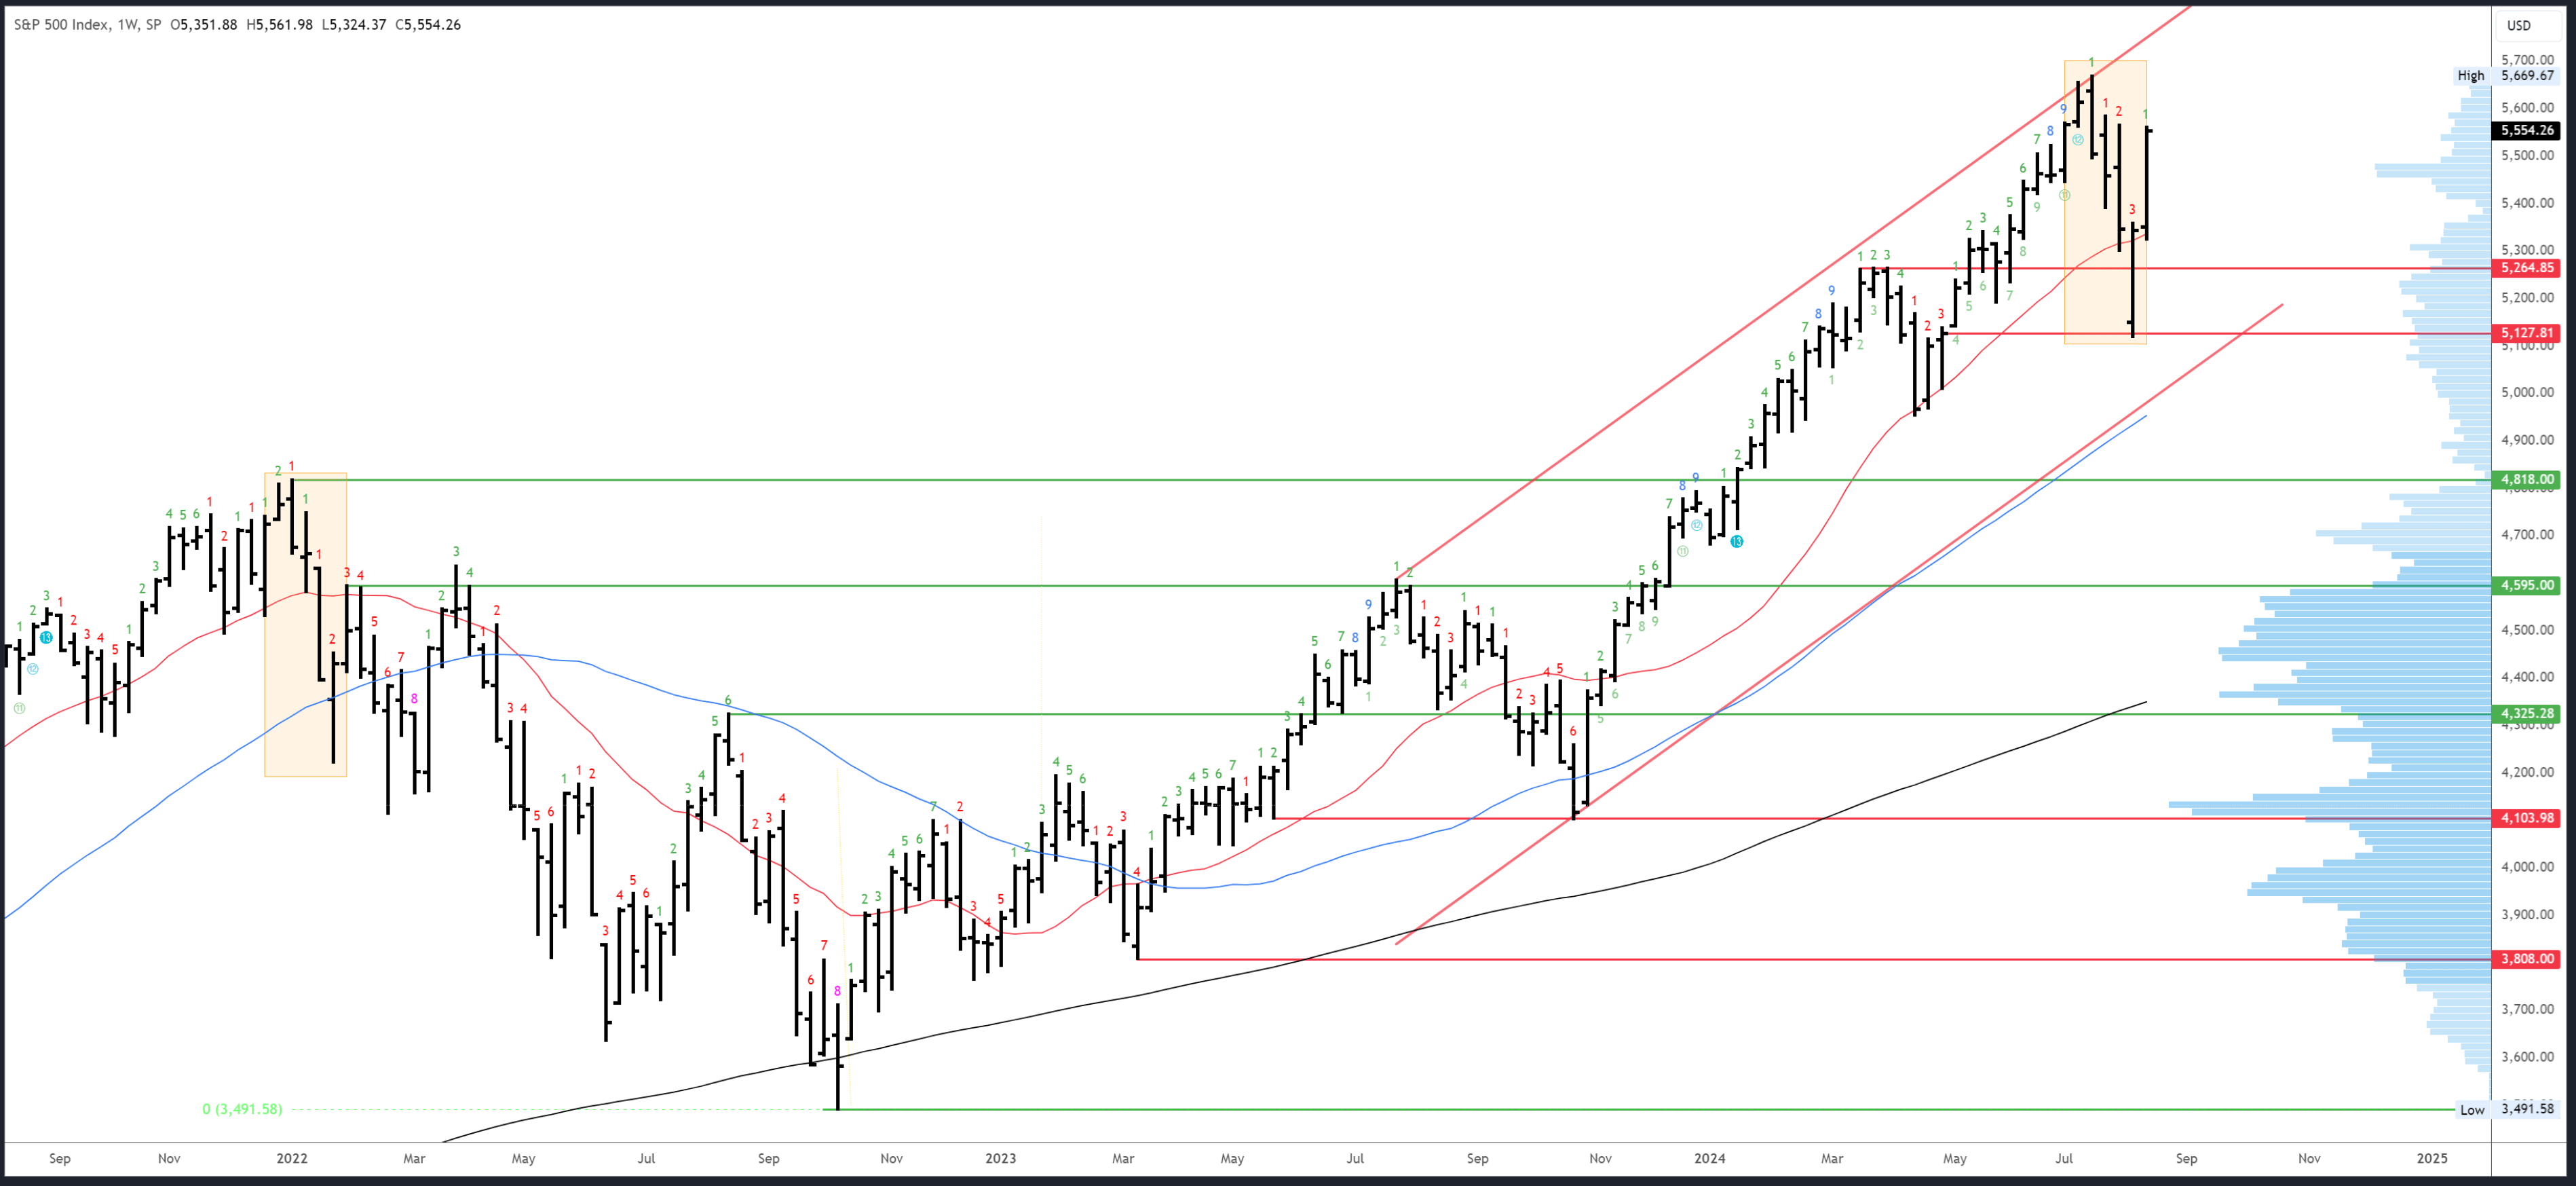
Initial resistance comes in at 5566 and is likely to be tested early next week.
The 20-week MA and low of last week are initial support at 5324.
Next week will be bar 2 (of a possible 9) in a new upside Demark exhaustion count.
The S&P500 is nearly back where the 3-day crash (if we can call it that) originated at 5566. It's obvious resistance, but so was the 5390-400 area which was cut through last week like it was nothing. This is similar action to early November '23 and to early May '24 when the rally gapped over resistance points and maintained strong momentum.
Rallies tend to slow when they reach the area of the preceding top and a clean break of 5669 looks unlikely. Expect shallow dips until this level is reached.
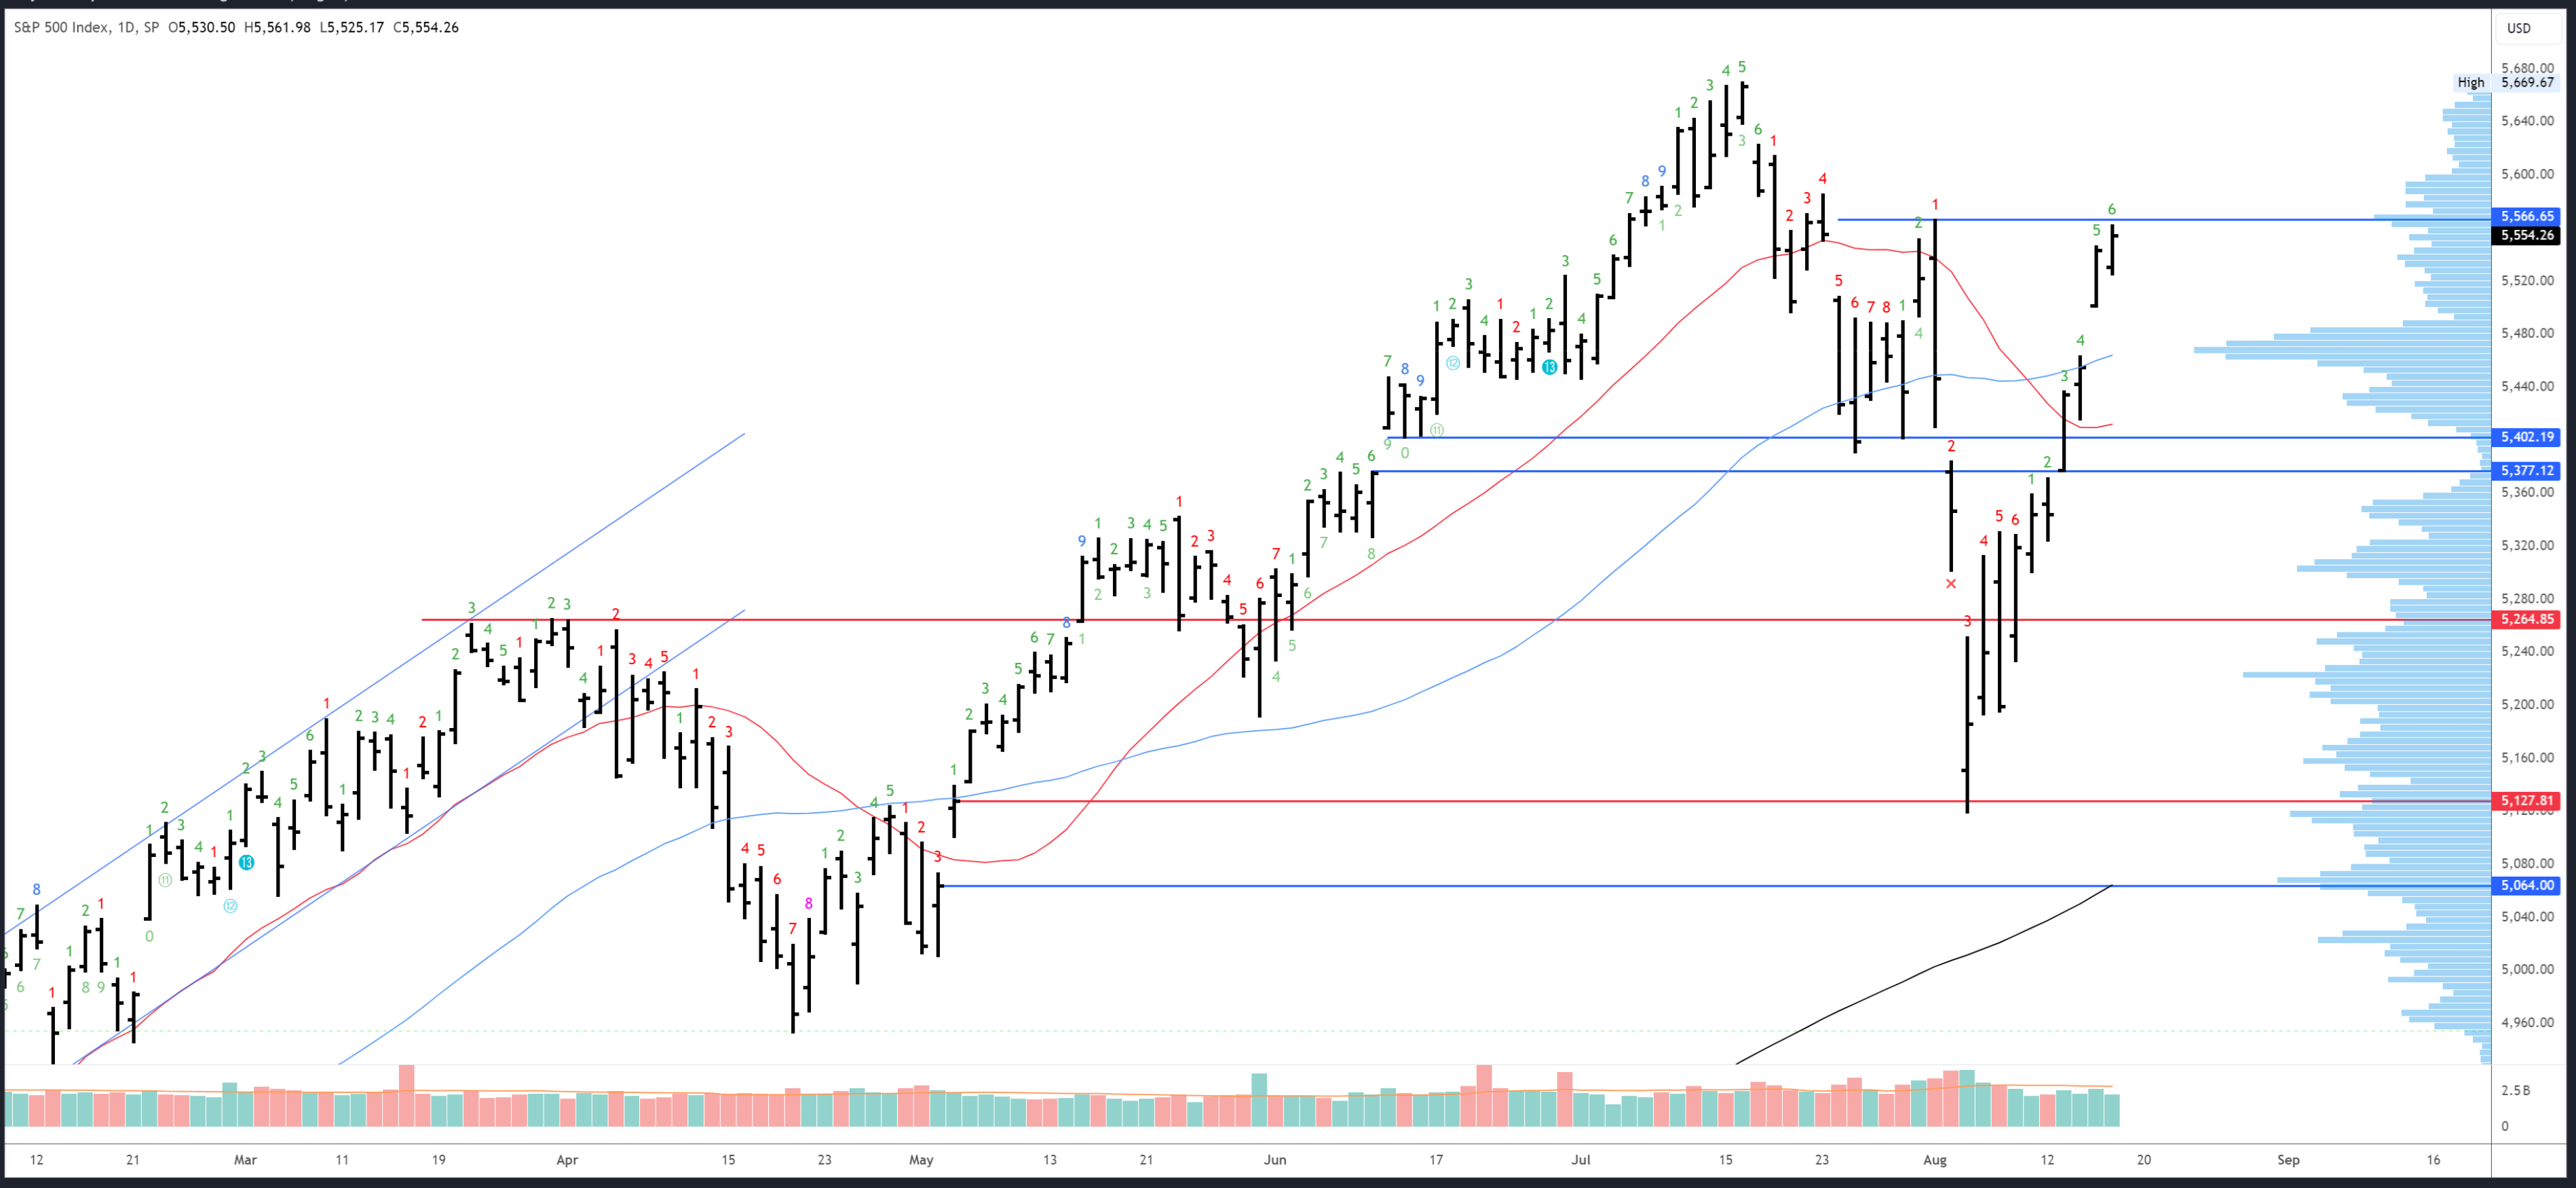
5566-85 is the first resistance, then the 5669 peak.
On the downside, the gap at 5500 is potential support, followed by 5463-70 at the high volume area. The 5390-400 area is still relevant; a break below this level would put the recovery into question.
An upside Demark exhaustion will be on bar 7 (of 9) on Monday. A reaction is often seen on bars 8 or 9 which means a pause/dip gets more likely from Tuesday onwards.
The data was so good this week, a 50bps cut in September has been priced out and the odds of a 25bps move have risen to 75%. US Core PPI came in at 0.0% when 0.2% was expected, CPI stayed at 0.2%, but most important of all, Unemployment Claims came in lower than expected at 227K, some way from the danger area of 250K. Panic over the labour market seems premature. Importantly, yields moved lower again, this time for the right reasons (low inflation).
Data next week is on the quiet side and should allow the current move higher to continue. FOMC Minutes are due for release Wednesday while Thursday will bring PMIs and Unemployment Claims - the stronger the better for the S&P500. Fed Chair Powell is scheduled to talk at the Jackson Hole Symposium on Friday. While no surprises are expected, it will be interesting to hear the Fed's view on recent events; will they push back on the dovish repricing and expectations for aggressive cuts? Probably not.
While the data may be positive, concerns over valuations, the economy and the election could cap the upside. Remember the July top formed on good news (CPI), and the August bottom came when things looked their worst. The reaction to data often depends on the technical context (positioning).
The bullish bigger picture view is firmly intact and it seems the expected H2 correction has played out already. New all-time highs are expected in the coming weeks, although the trend above 5669 may be limited by the continued effect of the monthly exhaustion signal and concerns over the labour market/economy. Election uncertainty is also likely to cap rallies. I'm anticipating an initial break of 5669 will fail and then lead to a much slower drift higher to form a wedge pattern.
Short-term, resistance at 5566-85 should be reached early next week. A daily exhaustion signal should then lead to a pause and dip, but 5500 ideally holds to set up continuation to 5669 where a longer consolidation is likely. Assuming this scenario plays out reasonably well, I would buy near 5500 and add if 5463-70 is reached.
Should 5390-400 break, it would mean my conclusions of a strong move to 5669 are wrong and the S&P500 is still in a correctional phase. Although this would be disappointing, it could provide an opportunity to buy during a deeper dip and I may get a second chance after all.
 Record output from solar and wind farms plus the highest hydro generation total since 2016 have been the main drivers of the clean power surge, which allowed generators to slash natural gas-fired output by 60% from the January to July period in 2023.
 Portugal's power firms have also lifted total electricity generation by 7% to the highest since 2021, demonstrating that a multi-pronged approach to boosting clean generation can trigger rapid progress against energy transition targets.
 That fossil-fired total is down 59% from the same period in 2023, and is the lowest on record.
 Through the first seven months of 2024, pumped storage output was up 67% to 172,758 megawatt hours (MWh), while run-of-river generation was 70% higher at 259,415 MWh, according to LSEG.
 All told, the cumulative gains in Portugal's hydro generation allowed hydropower's share of the electricity generation mix to average 35.3% so far this year, compared to 20.7% during the same period in 2023, Ember's data shows.
728 RM B 7/F GEE LOK IND BLDG NO 34 HUNG TO RD KWUN TONG KLN HONG KONG


White Label
Data API
Web Plug-ins
Poster Maker
Affiliate Program
The risk of loss in trading financial instruments such as stocks, FX, commodities, futures, bonds, ETFs and crypto can be substantial. You may sustain a total loss of the funds that you deposit with your broker. Therefore, you should carefully consider whether such trading is suitable for you in light of your circumstances and financial resources.
No decision to invest should be made without thoroughly conducting due diligence by yourself or consulting with your financial advisors. Our web content might not suit you since we don't know your financial conditions and investment needs. Our financial information might have latency or contain inaccuracy, so you should be fully responsible for any of your trading and investment decisions. The company will not be responsible for your capital loss.
Without getting permission from the website, you are not allowed to copy the website's graphics, texts, or trademarks. Intellectual property rights in the content or data incorporated into this website belong to its providers and exchange merchants.
Not Logged In
Log in to access more features

FastBull Membership
Not yet
Purchase


Log In
Sign Up


