• Trade
  • Markets
  • Copy
  • Contests
  • News
  • 24/7
  • Calendar
  • Q&A
  • Chats
Trending
Screeners
SYMBOL
LAST
BID
ASK
HIGH
LOW
NET CHG.
%CHG.
SPREAD
SPX
S&P 500 Index
6920.92
6920.92
6920.92
0.00
0
0.00
0.00%
--
DJI
Dow Jones Industrial Average
48996.07
48996.07
48996.07
0.00
0
0.00
0.00%
--
IXIC
NASDAQ Composite Index
23584.26
23584.26
23584.26
0.00
0
0.00
0.00%
--
USDX
US Dollar Index
98.620
98.700
98.620
98.640
98.390
+0.140
+ 0.14%
--
EURUSD
Euro / US Dollar
1.16574
1.16581
1.16574
1.16827
1.16560
-0.00179
-0.15%
--
GBPUSD
Pound Sterling / US Dollar
1.34215
1.34222
1.34215
1.34651
1.34154
-0.00353
-0.26%
--
XAUUSD
Gold / US Dollar
4428.39
4428.73
4428.39
4466.25
4407.63
-27.75
-0.62%
--
WTI
Light Sweet Crude Oil
56.949
56.979
56.949
57.076
55.890
+0.649
+ 1.15%
--

Community Accounts

Signal Accounts
--
Profit Accounts
--
Loss Accounts
--
View More

Become a signal provider

Sell trading signals to earn additional income

View More

Guide to Copy Trading

Get started with ease and confidence

View More

Signal Accounts for Members

All Signal Accounts

Best Return
  • Best Return
  • Best P/L
  • Best MDD
Past 1W
  • Past 1W
  • Past 1M
  • Past 1Y

All Contests

  • All
  • Trump Updates
  • Recommend
  • Stocks
  • Cryptocurrencies
  • Central Banks
  • Featured News
Top News Only
Share

[US Media Figure: Trump's Increased Military Spending Indicates The US May Be Preparing For A "World War"] Former Fox News Host Tucker Carlson Stated On The 7th That US President Trump's Announcement Of Increasing US Military Spending To $1.5 Trillion In Fiscal Year 2027 Indicates The US May Be Preparing For A "world War." Carlson Posted A Video Of His Conversation With An American Journalist On His Social Media Account That Evening. In The Video, He Stated That The Pentagon's Budget Increase To $1.5 Trillion Demonstrates "the Characteristics Of A Country Preparing For A Global Or Regional War." Carlson Said This Trend Indicates The US Is Moving In A Direction Where A "world War" May Break Out

Share

[Turkish Media Reports That A Russian-linked Oil Tanker Was Attacked By A Drone In The Black Sea] Turkish Media Reports That A Russian-linked Oil Tanker Was Attacked By A Drone In The Black Sea. According To Ntv, The Palau-flagged Tanker "Elbus" Was Attacked Approximately 30 Miles Off The Turkish Coast. The Media Outlet Stated That The Vessel Issued A Distress Call And Dispatched The Coast Guard To The Scene. The Industry Database Equasis Did Not Provide Contact Information For The Ship's Owner

Share

Governor: Lebanon Central Bank Seeks To Recuperate Embezzled Funds To Bolster Liquidity

Share

Israeli Forces Kill Four In Gaza, Say They Hit Rocket Launch Site

Share

Fed Data - USA Effective Federal Funds Rate At 3.64 Percent On 07 January On $83 Billion In Trades Versus 3.64 Percent On $88 Billion On 06 January

Share

According To Data From The Federal Reserve Bank Of New York, The Secured Overnight Funding Rate (Sofr) Was 3.65% On The Previous Trading Day (January 7), Compared To 3.66% The Day Before

Share

USA Dollar Index Edges Higher Following Initial Jobless Claim Data, Last Up 0.08% At 98.814

Share

Euro Loses Ground Against Dollar Following Initial Jobless Claim Data, Last Down 0.06% At $1.167025

Share

EU's Kallas: We Have Had Discussions Among Europeans What Would Be Our Response If Threat From USA Is Real

Share

US Dollar Pares Losses Against Japanese Yen Following Initial Jobless Claim Data, Last Up 0.01% At 156.785 Yen

Share

Canada Oct Imports C$66.19 Billion, Up 3.4% From Sept C$64.04 Billion (Revised From C$64.08 Billion)

Share

USA Oct Exports $302.02 Billion Versus Sept $294.23 Billion, Imports $331.37 Billion Versus Sept $342.36 Billion

Share

US Jobless Claims 4-Week Average Fell To 211750 Jan 3 Week From 219000 Prior Week (Previous 218750)

Share

The Preliminary Estimate Of U.S. Nonfarm Unit Labor Costs For The Third Quarter Was -1.9%, Compared To An Expected -0.1% And A Previous Reading Of 1%

Share

US Oct Oil Import Price $60.47/Bbl Versus Sept $62.07/Bbl, -11.5% From Oct'24 $68.36/Bbl

Share

USA Oct Goods Deficit $59.15 Billion, Services Surplus $29.80 Billion

Share

USA - China Oct Trade Deficit $14.94 Billion Versus Sept Deficit $15.03 Billion

Share

USA Oct Capital Goods Imports $94.42 Billion Versus Sept Imports $87.58 Billion

Share

USA Oct Exports +2.6% Versus Sept +3.6%, Imports -3.2% Versus Sept +0.8%

Share

US Insured Unemployment Rate Unchanged At 1.2% Dec 27 Week From 1.2% Prior Week (Previous 1.2%)

TIME
ACT
FCST
PREV
France Trade Balance (SA) (Nov)

A:--

F: --

P: --
France Current Account (Not SA) (Nov)

A:--

F: --

P: --

South Africa Manufacturing PMI (Dec)

A:--

F: --

P: --

Italy Unemployment Rate (SA) (Nov)

A:--

F: --

P: --

France 10-Year OAT Auction Avg. Yield

A:--

F: --

P: --

Euro Zone Consumer Inflation Expectations (Dec)

A:--

F: --

P: --

Euro Zone Unemployment Rate (Nov)

A:--

F: --

P: --

Euro Zone PPI MoM (Nov)

A:--

F: --

P: --

Euro Zone Selling Price Expectations (Dec)

A:--

F: --

P: --

Euro Zone PPI YoY (Nov)

A:--

F: --

P: --

Euro Zone Industrial Climate Index (Dec)

A:--

F: --

P: --

Euro Zone Economic Sentiment Indicator (Dec)

A:--

F: --

P: --
Euro Zone Services Sentiment Index (Dec)

A:--

F: --

P: --
Euro Zone Consumer Confidence Index Final (Dec)

A:--

F: --

P: --

Mexico 12-Month Inflation (CPI) (Dec)

A:--

F: --

P: --

Mexico Core CPI YoY (Dec)

A:--

F: --

P: --

Mexico PPI YoY (Dec)

A:--

F: --

P: --

Mexico CPI YoY (Dec)

A:--

F: --

P: --

U.S. Challenger Job Cuts MoM (Dec)

A:--

F: --

P: --

U.S. Challenger Job Cuts (Dec)

A:--

F: --

P: --

U.S. Challenger Job Cuts YoY (Dec)

A:--

F: --

P: --

U.S. Exports (Oct)

A:--

F: --

P: --

U.S. Trade Balance (Oct)

A:--

F: --

P: --
U.S. Initial Jobless Claims 4-Week Avg. (SA)

A:--

F: --

P: --
Canada Imports (SA) (Oct)

A:--

F: --

P: --
U.S. Weekly Initial Jobless Claims (SA)

A:--

F: --

P: --
U.S. Weekly Continued Jobless Claims (SA)

A:--

F: --

P: --
Canada Exports (SA) (Oct)

A:--

F: --

P: --
Canada Trade Balance (SA) (Oct)

A:--

F: --

P: --
U.S. Unit Labor Cost Prelim (SA) (Q3)

A:--

F: --

P: --

U.S. Wholesale Sales MoM (SA) (Oct)

--

F: --

P: --

U.S. EIA Weekly Natural Gas Stocks Change

--

F: --

P: --

U.S. Consumer Credit (SA) (Nov)

--

F: --

P: --

U.S. Weekly Treasuries Held by Foreign Central Banks

--

F: --

P: --

China, Mainland CPI YoY (Dec)

--

F: --

P: --

China, Mainland PPI YoY (Dec)

--

F: --

P: --

China, Mainland CPI MoM (Dec)

--

F: --

P: --

Indonesia Retail Sales YoY (Nov)

--

F: --

P: --

Japan Leading Indicators Prelim (Nov)

--

F: --

P: --

Germany Industrial Output MoM (SA) (Nov)

--

F: --

P: --

Germany Exports MoM (SA) (Nov)

--

F: --

P: --
France Industrial Output MoM (SA) (Nov)

--

F: --

P: --

Italy Retail Sales MoM (SA) (Nov)

--

F: --

P: --

Euro Zone Retail Sales MoM (Nov)

--

F: --

P: --

Euro Zone Retail Sales YoY (Nov)

--

F: --

P: --

Italy 12-Month BOT Auction Avg. Yield

--

F: --

P: --

India Deposit Gowth YoY

--

F: --

P: --

Brazil IPCA Inflation Index YoY (Dec)

--

F: --

P: --

Mexico Industrial Output YoY (Nov)

--

F: --

P: --

Brazil CPI YoY (Dec)

--

F: --

P: --

U.S. Building Permits Revised MoM (SA) (Sept)

--

F: --

P: --

U.S. Building Permits Revised YoY (SA) (Sept)

--

F: --

P: --

U.S. Unemployment Rate (SA) (Dec)

--

F: --

P: --

U.S. Nonfarm Payrolls (SA) (Dec)

--

F: --

P: --

U.S. Average Hourly Wage YoY (Dec)

--

F: --

P: --

Canada Full-time Employment (SA) (Dec)

--

F: --

P: --

Canada Part-Time Employment (SA) (Dec)

--

F: --

P: --

Canada Unemployment Rate (SA) (Dec)

--

F: --

P: --

Canada Labor Force Participation Rate (SA) (Dec)

--

F: --

P: --

Canada Employment (SA) (Dec)

--

F: --

P: --

Q&A with Experts
    • All
    • Chatrooms
    • Groups
    • Friends
    Size flag
    Stay disciplined, protect profits, and keep the mindset clean. One good decision at a time .@Prosenjit
    Prosenjit flag
    Kung Fu
    @Kung Futhank you bro
    Size flag
    Size flag
    Size
    @IzuulThis is my plan mate...
    Kung Fu flag
    Prosenjit
    @Prosenjityou're most welcome. I'm on the buyside of GBPAUD.
    Prosenjit flag
    Size
    Stay disciplined, protect profits, and keep the mindset clean. One good decision at a time .@Prosenjit
    @Sizethank you bro . Always wanted to connected with all of you
    Size flag
    Prosenjit
    Facts. Without a plan, trading turns into gambling
    Prosenjit flag
    Kung Fu
    @Kung Fugood 👍.
    Izuul flag
    Size
    @Size I see, great plan brother
    Size flag
    With a plan, even losses are controlled and part of the process.@Prosenjit
    john flag
    Size flag
    Plan the trade, trade the plan, always 👌@Prosenjit
    marsgents flag
    @Kung Futhat sl is a tiny gap on 4h dad
    john flag
    john
    this was the elephant in the room today and it came mixed
    Prosenjit flag
    Size
    With a plan, even losses are controlled and part of the process.@Prosenjit
    @Sizeyes bro . It always help us to survive
    Kung Fu flag
    Prosenjit
    @Prosenjitdo you know that gold has been ranging? Let me share a chart. Wait for a breakout and hop in
    5KJ105LE94 flag
    Kung Fu
    @Kung Fuwhats your target now on that😅
    Kung Fu flag
    marsgents
    @Kung Futhat sl is a tiny gap on 4h dad
    @marsgents the 4472 stop loss, you mean?
    "Kung Fu" recalled a message
    Prosenjit flag
    Kung Fu
    @Kung Fuyes bro . I am waiting for some confirmation
    Type here...
    Add Symbol or Code

      No matching data

      All
      Trump Updates
      Recommend
      Stocks
      Cryptocurrencies
      Central Banks
      Featured News
      • All
      • Russia-Ukraine Conflict
      • Middle East Flashpoint
      • All
      • Russia-Ukraine Conflict
      • Middle East Flashpoint
      Search
      Products

      Charts Free Forever

      Chats Q&A with Experts
      Screeners Economic Calendar Data Tools
      Membership Features
      Data Warehouse Market Trends Institutional Data Policy Rates Macro

      Market Trends

      Market Sentiment Order Book Forex Correlations

      Top Indicators

      Charts Free Forever
      Markets

      News

      News Analysis 24/7 Columns Education
      From Institutions From Analysts
      Topics Columnists

      Latest Views

      Latest Views

      Trending Topics

      Top Columnists

      Latest Update

      Signals

      Copy Rankings Latest Signals Become a signal provider AI Rating
      Contests
      Brokers

      Overview Brokers Assessment Rankings Regulators News Claims
      Broker listing Forex Brokers Comparison Tool Live Spread Comparison Scam
      Q&A Complaint Scam Alert Videos Tips to Detect Scam
      More

      Business
      Events
      Careers About Us Advertising Help Center

      White Label

      Data API

      Web Plug-ins

      Affiliate Program

      Awards Institution Evaluation IB Seminar Salon Event Exhibition
      Vietnam Thailand Singapore Dubai
      Fans Party Investment Sharing Session
      FastBull Summit BrokersView Expo
      Recent Searches
        Top Searches
          Markets
          News
          Analysis
          User
          24/7
          Economic Calendar
          Education
          Data
          • Names
          • Latest
          • Prev

          View All

          No data

          Scan to Download

          Faster Charts, Chat Faster!

          Download App
          English
          • English
          • Español
          • العربية
          • Bahasa Indonesia
          • Bahasa Melayu
          • Tiếng Việt
          • ภาษาไทย
          • Français
          • Italiano
          • Türkçe
          • Русский язык
          • 简中
          • 繁中
          Open Account
          Search
          Products
          Charts Free Forever
          Markets
          News
          Signals

          Copy Rankings Latest Signals Become a signal provider AI Rating
          Contests
          Brokers

          Overview Brokers Assessment Rankings Regulators News Claims
          Broker listing Forex Brokers Comparison Tool Live Spread Comparison Scam
          Q&A Complaint Scam Alert Videos Tips to Detect Scam
          More

          Business
          Events
          Careers About Us Advertising Help Center

          White Label

          Data API

          Web Plug-ins

          Affiliate Program

          Awards Institution Evaluation IB Seminar Salon Event Exhibition
          Vietnam Thailand Singapore Dubai
          Fans Party Investment Sharing Session
          FastBull Summit BrokersView Expo

          Yen Recovers Amid China Export Curb, Aussie Firm Despite Softer CPI

          Samantha Luan

          Forex

          Political

          Economic

          Summary:

          Yen recovered modestly during the Asian session as Japanese equities edged lower, but both moves lacked conviction.

          Yen recovered modestly during the Asian session as Japanese equities edged lower, but both moves lacked conviction. The pullback in the Nikkei 225 was mild, and the corresponding FX response suggests investors see little reason to reassess the broader trend.

          Geopolitical developments are weighing on Japanese sentiment after China imposed export curbs on selected dual-use items destined for Japan. The measures cover goods and technologies with both civilian and military applications, including rare earths essential for chipmaking and drone production. The restrictions appear linked to comments by Prime Minister Sanae Takaichi last November on Taiwan. Beijing reacted strongly after Takaichi warned that a Chinese attack on the island could represent an existential threat to Japan, further straining already fragile ties.

          Japan's dependence on China remains significant, with around 60% of rare-earth imports sourced from country. Still, the lack of clarity on which items are affected makes it difficult to gauge the real economic impact for now. Meanwhile, some observers argue the move may be largely symbolic. China has historically avoided actions that would severely disrupt Japanese industry, and the latest step may be intended to stir domestic criticism of Takaichi rather than materially damage bilateral trade.

          In contrast, Australian Dollar stayed well bid after extending gains earlier in the day, even as inflation data surprised slightly to the downside. The softer CPI reduced pressure for an immediate February hike by the RBA, but did little to derail the broader tightening narrative. Even with the softer headline outcome today, disinflation in underlying pressures remains modest. That persistence keeps the door open for rate hikes later in the year, even if February proves too soon.

          Markets currently price around a two-thirds chance of a February hold, with a hike expected by June and a strong probability of a second before year-end. Nevertheless, RBA policymakers are expected to place greater weight on the full Q4 inflation report later this month. A 0.9% quarter-on-quarter or higher rise in core inflation could still push the RBA toward tightening in February.

          In FX performance terms this week so far, Aussie continues to lead, followed by Sterling and Yen. Loonie sits at the bottom, with Swiss Franc and Euro also under pressure. Dollar and Kiwi are trading d in the middle. Focus now shifts to US ADP jobs and ISM Services PMI later today, though the decisive catalyst is expected to be Friday's non-farm payrolls.

          In Asia, Nikkei fell -1.06%. Hong Kong HSI is down -1.12%. China Shanghai SSE rose 0.05%. Singapore Strait Times is flat. Japan 10-year JGB yield fell -0.008 to 2.122. Overnight, DOW rose 0.99%. S&P 500 rose 0.62%. NASDAQ rose 0.65%. 10-year yield rose 0.014 to 4.179.

          Australia CPI cools more than expected to 3.4%, easing near-term pressure on RBA

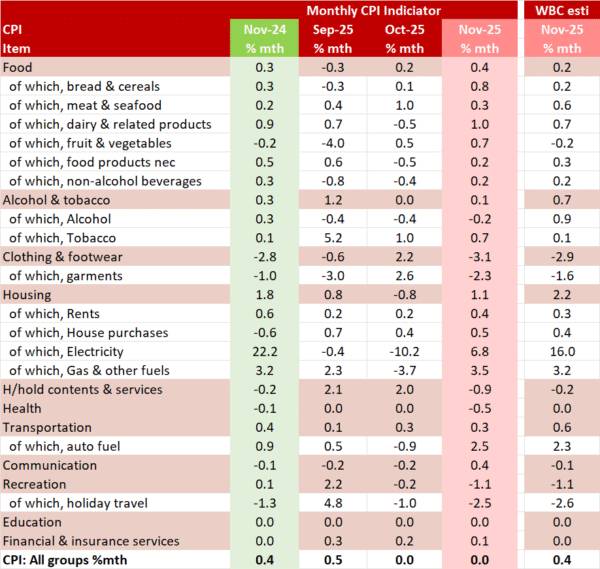
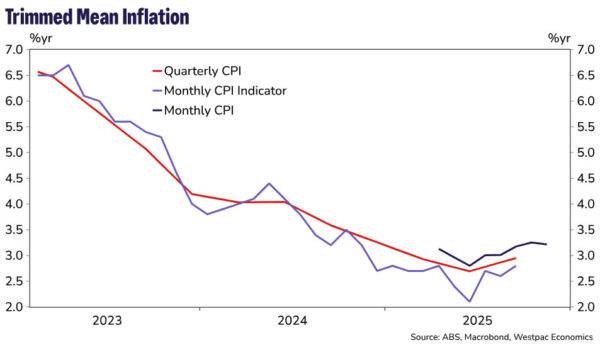
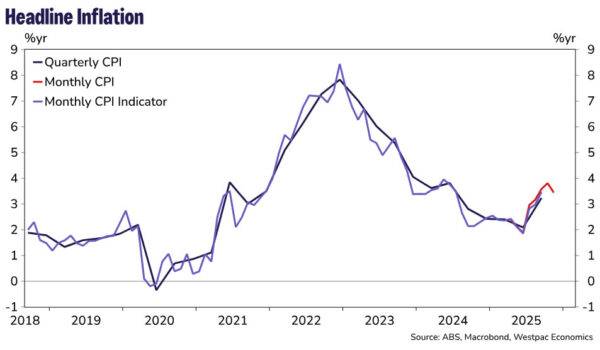
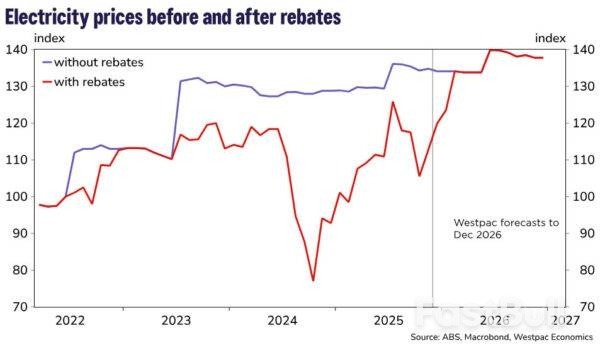
          Australia's inflation cooled more than expected in November, offering some relief after months of intensifying price pressure. Headline CPI slowed from 3.8% yoy to 3.4%, undershooting expectations of 3.6%. Trimmed mean inflation eased modestly from 3.3% yoy to 3.2%, pointing to a gradual moderation in underlying pressures.

          The slowdown was broad-based. Annual goods inflation fell to 3.3% yoy from 3.8%, driven largely by a sharp deceleration in electricity prices, which rose 19.7% over the year compared with 37.1% previously. Services inflation also eased, slowing to 3.6% yoy from 3.9%, helped by a pullback in domestic holiday travel costs after October's school-holiday and major sporting-event surge.

          Despite the moderation, price pressures remain elevated in key areas. Housing inflation stayed firm at 5.2% yoy, while rents and medical services continued to rise at a solid pace. The data ease immediate pressure on the RBA for rate hike. But with inflation still well above target range, policymakers are likely to remain cautious about declaring victory too early.

          Japan PMI composite finalized at 51.1, but confidence and hiring hold up

          Japan's service sector lost some momentum at the end of 2025, with Services PMI finalized at 51.6 in December, down from 53.2 in November. Composite PMI eased to 51.1 from 52.0, marking a seven-month low.

          According to S&P Global Market Intelligence Economics Associate Director Annabel Fiddes, services firms reported slower growth in activity and new orders, while manufacturing showed relative improvement. Despite softer demand signals, business confidence across Japan's private sector remained firm, supporting a "solid and accelerated rise in employment".

          Cost pressures, however, remain a key challenge. Input prices rose at the fastest pace since April, driven by higher costs, prompting firms to lift selling prices at a solid rate. With demand conditions softening slightly, companies face a "difficult balance" between passing on higher costs to protect margins and maintaining competitiveness.

          EUR/JPY Daily Outlook

          Daily Pivots: (S1) 182.87; (P) 183.26; (R1) 183.53;

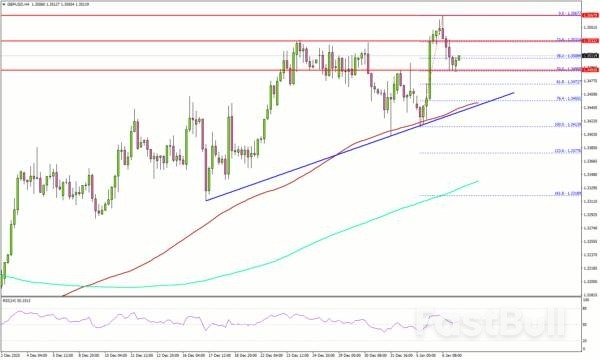
          EUR/JPY edges lower today and the sustained trading below 55 4H EMA (now at 183.45) argues that fall from 184.89 short term top is already correcting the rally from 172.24. Intraday bias is mildly on the downside for 55 D EMA (now at 180.74). But strong support should emerge from 180.07 cluster (38.2% retracement of 172.24 to 184.89 at 180.05) to bring rebound. ON the upside, firm break of 184.89 will resume larger up trend to 186.31 fibonacci level.

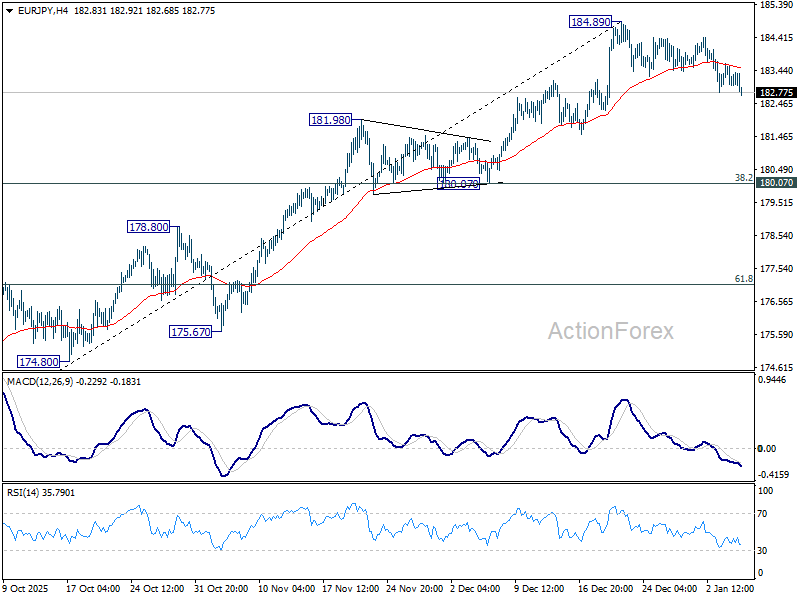
          In the bigger picture, up trend from 114.42 (2020 low) is in progress and should target 61.8% projection of 124.37 to 175.41 from 154.77 at 186.31. Considering bearish divergence condition in D MACD, upside could be capped by 186.31 on first attempt. Still, outlook will stay bullish as long as 55 W EMA (now at 172.16) holds, even in case of deep pullback. Sustained break of 186.31 will pave the way to 100% projection at 205.81 next.

          Economic Indicators Update

          GMTCCYEVENTSACTF/CPPREV
          00:30JPYServices PMI Dec F51.652.552.5
          00:30AUDCPI M/M Nov0.00%0.10%0.00%
          00:30AUDCPI Y/Y Nov3.40%3.60%3.80%
          00:30AUDTrimmed Mean CPI M/M Nov0.30%0.20%0.30%0.40%
          00:30AUDTrimmed Mean CPI Y/Y Nov3.20%
          3.30%
          00:30AUDBuilding Permits M/M Nov20.20%2.10%-6.40%-6.10%
          07:00EURGermany Retail Sales M/M Nov-0.60%0.20%-0.30%
          08:55EURGermany Unemployment Rate Nov
          6.30%6.30%
          08:55EURGermany Unemployment Change Nov
          5K1K
          09:30GBPConstruction PMI Dec
          42.439.4
          10:00EUREurozone CPI Y/Y Dec P
          2.10%2.10%
          10:00EUREurozone Core CPI Y/Y Dec P
          2.40%2.40%
          13:15USDADP Employment Change Dec
          50K-32K
          15:00USDISM Services PMI Dec
          52.352.6
          15:00USDFactory Orders M/M Oct
          -1.00%0.20%
          15:00CADIvey PMI Dec
          49.548.4
          15:30USDCrude Oil Inventories (Jan 2)
          -1.2M-1.9M

          Source: ACTIONFOREX

          To stay updated on all economic events of today, please check out our Economic calendar
          Risk Warnings and Disclaimers
          You understand and acknowledge that there is a high degree of risk involved in trading. Following any strategies or investment methods may lead to potential losses. The content on the site is provided by our contributors and analysts for information purposes only. You are solely responsible for determining whether any trading assets, securities, strategy, or any other product is suitable for investing based on your own investment objectives and financial situation.
          Add to Favorites
          Share

          GBP/USD Maintains Strength, Even As Upside Momentum Pauses

          Titan FX

          Forex

          Technical Analysis

          Key Highlights

          · GBP/USD started a fresh increase above 1.3480 and 1.3500.
          · A key bullish trend line is forming with support at 1.3450 on the 4-hour chart.
          · USD/JPY is consolidating above the 156.00 pivot level.
          · XRP price surged over 20% and climbed above $2.30.

          GBP/USD Technical Analysis

          The British Pound remained supported for more gains against the US Dollar. GBP/USD climbed above 1.3450 to start another increase.

          Looking at the 4-hour chart, the pair settled above 1.3450, the 100 simple moving average (red, 4-hour), and the 200 simple moving average (green, 4-hour). The pair even spiked above 1.3550 before the bears appeared.

          A high was formed at 1.3567, and the pair is now correcting some gains. On the downside, immediate support is near the 1.3490 level. The first major area for the bulls might be near 1.3450 and a bullish trend line.

          The 100 simple moving average (red, 4-hour) is also near 1.3450. A close below 1.3450 might spark heavy bearish moves. The next support could be 1.3420, below which the bears might aim for a move toward 1.3350.

          Immediate resistance sits near 1.3550. The first key hurdle is seen near 1.3565. A close above 1.3565 could open the doors for a move toward 1.3620. Any more gains could set the pace for a steady increase toward 1.3650.

          Looking at XPR, the bulls took control and pushed the price above many key hurdles such as $2.20, $2.30, and $2.35.

          Upcoming Key Economic Events:

          · US ISM Services PMI for Dec 2025 – Forecast 52.3, versus 52.6 previous.
          · US ADP Employment Change for Dec 2025 – Forecast 45K, versus -32K previous.

          Source: Titan FX

          Risk Warnings and Disclaimers
          You understand and acknowledge that there is a high degree of risk involved in trading. Following any strategies or investment methods may lead to potential losses. The content on the site is provided by our contributors and analysts for information purposes only. You are solely responsible for determining whether any trading assets, securities, strategy, or any other product is suitable for investing based on your own investment objectives and financial situation.
          Add to Favorites
          Share

          Australia November CPI: Momentum Not As Strong As First Thought

          Westpac

          The new Complete Monthly CPI printed softer than we thought presenting downside risk to our December quarter estimates.

          · Headline CPI came in softer than Westpac had expected; 0.0% in the month compared to our 0.4% forecast.
          · As such, this presents a downside risk to our current December quarter nearcast of 0.6%qtr for the Headline CPI and 0.8%qtr for the Trimmed Mean.
          · If this is correct, it should be enough to comfort the RBA that they do not need to lift rates at the February meeting.
          · Outside of administered prices, known supply shocks and items that are known to be volatile, we continue to expect the currently inflationary pulse to moderate through 2026.

          The new Complete Monthly CPI gained 3.4% in the year to November, softer than Westpac's estimate of 3.8%yr and the market estimate of 3.6%yr. At face value, this suggests downside risk to our December quarter estimates of 0.8%qtr for the Trimmed Mean (TM) and 0.6% for the CPI. However, we still need to complete a full review of the monthly data to confirm this.

          November's headline figure was flat in the month, softer than Westpac's published near-cast of 0.4% on the back of a smaller than expected rise in electricity (6.8% vs 16.0% estimated), a larger than expected fall in household contents & services (–0.9% vs –0.2% estimated), clothing & footwear (–3.1% vs. –2.9% estimate) and health (–0.5% vs. 0.0% expected), a smaller than expected rise in transport (0.3% vs. 0.6% forecast) to be partially offset by stronger gains in food (0.4% vs 0.2% estimated), rents (0.4% vs 0.3% estimated), dwellings (0.5% vs 0.4% estimated) and communication (0.4% vs. –0.1% estimated).

          As has been the norm for some time, the energy rebates continue to have a significant impact on estimates of consumer price inflation. Electricity costs rose 19.7% in the year to November, held down by households using the Queensland State Government electricity rebate . This is a moderation from the 37.1%yr pace in October 2025 reflecting, as the ABS noted, that more households received catch-up payments of the Commonwealth Energy Bill Relief Fund (EBRF) rebate in 2024 compared to 2025.

          The ABS estimates that excluding the impact of the Commonwealth and State Government electricity rebates over the past year, electricity prices rose 4.6% in the year to November compared to a 5.0% increase in the year to October. This reflects annual price reviews from energy retailers in July 2025.

          The TM measure was reported to have increased 3.2% in the year to November, a slight moderation from the 3.3%yr pace in October. Due to its short history, the annual pace of monthly TM inflation can only be calculated back to April 2025. Before then the ABS noted that annual movements are calculated by comparing each quarter to the same quarter in the previous year.

          The TM lifted 0.3% in the month of November, the same monthly increase it has seen for the previous four months and down from the 0.5%mth increase in July but stronger than the 0.2%mth prints from March to June.

          While we note that the current annual pace of the Monthly TM, at 3.2%yr, matches our current December quarter TM estimate of 3.2%yr, we do know that the RBA will, at least for the near term, remain focused on the quarterly TM, rather than the Monthly TM. This is because the ABS does not have enough history to complete a full seasonal adjustment process for all the components of the Monthly CPI. The ABS has also noted it will take at least 18 months to gather that data so it is likely to be a year and a half before we will be able to make a more detailed assessment of core inflation directly via the monthly TM. As such, we anticipate the RBA will use the December print to guide their decision. Our expectation is that the Monetary Policy will remain cautious and pause at its next meeting in February and remain on hold for the remainder of the year.

          As we have noted, see our November CPI preview, while some series did have a longer monthly history coming from the previously published monthly CPI indicator and the ABS can potentially use historical seasonal analysis we caution that some of the new data sets have a different history to the old data and as such, we expect it is going to take some time to understand the seasonal behaviour of the new data.

          Source: Westpac Banking Corporation

          Risk Warnings and Disclaimers
          You understand and acknowledge that there is a high degree of risk involved in trading. Following any strategies or investment methods may lead to potential losses. The content on the site is provided by our contributors and analysts for information purposes only. You are solely responsible for determining whether any trading assets, securities, strategy, or any other product is suitable for investing based on your own investment objectives and financial situation.
          Add to Favorites
          Share

          US Labour Data And Euro Area Inflation In The Spotlight

          Danske Bank

          Forex

          Stocks

          Economic

          In focus today

          From the US, ISM Services index and ADP private sector employment report are due for release for December, and the JOLTs report for November. ADP's weekly employment estimates signalled improving jobs growth momentum towards late November and early December.

          In the euro area, we expect HICP inflation to decline to 1.9% y/y in December from 2.1% y/y in November with a risk that it could round down to 1.8% y/y. We expect core inflation at 2.3% y/y. Hence, the December inflation should be seen as a dovish surprise, although sticky services inflation somewhat limits how dovishly it should be interpreted.

          In Sweden, services PMI for December are released today. The November service PMI outcome for Sweden was the highest since summer 2022 and significantly stronger than the outcomes in both Europe and the US. Given that we have seen a decline in most countries for the December outcome, it would not be surprising if we also see some pullback in today's December release for Sweden.

          Economic and market news

          What happened overnight

          China imposed a ban on the export of dual-use items to Japan for military use, escalating a diplomatic dispute over Japanese Prime Minister Takaichi's recent remarks on Taiwan. Japan has called the measure "absolutely unacceptable," as the ban includes rare earth elements critical for manufacturing. Beijing is reportedly considering broader rare earth curbs, which could significantly impact Japan's economy and key industries like automotives. Market reaction has been muted so far, though Japanese shares fell on Wednesday, led by declines in mining stocks.

          Overnight, US President Trump once again rekindled his ambition to acquire Greenland, citing national security priorities in the Arctic region and the island's untapped mineral resources. While the White House stated that purchasing Greenland is being discussed, it also explicitly stated that military action to acquire it is an option. That said, WSJ also reported that Secretary of State Marco Rubio had downplayed the threats as a negotiation tactic in a recent internal briefing. European leaders and US lawmakers have expressed strong opposition, stressing respect for Denmark's sovereignty and NATO obligations, but the administration insists the goal "is not going away".

          What happened yesterday

          In Germany, December inflation came in weaker than expected, with HICP inflation falling to 2.0% y/y (cons: 2.2%, prior: 2.6%) and CPI inflation declining to 1.8% y/y (cons: 2.1% y/y, prior: 2.3% y/y). The surprise was driven by sharp declines in goods and food prices, while energy prices fell as anticipated. However, services inflation remained very sticky at 3.5% y/y, limiting the dovish interpretation of the weaker headline figures.

          In France, HICP inflation fell to 0.7% y/y in December from 0.8% y/y in November, as expected. The decline was driven by lower energy prices, while food inflation rose and services inflation held steady at 2.2% y/y. These prints point to lower than initially expected euro area headline inflation today, which we now expect to decline to 1.9% y/y.

          In the US, Federal Reserve Governor Stephen Miran argued for aggressive interest rate cuts in 2026, calling for over 100 basis points of reductions to support economic growth. Miran stated that policy remains overly restrictive despite inflation being close to the Fed's 2% target and warned that failing to lower rates could hinder robust growth expectations for the year. His term as a Fed governor ends on 31 January, and he is serving at the Fed while on leave from his role as a top economic adviser to President Trump.

          In geopolitics, Venezuelan opposition leader Maria Corina Machado praised US President Trump for the capture of Nicolas Maduro and expressed confidence that her movement would win a free election. Machado escaped Venezuela in October and received the Nobel Peace Prize and now vows to return as soon as possible. However, Trump appears to be working with interim President Delcy Rodriguez, a Maduro ally, to stabilise Venezuela before an election, disappointing the opposition. International backlash against the US intervention continues, with concerns over the precedent it sets for global norms. Overnight, Trump announced plans to refine and sell up to 50 million barrels of sanctioned Venezuelan oil, with revenues controlled by the US administration to allegedly benefit both Venezuelans and Americans

          In the euro area, final December services PMI was revised slightly down to 52.4 from the flash estimate of 52.6, while the composite PMI fell to 51.5 from 51.9 due to the manufacturing print being revised down. Despite the downward revisions, the euro area economy ended the year on a positive footing, with the Q4 average composite PMI significantly higher than in Q3, indicating decent growth and supporting the ECB's assessment of the economy being in a "good place".

          In Norway, house prices (SA) were unchanged in December, falling short of Norges Bank's December MPR estimate of +0.8%. While this is unlikely to affect monetary policy in the short term, the data could support lower rate expectations in the market.

          Equities: Global equities extended gains yesterday, marking the third consecutive positive trading day to start 2026. In Europe, the advance was more defensively led, with healthcare outperforming. Oil prices reversed lower after a brief uptick, weighing on energy stocks, which underperformed on the day.

          More importantly, the first three trading days of the year have been characterised by a broadening of the equity rally. Performance has rotated away from some last year's winners (not least tech) and towards more classic deep cyclical sectors. Likewise small caps have outperformed large caps for three days in a row, reinforcing the message of broader participation. Putting this into perspective: since our last tactical shift in mid-December, the materials sector is up 8.2%, while global technology is down 1.7%.

          Part of this reflects the exceptional strength in both industrial and precious metals, but the broader takeaway remains clear. Global equities are up 2.2% over the same period, despite technology underperforming. In other words, equities can rise even when tech does not lead! In the US yesterday, Dow +1.0%, S&P 500 +0.6%, Nasdaq +0.7%, and Russell 2000 +1.4%. This morning, Asian markets are mixed, and futures in both Europe and the US point to a more cautious open.

          FI and FX: The USD outperformed most of the rest of the G10 currency space yesterday closely followed by the Scandies on another day marked by positive sentiment in the stock market. The bond market was overall steady with US yields inching higher and European yields lower. The DKK market came under pressure. The culprit was a rise in EUR/DKK close to past central bank FX intervention levels, which led widening of the spread between Danish and German government bonds.

          Source: Danske Bank

          To stay updated on all economic events of today, please check out our Economic calendar
          Risk Warnings and Disclaimers
          You understand and acknowledge that there is a high degree of risk involved in trading. Following any strategies or investment methods may lead to potential losses. The content on the site is provided by our contributors and analysts for information purposes only. You are solely responsible for determining whether any trading assets, securities, strategy, or any other product is suitable for investing based on your own investment objectives and financial situation.
          Add to Favorites
          Share

          Tech Rally Showing Signs Of Fatigue, Supporting Rotation Trades

          Swissquote

          Commodity

          Stocks

          Forex

          Economic

          The year may have begun with ongoing trade tensions and fresh geopolitical uncertainties, questions around the legitimacy of Trump's actions — both on trade and geopolitical fronts — and persisting doubts over AI valuations, but none of this has been enough to prevent the bulls from pushing toward fresh records. The S&P 500 printed its first record high of the year — likely the first of another long series — the Dow Jones marked its second record high, and the Nasdaq advanced nearly 1% after dipping below its 50-DMA a few sessions ago.

          In the aftermath of the Venezuelan operation, the market's reaction has been largely muted — and even positive for a handful of sectors, including oil, defense stocks, rare earth metals (on potential retaliation risks from China), Bitcoin (amid speculation around a 600,000+ BTC shadow reserve Venezuela is believed to be sitting on), and precious metals. Importantly, flows into the latter appear to go beyond pure safe-haven demand, as investors showed little stress over Maduro's capture.

          What's next? While the immediate Venezuelan risk may now be behind us, the message is clear: the US is unlikely to stop here. Relations with NATO and Europe are already under strain over Greenland, which strengthens the case for maintaining — and even increasing — exposure to defense stocks. The STOXX Europe Aerospace & Defense ETF kicked off the year with a 7% jump, and there is likely more upside ahead.

          Metals — precious and industrial — also remain firmly in focus. Silver is seeing large fluctuations around the $80 mark, with the rally exacerbated by China's decision to restrict silver exports, in a similar fashion to rare earth metals. This policy took effect on January 1. From now on, each silver shipment requires government approval, and only large, state-approved companies meeting high production and compliance thresholds are allowed to export. Estimates suggest this could potentially halve China's export capacity, removing 4'500–5'000 tonnes from annual global supply — a meaningful amount given persistent supply deficits. Because Chinese refined silver represents a large share of globally tradable supply, these restrictions tighten the global pipeline and amplify volatility. The silver market is therefore facing a structural supply squeeze, which should, in theory, continue to support prices.

          Copper also hit a record high on Comex on Tuesday, driven by a different type of supply shock. A rush to ship copper into the US ahead of potential tariffs is draining supply elsewhere, leaving a hole in the global market and pushing prices higher — on top of an already constructive backdrop of strong demand and limited supply growth. Copper, too, remains one of the hottest trades at the moment and still has room to extend gains. In both cases, US dollar softness is providing additional support to the bulls.

          The main risk here is that once tariff front-running fades, some of that supply dislocation could unwind — or that a sharp rebound in the US dollar could take some heat out of the move.

          Speaking of the US dollar, the greenback reversed Asian losses yesterday and closed the session on a bullish note. It is lower again in Asia this morning, highlighting a lack of directional consensus between Eastern and Western trading hours. In the absence of a major macro catalyst, part of yesterday's move likely reflected softer-than-expected inflation and PMI data. The European Central Bank (ECB) appears to have gained control over inflation, with aggregate CPI expected to have slowed to around 2% in December (final data due this morning). From here, any further slowdown in economic growth could revive the need for additional support, and easing price pressures would give the ECB more room to act. This dynamic pushed the EURUSD below the 1.17 mark yesterday, where the pair is currently consolidating.

          In Australia, inflation also fell to a three-month low, yet the AUDUSD is rising nonetheless, supported by firm metal and energy prices that continue to attract capital inflows.

          Elsewhere, tech appetite is weaker in Asia this morning. Memory-chip makers are pulling back after strong gains in the first few sessions of the year, the Korean Kospi is giving back early advances, and SoftBank is down around 1.5%. The move follows Nvidia's failure to reignite investor enthusiasm at CES, despite Nvidia's CEO Jensen Huang announcing that its Rubin chips are nearing shipment, the CFO improving its bullish revenue outlook on strong demand, and the company unveiling its Alpamayo platform — a push into physical AI that opens new revenue avenues. Alas, investors remain focused on stretched valuations, heavy leverage and the circular nature of AI-related deals. xAI has just closed a $20bn funding round, with Nvidia among the backers.

          It increasingly feels like good news is no longer generating the same euphoria seen over the past three years. The tech rally is showing signs of fatigue, supporting rotation trades — a trend further reinforced by geopolitical headlines. Tech-light European and UK indices have started the year outperforming their tech-heavy US peers, with scope for further catch-up given lower valuations and their more cyclical exposure.

          Zooming out, the macro backdrop remains supportive for equities (particularly cyclicals). The Federal Reserve (Fed) is expected to cut rates several times this year, while falling inflation elsewhere continues to strengthen the hand of central-bank doves globally.

          This week, the US will release its latest jobs data, with the ADP report today expected to show fewer than 50k job additions last month. A weakening labour market has been a key factor behind the Fed's willingness to look past inflation risks and refocus on employment. The US 2-year yield remains below the 3.50% mark, and Fed funds futures currently price roughly a 50-50 chance of a March rate cut.

          Further weakness in labour data would reinforce this narrative and support rate-cut expectations, while stronger-than-expected figures could quickly revive the hawks.

          But, but, but… It is worth noting that the inflation leg of US data remains blurred, as recent releases were distorted by statistical issues and failed to provide a clear signal on underlying price dynamics. The fact that inflation is easing elsewhere has given investors some reassurance that US price pressures are also likely under control, allowing the Fed to focus on jobs. However, should inflation unexpectedly re-accelerate, rate-cut expectations could be rapidly repriced.

          Source: Swissquote Bank SA

          To stay updated on all economic events of today, please check out our Economic calendar
          Risk Warnings and Disclaimers
          You understand and acknowledge that there is a high degree of risk involved in trading. Following any strategies or investment methods may lead to potential losses. The content on the site is provided by our contributors and analysts for information purposes only. You are solely responsible for determining whether any trading assets, securities, strategy, or any other product is suitable for investing based on your own investment objectives and financial situation.
          Add to Favorites
          Share

          China Boosts Gold Reserves for 14th Consecutive Month

          John Adams

          Data Interpretation

          Economic

          Commodity

          Central Bank

          China's central bank has expanded its gold holdings for the 14th straight month, a move that highlights sustained official demand for bullion even as prices climb to record highs.

          According to data released Wednesday, the People's Bank of China (PBOC) added 30,000 troy ounces of gold to its reserves last month. This latest acquisition brings the central bank's total purchases to approximately 1.35 million ounces, or 42 tons, since it began this buying cycle in November 2024.

          Gold's Market Performance and Key Drivers

          The final month of 2025 was a volatile period for gold. The precious metal surged to a new record price before pulling back, ultimately delivering its best annual performance since 1979.

          This impressive run was fueled by several key factors:

          • Persistent central bank buying: Official sector demand remains a core pillar of support for the market.

          • Geopolitical uncertainty: Global tensions have increased gold's appeal as a safe-haven asset.

          • Debasement concerns: Investors have been moving away from sovereign bonds and national currencies toward alternative stores of value like gold.

          Global Central Banks Join the Gold Rush

          The trend extends far beyond China. Research from the World Gold Council published Tuesday revealed that central banks globally bought nearly as much gold in late 2025 as they did in the first eight months of the year combined.

          This data underscores how official institutions continue to view bullion as a critical hedge against the U.S. dollar, solidifying their role as a major force supporting gold prices into the new year.

          Questions Over Official Purchase Data

          While the official figures are significant, the true scale of the PBOC's gold purchases may be even larger. Multiple estimates suggest that the actual amount of gold being acquired by China is higher than what is formally reported.

          For instance, Goldman Sachs Group estimated that China added 15 tons of gold to its reserves in September. This figure stands in sharp contrast to the roughly 1 ton officially disclosed by the country for the same month.

          To stay updated on all economic events of today, please check out our Economic calendar
          Risk Warnings and Disclaimers
          You understand and acknowledge that there is a high degree of risk involved in trading. Following any strategies or investment methods may lead to potential losses. The content on the site is provided by our contributors and analysts for information purposes only. You are solely responsible for determining whether any trading assets, securities, strategy, or any other product is suitable for investing based on your own investment objectives and financial situation.
          Add to Favorites
          Share

          Japanese Stocks Underperform Following China Imposing Export Controls

          Justin

          Stocks

          Political

          Economic

          Markets

          A huge block sale in the federal funds futures market yesterday offered some entertainment during an otherwise quiet trading session. The record-sized 200k single wager stands to benefit if the market prices out the remaining odds – currently around 17% – for a Fed rate cut at the January 28 policy meeting. It's therefore not a coincidence the bet was made yesterday, ahead of key US economic data to be released as final input to that gathering.

          That starts today with JOLTS vacancies (November), the ADP job report (December) and the services ISM (December) and ends with the December payrolls on Friday. ADP job creation is seen at 50k, recovering from November's unexpected 32k drop while the services ISM should hold fairly steady around 52.2. After three consecutive Fed rate cuts (Sep-Oct-Dec), markets in our view correctly so assume a break in the normalization cycle. We think it'll take huge downside surprises in today's data and ultimately in Friday's payrolls for markets to flip their current thinking.

          Market's timing for a resumption of rate cuts, right now June, could shift though, even in less outspoken data misses. In any case we don't expect technical breaks to occur in US yields or the dollar today. The 2-yr tenor is supported by the October '25 low of 3.37%. The 10-yr maturity is struggling near first resistance around 4.2%. EUR/USD is currently changing hands in the middle of the 1.14-1.19 trading range in place since last summer. DXY is holding a similar position in the 96-100 range.

          Moves in other FI parts of the market showed some modest gains for Bunds. Yields grinded around 3 bps lower, with regional inflation numbers kickstarting the move and proximity of resistances zones (eg. 2.9% in the 10-yr) supporting some return action as well. They hinted at a downside surprise in the national inflation print, which eventually came in at 0.2% m/m and 2%, missing the 0.4% and 2.2% bar.

          Together with a slight French miss (0.1% m/m vs 0.2%, 0.7% y/y as expected), they pose some minor downside risks to today's European-wide release. The bar is set at 0.2% m/m and 2% y/y. Even if that would occur, there's no reason for the ECB to act. Future CPI releases will likely see inflation dropping below the 2% goal due to (energy) base effects. But policymakers the last couple of months repeatedly warned that the ECB is to look through small and temporary deviations from target. Supply today consists of Germany's second tap this week (10-yr) along with Belgium launching a new 10-yr syndicated benchmark deal. Stock markets after a strong start of 2026 seem to be catching a breather today. Japanese stocks this morning underperform following China imposing export controls over a feud regarding Japanese PM Takaichi's Taiwan comments (see below).

          News & Views

          Overall Australian price growth was unchanged in November (0% M/M) with the annual figure falling somewhat more than hoped, from 3.8% Y/Y to 3.4% Y/Y (vs 3.6% consensus). The largest contributor to annual inflation in November was housing, up 5.2%. This was followed by food and non-alcoholic beverages, up 3.3%, and transport, which rose 2.7%. Trimmed mean inflation, which ignores the most volatile price swings and is the central bank's preferred measure for core inflation, showed prices rising by 0.3% M/M and 3.2% Y/Y (from 3.3%). Annual goods inflation slowed from 3.8% Y/Y to 3.3% Y/Y mainly because of electricity prices (19.7% Y/Y from +37.1% Y/Y). Services inflation slowed from 3.9% Y/Y to 3.6% Y/Y due to domestic holiday travel. Today's lower inflation print doesn't alter the market view that the RBA will be raising its policy rate by the May policy meeting. The Aussie dollar extends its (commodity-driven) good run against USD with AUD/USD moving above 0.6750 for the first time since October 2024.

          The Japanese foreign ministry reacted to yesterday's announcement of Chinese export controls for items destined for Japan that could have military uses. Broad estimates suggest that dual-use items (commercial & military) total over 40% of total Japanese goods imports from China. Japan's Chief Cabinet Secretary Kihara said that the measures only target Japan and deviate significantly from international practice. Tensions between both countries rise high since end November when PM Takaichi suggested that Japan could use military action if China uses force to try and seize Taiwan.

          Source: KBC Bank

          To stay updated on all economic events of today, please check out our Economic calendar
          Risk Warnings and Disclaimers
          You understand and acknowledge that there is a high degree of risk involved in trading. Following any strategies or investment methods may lead to potential losses. The content on the site is provided by our contributors and analysts for information purposes only. You are solely responsible for determining whether any trading assets, securities, strategy, or any other product is suitable for investing based on your own investment objectives and financial situation.
          Add to Favorites
          Share
          FastBull
          Copyright © 2026 FastBull Ltd

          728 RM B 7/F GEE LOK IND BLDG NO 34 HUNG TO RD KWUN TONG KLN HONG KONG

          TelegramInstagramTwitterfacebooklinkedin
          App Store Google Play Google Play
          Products
          Charts

          Chats

          Q&A with Experts
          Screeners
          Economic Calendar
          Data
          Tools
          Membership
          Features
          Function
          Markets
          Copy Trading
          Latest Signals
          Contests
          News
          Analysis
          24/7
          Columns
          Education
          Company
          Careers
          About Us
          Contact Us
          Advertising
          Help Center
          Feedback
          User Agreement
          Privacy Policy
          Personal Information Protection Statement
          Business

          White Label

          Data API

          Web Plug-ins

          Poster Maker

          Affiliate Program

          Risk Disclosure

          The risk of loss in trading financial instruments such as stocks, FX, commodities, futures, bonds, ETFs and crypto can be substantial. You may sustain a total loss of the funds that you deposit with your broker. Therefore, you should carefully consider whether such trading is suitable for you in light of your circumstances and financial resources.

          No decision to invest should be made without thoroughly conducting due diligence by yourself or consulting with your financial advisors. Our web content might not suit you since we don't know your financial conditions and investment needs. Our financial information might have latency or contain inaccuracy, so you should be fully responsible for any of your trading and investment decisions. The company will not be responsible for your capital loss.

          Without getting permission from the website, you are not allowed to copy the website's graphics, texts, or trademarks. Intellectual property rights in the content or data incorporated into this website belong to its providers and exchange merchants.

          Not Logged In

          Log in to access more features

          FastBull Membership

          Not yet

          Purchase

          Become a signal provider
          Help Center
          Customer Service
          Dark Mode
          Price Up/Down Colors

          Log In

          Sign Up

          Position
          Layout
          Fullscreen
          Default to Chart
          The chart page opens by default when you visit fastbull.com