• Trade
  • Markets
  • Copy
  • Contests
  • News
  • 24/7
  • Calendar
  • Q&A
  • Chats
Screeners
SYMBOL
LAST
ASK
BID
HIGH
LOW
NET CHG.
%CHG.
SPREAD
SPX
S&P 500 Index
6915.62
6915.62
6915.62
6932.95
6895.49
+2.26
+ 0.03%
--
DJI
Dow Jones Industrial Average
49098.70
49098.70
49098.70
49265.46
48963.05
-285.30
-0.58%
--
IXIC
NASDAQ Composite Index
23501.23
23501.23
23501.23
23610.74
23374.26
+65.22
+ 0.28%
--
USDX
US Dollar Index
96.880
96.960
96.880
97.120
96.730
-0.350
-0.36%
--
EURUSD
Euro / US Dollar
1.18669
1.18677
1.18669
1.18975
1.18441
+0.00388
+ 0.33%
--
GBPUSD
Pound Sterling / US Dollar
1.36700
1.36710
1.36700
1.36824
1.36427
+0.00270
+ 0.20%
--
XAUUSD
Gold / US Dollar
5074.98
5075.36
5074.98
5085.61
5003.35
+88.53
+ 1.78%
--
WTI
Light Sweet Crude Oil
60.997
61.032
60.997
61.179
60.514
-0.108
-0.18%
--

Community Accounts

Signal Accounts
--
Profit Accounts
--
Loss Accounts
--
View More

Become a signal provider

Sell trading signals to earn additional income

View More

Guide to Copy Trading

Get started with ease and confidence

View More

Signal Accounts for Members

All Signal Accounts

Best Return
  • Best Return
  • Best P/L
  • Best MDD
Past 1W
  • Past 1W
  • Past 1M
  • Past 1Y

All Contests

  • All
  • Trump Updates
  • Recommend
  • Stocks
  • Cryptocurrencies
  • Central Banks
  • Featured News
Top News Only
Share

South Korean Won Rises As Much As 1.3% To 1443.20 Per USA Dollar

Share

China Deputy Central Bank Governor Says Will Continue To Promote Market Interconnection Between Mainland And Hong Kong

Share

New York Silver Futures Rose Above $108 Per Ounce, Up 6.58% On The Day

Share

NBS: Cn Mid-Jan Hog Prices Rise 3.2% From Previous 10-Day Period, Lithium Iron Phosphate Price Hikes 8.4%

Share

Spot Silver Continued Its Upward Trend, Rising Nearly 5% To A New All-time High Of $107.99 Per Ounce

Share

China's CSI Sh-Sz-HK Gold Industry Index Set To Open Up Nearly 4%

Share

Cn 2025 RMB-Denominated FDI Sinks 9.5% Year On Year, Down For 3 Straight Yrs

Share

Shanghai Benchmark Butadiene Rubber Futures Rise More Than 3.5%

Share

Spot Palladium Rises 3% To $2076.93/Oz

Share

China's Central Bank Sets Yuan Mid-Point At 6.9843 / Dlr Versus Last Close 6.9630

Share

New York Silver Futures Surged 6.00% Intraday, Currently Trading At $107.43 Per Ounce

Share

The Main Shanghai Silver Futures Contract Surged 14.00% Intraday, Currently Trading At 27,639.00 Yuan/kg

Share

The Platinum Futures Contract Rose By 9% Intraday, Currently Trading At 742.5 Yuan/gram. The Palladium Futures Contract Rose By 8.00% Intraday, Currently Trading At 539.00 Yuan/gram. The Lithium Carbonate Futures Contract Rose By Over 6.00% Intraday, Currently Trading At 187,980 Yuan/ton

Share

U.S. Natural Gas Futures Extended Gains To 18%, Reaching $6.28 Per Million British Thermal Units (MMBtu)

Share

[Bitcoin Surges Above $87,000] January 26Th, According To Htx Market Data, Bitcoin Has Rebounded Above $87,000, Now Trading At $87,284.Ethereum Has Rebounded Above $2,850, Now Priced At $2,866;Sol Has Risen Above $120, Now Priced At $121

Share

Shfe Most Active Tin Contract Rises More Than 9%

Share

Malaysia's January 1-25 Palm Oil Exports Rise 10%

Share

[France Moves Forward To Ban Social Media Use On Children Under 15] French President Emmanuel Macron Stated On The 24th That France Is Accelerating The Legislative Process To Ban The Use Of Social Media By Children Under 15, Aiming For The Legislation To Take Effect When The School Year Begins In September. Macron Has Repeatedly Stated That Social Media Is One Of The Reasons For The Increase In Youth Violence. The Relevant Bill Is Expected To Be Submitted To The National Assembly For Review On The 26th

Share

Yield On 30-Year Japanese Government Bond Falls 3.5 Basis Points To 3.605%

Share

Spot Silver Broke Through The $107/ounce Mark For The First Time, With Intraday Gains Widening To 3.6%, And A Cumulative Increase Of Over $35 This Month

TIME
ACT
FCST
PREV
U.K. Retail Sales MoM (SA) (Dec)

A:--

F: --

P: --

France Manufacturing PMI Prelim (Jan)

A:--

F: --

P: --

France Services PMI Prelim (Jan)

A:--

F: --

P: --

France Composite PMI Prelim (SA) (Jan)

A:--

F: --

P: --

Germany Manufacturing PMI Prelim (SA) (Jan)

A:--

F: --

P: --

Germany Services PMI Prelim (SA) (Jan)

A:--

F: --

P: --

Germany Composite PMI Prelim (SA) (Jan)

A:--

F: --

P: --

Euro Zone Composite PMI Prelim (SA) (Jan)

A:--

F: --

P: --

Euro Zone Manufacturing PMI Prelim (SA) (Jan)

A:--

F: --

P: --

Euro Zone Services PMI Prelim (SA) (Jan)

A:--

F: --

P: --

U.K. Composite PMI Prelim (Jan)

A:--

F: --

P: --

U.K. Manufacturing PMI Prelim (Jan)

A:--

F: --

P: --

U.K. Services PMI Prelim (Jan)

A:--

F: --

P: --

Mexico Economic Activity Index YoY (Nov)

A:--

F: --

P: --

Russia Trade Balance (Nov)

A:--

F: --

P: --

Canada Core Retail Sales MoM (SA) (Nov)

A:--

F: --

P: --

Canada Retail Sales MoM (SA) (Nov)

A:--

F: --

P: --
U.S. IHS Markit Manufacturing PMI Prelim (SA) (Jan)

A:--

F: --

P: --

U.S. IHS Markit Services PMI Prelim (SA) (Jan)

A:--

F: --

P: --

U.S. IHS Markit Composite PMI Prelim (SA) (Jan)

A:--

F: --

P: --

U.S. UMich Consumer Sentiment Index Final (Jan)

A:--

F: --

P: --

U.S. UMich Current Economic Conditions Index Final (Jan)

A:--

F: --

P: --

U.S. UMich Consumer Expectations Index Final (Jan)

A:--

F: --

P: --

U.S. Conference Board Leading Economic Index MoM (Nov)

A:--

F: --

P: --

U.S. Conference Board Coincident Economic Index MoM (Nov)

A:--

F: --

P: --

U.S. Conference Board Lagging Economic Index MoM (Nov)

A:--

F: --

P: --

U.S. UMich 1-Year-Ahead Inflation Expectations Final (Jan)

A:--

F: --

P: --

U.S. Conference Board Leading Economic Index (Nov)

A:--

F: --

P: --

U.S. Weekly Total Rig Count

A:--

F: --

P: --

U.S. Weekly Total Oil Rig Count

A:--

F: --

P: --

Germany Ifo Business Expectations Index (SA) (Jan)

--

F: --

P: --

Germany IFO Business Climate Index (SA) (Jan)

--

F: --

P: --

Germany Ifo Current Business Situation Index (SA) (Jan)

--

F: --

P: --

U.S. Dallas Fed PCE Price Index YoY (Nov)

--

F: --

P: --

Brazil Current Account (Dec)

--

F: --

P: --

Mexico Unemployment Rate (Not SA) (Dec)

A:--

F: --

P: --

Canada National Economic Confidence Index

--

F: --

P: --

U.S. Non-Defense Capital Durable Goods Orders MoM (Excl. Aircraft) (Nov)

--

F: --

P: --

U.S. Durable Goods Orders MoM (Excl. Defense) (SA) (Nov)

--

F: --

P: --

U.S. Durable Goods Orders MoM (Excl.Transport) (Nov)

--

F: --

P: --

U.S. Durable Goods Orders MoM (Nov)

--

F: --

P: --

U.S. Chicago Fed National Activity Index (Nov)

--

F: --

P: --

U.S. Dallas Fed New Orders Index (Jan)

--

F: --

P: --

U.S. Dallas Fed General Business Activity Index (Jan)

--

F: --

P: --

U.K. BRC Shop Price Index YoY (Jan)

--

F: --

P: --

China, Mainland Industrial Profit YoY (YTD) (Dec)

--

F: --

P: --

Mexico Trade Balance (Dec)

--

F: --

P: --

U.S. S&P/CS 20-City Home Price Index YoY (Not SA) (Nov)

--

F: --

P: --

U.S. S&P/CS 20-City Home Price Index MoM (SA) (Nov)

--

F: --

P: --

U.S. FHFA House Price Index MoM (Nov)

--

F: --

P: --

U.S. FHFA House Price Index (Nov)

--

F: --

P: --

U.S. Richmond Fed Manufacturing Composite Index (Jan)

--

F: --

P: --

U.S. Conference Board Present Situation Index (Jan)

--

F: --

P: --

U.S. Conference Board Consumer Expectations Index (Jan)

--

F: --

P: --

U.S. Richmond Fed Manufacturing Shipments Index (Jan)

--

F: --

P: --

U.S. Richmond Fed Services Revenue Index (Jan)

--

F: --

P: --

U.S. Conference Board Consumer Confidence Index (Jan)

--

F: --

P: --

Australia RBA Trimmed Mean CPI YoY (Q4)

--

F: --

P: --

Australia CPI YoY (Q4)

--

F: --

P: --

Australia CPI QoQ (Q4)

--

F: --

P: --

Q&A with Experts
    • All
    • Chatrooms
    • Groups
    • Friends
    oscar flag
    @SykingMine is a cracked version, so it doesn't cost any money.
    Ali AFAIK flag
    oscar flag
    @Syking
    oscar flag
    oscar flag
    I have this too.
    3126500 flag
    Gold
    Syking flag
    What is this?
    Sanjeev Ku flag
    3126500
    Gold
    @Visitor3126500 yeh heading 5088/5108. CMP 5067
    3432164 flag
    big change in china explode gold price
    3448911 flag
    hand
    3422803 flag
    Price Arrived On Line Sell_4: 5073.27 On : XAUUSD
    3448911 flag
    yes, it rises really strong
    Invisible Trader flag
    3422803
    Price Arrived On Line Sell_4: 5073.27 On : XAUUSD
    @Visitor3422803no sell bastard , don't spread lies here
    Sanjeev Ku flag
    Sanjeev Ku
    5067 to 5085.50 .high so far
    marsgents flag
    100$less in 3 hours🤣
    awang darm flag
    sooooo
    marsgents flag
    ifan afian
    over extend this gold is scary, the price is too extreme
    @ifan afiancan still go up again🤣
    3448911 flag
    mantaaap
    marsgents flag
    5169 tomorrow?
    awang darm flag
    Is there a special group for Indonesians?
    Type here...
    Add Symbol or Code

      No matching data

      All
      Trump Updates
      Recommend
      Stocks
      Cryptocurrencies
      Central Banks
      Featured News
      • All
      • Russia-Ukraine Conflict
      • Middle East Flashpoint
      • All
      • Russia-Ukraine Conflict
      • Middle East Flashpoint
      Search
      Products

      Charts Free Forever

      Chats Q&A with Experts
      Screeners Economic Calendar Data Tools
      Membership Features
      Data Warehouse Market Trends Institutional Data Policy Rates Macro

      Market Trends

      Market Sentiment Order Book Forex Correlations

      Top Indicators

      Charts Free Forever
      Markets

      News

      News Analysis 24/7 Columns Education
      From Institutions From Analysts
      Topics Columnists

      Latest Views

      Latest Views

      Trending Topics

      Top Columnists

      Latest Update

      Signals

      Copy Rankings Latest Signals Become a signal provider AI Rating
      Contests
      Brokers

      Overview Brokers Assessment Rankings Regulators News Claims
      Broker listing Forex Brokers Comparison Tool Live Spread Comparison Scam
      Q&A Complaint Scam Alert Videos Tips to Detect Scam
      More

      Business
      Events
      Careers About Us Advertising Help Center

      White Label

      Data API

      Web Plug-ins

      Affiliate Program

      Awards Institution Evaluation IB Seminar Salon Event Exhibition
      Vietnam Thailand Singapore Dubai
      Fans Party Investment Sharing Session
      FastBull Summit BrokersView Expo
      Recent Searches
        Top Searches
          Markets
          News
          Analysis
          User
          24/7
          Economic Calendar
          Education
          Data
          • Names
          • Latest
          • Prev

          View All

          No data

          Scan to Download

          Faster Charts, Chat Faster!

          Download App
          English
          • English
          • Español
          • العربية
          • Bahasa Indonesia
          • Bahasa Melayu
          • Tiếng Việt
          • ภาษาไทย
          • Français
          • Italiano
          • Türkçe
          • Русский язык
          • 简中
          • 繁中
          Open Account
          Search
          Products
          Charts Free Forever
          Markets
          News
          Signals

          Copy Rankings Latest Signals Become a signal provider AI Rating
          Contests
          Brokers

          Overview Brokers Assessment Rankings Regulators News Claims
          Broker listing Forex Brokers Comparison Tool Live Spread Comparison Scam
          Q&A Complaint Scam Alert Videos Tips to Detect Scam
          More

          Business
          Events
          Careers About Us Advertising Help Center

          White Label

          Data API

          Web Plug-ins

          Affiliate Program

          Awards Institution Evaluation IB Seminar Salon Event Exhibition
          Vietnam Thailand Singapore Dubai
          Fans Party Investment Sharing Session
          FastBull Summit BrokersView Expo

          Why Singapore's MAS Will Likely Hold Policy Steady

          Nathaniel Wright

          Central Bank

          Remarks of Officials

          Traders' Opinions

          Economic

          Forex

          Summary:

          Singapore's central bank is set to maintain its monetary policy amid robust growth and controlled inflation, though some analysts anticipate future tightening.

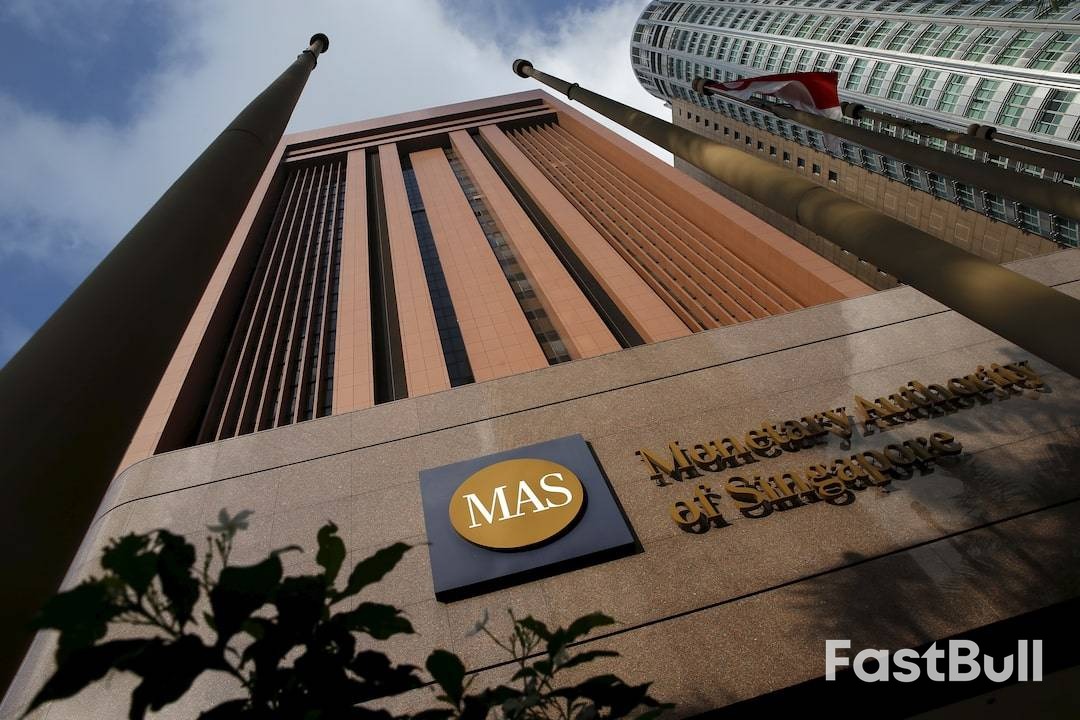
          The Monetary Authority of Singapore (MAS) is widely expected to maintain its current monetary policy settings at its upcoming review, as a strong economic outlook and controlled inflation reduce the need for immediate adjustments.

          A Reuters poll shows a strong consensus, with 15 out of 16 analysts predicting the central bank will stand pat. This follows two previous decisions to hold policy steady in July and October of last year, which came after easing measures in January and April.

          Figure 1: The Monetary Authority of Singapore (MAS) is expected to keep its policy settings unchanged, supported by a robust economic backdrop.

          Robust Growth Anchored by Semiconductor Boom

          Singapore's economy is performing better than anticipated, providing a solid foundation for the MAS to maintain its current stance. The country's GDP grew by 4.8% in 2025, significantly outpacing the government's earlier forecast of around 4.0% and its initial estimate of 1.5% to 2.5%.

          A key driver of this performance is the technology sector. Tay Qi Hang, an analyst at the Economist Intelligence Unit Asia, pointed to the strong electronics purchasing managers' index reading of 50.9 in December as evidence of sustained momentum. He noted that growing demand related to artificial intelligence and rising memory chip prices are set to benefit the semiconductor industry in the coming months.

          "The Q4 2025 growth outperformance coupled with stable core inflation at just above 1% in November has reduced near-term pressure to ease," said Tay.

          Analysts Eye Potential Tightening Ahead

          While the immediate outlook points to a steady policy, some analysts are looking ahead to potential tightening. Standard Chartered chief economist Edward Lee stated there is no urgency for the MAS to act this month with inflation under control. However, he anticipates a policy tightening at the April review, citing a bottoming out of the inflation cycle and easing trade uncertainties.

          A more hawkish view comes from Bank of America economists, who suggested in a report that the MAS could tighten policy as soon as this week. Their reasoning is based on signs of strengthening inflation from December's data, where price increases for travel-related components offset declines in raw food and beverage prices.

          These economists project that the MAS might raise its core inflation forecast for 2026 to a range of 1% to 2%, up from its current forecast of 0.5% to 1.5%. The central bank will release its updated inflation forecasts in its upcoming monetary policy statement.

          How Singapore Manages Its Monetary Policy

          Unlike many central banks that use interest rates, the MAS manages monetary conditions by adjusting the exchange rate of the Singapore dollar. It allows the local dollar to move against a trade-weighted basket of currencies within an undisclosed band, known as the Singapore dollar nominal effective exchange rate (S$NEER).

          The MAS has three main tools to adjust its policy:

          • The slope of the policy band, which sets the pace of appreciation.

          • The mid-point, which anchors the band's center.

          • The width of the band, which determines the volatility of the exchange rate.

          Global Central Banks Also in a Holding Pattern

          Singapore's expected policy stability aligns with a broader global trend. Major central banks are largely predicted to hold rates steady in the near term.

          The U.S. Federal Reserve, for instance, cut interest rates by 25 basis points at its December meeting but signaled a pause to assess the job market, inflation, and the overall economy. This stance has drawn criticism from U.S. President Donald Trump, who has repeatedly called for more aggressive rate cuts from Fed chair Jerome Powell.

          Similarly, the European Central Bank's chief economist, Philip Lane, indicated in January that the bank will not debate any rate changes in the near future if the economy continues on its current path.

          To stay updated on all economic events of today, please check out our Economic calendar
          Risk Warnings and Disclaimers
          You understand and acknowledge that there is a high degree of risk involved in trading. Following any strategies or investment methods may lead to potential losses. The content on the site is provided by our contributors and analysts for information purposes only. You are solely responsible for determining whether any trading assets, securities, strategy, or any other product is suitable for investing based on your own investment objectives and financial situation.
          Add to Favorites
          Share

          Canada Scraps China FTA After Trump Tariff Threat

          Isaac Bennett

          Remarks of Officials

          Political

          Economic

          China–U.S. Trade War

          Canadian Prime Minister Mark Carney has officially halted plans for a comprehensive free trade agreement (FTA) with China, a major strategic shift in North American trade policy. The move comes in direct response to a threat from former U.S. President Donald Trump to levy 100% tariffs on Canadian exports if Ottawa moved forward with the Beijing negotiations.

          The announcement, first reported by Solidintel, signals a critical turning point for Canada’s economic and foreign policy, forcing the nation to prioritize its relationship with the United States over deeper ties with China.

          Why Canada Halted Free Trade Talks with China

          The Carney administration has suspended all formal discussions on an FTA with China, reversing years of exploratory talks. The government’s new focus is on strengthening existing trade partnerships, citing the paramount need to maintain stable economic relations within North America. This strategic retreat also reflects the broader geopolitical realignments reshaping global trade.

          While Canada's bilateral trade with China previously reached about $100 billion annually, several persistent challenges have prevented deeper economic integration:

          • Security Risks: Concerns over cybersecurity and the protection of intellectual property have remained a major hurdle.

          • Human Rights: Ongoing diplomatic disagreements have strained the relationship.

          • Supply Chain Vulnerabilities: The pandemic exposed the risks of over-reliance on single sources for critical goods.

          • U.S. Relations: Preserving privileged access to the massive American market remains Canada's top economic priority.

          The 100% Tariff Threat: Trump's Decisive Intervention

          Former President Donald Trump’s warning, delivered via Truth Social, fundamentally changed the Canadian government's calculations. His threat to impose 100% tariffs on Canadian goods promised severe economic consequences, prompting urgent impact assessments in Ottawa.

          The potential damage would be catastrophic for Canada’s export-driven economy, with key sectors facing complete disruption. Projections indicated devastating impacts:

          • Automotive: The $50 billion export market to the U.S. would face total collapse.

          • Agriculture: A potential wave of farm bankruptcies could hit the $30 billion sector.

          • Energy: The $80 billion energy export industry would likely see pipeline projects canceled.

          • Manufacturing: The $40 billion sector would face the risk of massive job losses.

          A Geopolitical Trilemma for Canadian Trade Policy

          Trade experts agree that Canada was caught in an exceptionally difficult position. Dr. Sarah Chen, Director of the North American Trade Institute, described the situation as a "classic geopolitical trilemma." She explained that Canada cannot simultaneously maintain full sovereignty, pursue an independent trade deal with China, and preserve its privileged market access to the United States.

          This dilemma is not new. The previous Trudeau administration had also explored diversifying trade toward China, particularly after difficult USMCA renegotiations. However, shifting global dynamics and consistent pressure from the U.S. under both the Biden and Trump administrations have made that strategy increasingly unfeasible. Trump's explicit ultimatum simply forced the issue to a head.

          Canada's New Playbook: Diversifying Beyond China

          In response, the Carney government is rolling out a multi-pronged alternative strategy designed to build domestic resilience and diversify its trade partnerships beyond both the U.S. and China.

          The new approach focuses on several parallel initiatives:

          • CPTPP Enhancement: Deepening trade ties with partners in the Comprehensive and Progressive Agreement for Trans-Pacific Partnership.

          • EU-Canada CETA: Expanding the existing comprehensive economic agreement with the European Union.

          • UK-Canada FTA: Finalizing a post-Brexit trade deal with the United Kingdom.

          • ASEAN Engagement: Building stronger economic connections with Southeast Asian nations.

          • Domestic Innovation: Investing in Canada's technological sovereignty to reduce external dependencies.

          This diversified strategy aims to mitigate the risks of dependency on any single market while aligning Canada with broader Western economic security goals.

          Beijing's Measured Response and the Future of Bilateral Ties

          Beijing has reacted to Canada's decision with measured disappointment. Chinese officials have reiterated their interest in comprehensive trade deals but acknowledged the geopolitical realities complicating the negotiations. For now, existing trade between the two countries will continue under current frameworks.

          The Canada-China relationship is now entering a new phase of pragmatic, but limited, engagement. Cooperation is expected to continue in areas of mutual interest, such as:

          • Climate change and green technology

          • Educational and research collaborations

          • Limited agricultural and resource trade

          • Coordination in multilateral forums

          However, the prospect of comprehensive economic integration is officially off the table, highlighting the complex challenges middle powers face while navigating great power competition in 2025.


          Frequently Asked Questions

          What was Carney's announcement on the China FTA?

          Prime Minister Carney confirmed that Canada has suspended plans for a comprehensive free trade agreement with China. This decision was a direct result of former President Trump's threat to impose 100% tariffs on Canadian goods if the deal proceeded.

          How severe would Trump's proposed tariffs be?

          The proposed 100% tariffs would devastate key Canadian industries, including the automotive, agriculture, energy, and manufacturing sectors. Economic models predicted a potential GDP contraction of 3-5% and widespread job losses.

          Is Canada-China trade ending completely?

          No. Existing trade will continue under current agreements and frameworks. The decision specifically cancels negotiations for a new, comprehensive FTA that would have significantly deepened economic integration.

          What is Canada's new trade strategy?

          Canada is now focused on diversifying its trade relationships. This includes strengthening existing deals like CETA (with the EU) and the CPTPP, finalizing a new agreement with the UK, engaging more with ASEAN countries, and boosting domestic innovation.

          Could Canada restart FTA talks with China later?

          While possible, experts believe that structural geopolitical factors make a comprehensive trade deal with China unlikely for Canada in the medium term, regardless of who is in office in the United States.

          To stay updated on all economic events of today, please check out our Economic calendar
          Risk Warnings and Disclaimers
          You understand and acknowledge that there is a high degree of risk involved in trading. Following any strategies or investment methods may lead to potential losses. The content on the site is provided by our contributors and analysts for information purposes only. You are solely responsible for determining whether any trading assets, securities, strategy, or any other product is suitable for investing based on your own investment objectives and financial situation.
          Add to Favorites
          Share

          Canada Defies Trump's 100% Tariff Threat Over China Deal

          Isaac Bennett

          China–U.S. Trade War

          Political

          Economic

          Remarks of Officials

          Canada is holding its ground on a trade diversification strategy, refusing to alter its course despite escalating pressure from Washington and a direct tariff threat from U.S. President Donald Trump. Foreign Minister Anita Anand confirmed the government will continue its push to reduce economic reliance on the United States, signaling that external pressure will not dictate its trade policy.

          The core message from Ottawa is clear: its plan to seek new global partners remains firmly in place.

          Trump Vows 100% Tariffs Over Canada-China EV Pact

          The diplomatic friction intensified after President Donald Trump, the 47th U.S. president, issued a sharp warning on social media. Targeting Prime Minister Mark Carney, Trump threatened to impose a 100% tariff on all Canadian goods if the country becomes a "drop off port" for Chinese exports destined for the American market.

          This threat was a direct response to a new agreement between Canada and China. Under the deal, Canada agreed to lower its tariffs on a limited number of Chinese electric vehicles in exchange for China easing its own restrictions on Canadian food exports, including canola and beef.

          Ottawa's Strategy: Diversify Trade, Reduce US Reliance

          In response, Foreign Minister Anand pushed back, clarifying that Canada is not negotiating a comprehensive free trade agreement with Beijing. She framed the government's actions as a matter of economic necessity, not ideology.

          The government's stated goal is to double its non-U.S. exports within a decade. "We need to protect and empower the Canadian economy, and trade diversification is fundamental to that," Anand stated. "That is why we went to China, that's why we will be going to India, and that is why we won't put all our eggs in one basket."

          This strategy is already in motion. Energy Minister Tim Hodgson is traveling to Goa, India, for an energy conference, where he is scheduled to meet with officials from Indian industry and Prime Minister Narendra Modi's government. Discussions are expected to focus on cooperation in critical minerals, uranium, and liquefied natural gas—resources Canada possesses in large quantities. Prime Minister Carney also plans to visit India soon, with a subsequent trip to Australia scheduled for March.

          The Deep Economic Ties Behind the Dispute

          Despite the recent tension, Anand emphasized that the relationship with Washington remains strong and is expected to continue that way. The economic partnership between the two nations is massive. In the first ten months of last year, the U.S. exported approximately $280 billion in goods to Canada, more than to any other country. During the same period, U.S. imports from Canada totaled $322 billion, according to Commerce Department data.

          The automotive sector is the backbone of this relationship, with manufacturing supply chains deeply integrated across the border. This integration is precisely why Canada's EV deal with China, which allows just 49,000 vehicles per year, struck a nerve in Washington.

          "We have a highly integrated market with Canada," U.S. Treasury Secretary Scott Bessent explained on ABC's This Week. "The goods can cross the border during the manufacturing process six times. And we can't let Canada become an opening that the Chinese pour their cheap goods into the US."

          Economists Weigh the Risk of a Full-Blown Trade War

          Analysts agree that the economic risk from a major trade rupture is not symmetrical. Canada's smaller, less diversified economy would be hit much harder.

          "If there were 100% tariffs on Canada, it would be a disaster," said Randall Bartlett, deputy chief economist at Desjardins Group. "I guess my question would be, what's the likelihood of that happening?"

          Bartlett noted that President Trump frequently issues tariff threats only to reverse his position later, suggesting the probability of full-scale tariffs is low.

          Meanwhile, Trump continued his social media commentary on Sunday, posting on Truth Social: "China is successfully and completely taking over the once Great Country of Canada. So sad to see it happen. I only hope they leave Ice Hockey alone!"

          To stay updated on all economic events of today, please check out our Economic calendar
          Risk Warnings and Disclaimers
          You understand and acknowledge that there is a high degree of risk involved in trading. Following any strategies or investment methods may lead to potential losses. The content on the site is provided by our contributors and analysts for information purposes only. You are solely responsible for determining whether any trading assets, securities, strategy, or any other product is suitable for investing based on your own investment objectives and financial situation.
          Add to Favorites
          Share

          Newsom's California: A Green Agenda Meets Economic Reality

          Isaac Bennett

          Energy

          Political

          Economic

          Remarks of Officials

          California, once nicknamed the "Golden State" for its 19th-century Gold Rush, long symbolized the American Dream—a place of ambition and prosperity. Today, however, the state is the center of a political experiment that increasingly mirrors European centralist ideology, with significant economic and social consequences.

          The contrast was on full display at this year's World Economic Forum in Davos. While U.S. President Donald Trump used his speech to declare EU-style, centrally planned climate policies a failure, California Governor Gavin Newsom offered a starkly different performance.

          The day after Trump’s address, Newsom, a potential Democratic presidential candidate, presented his counter-vision. In a move widely seen as bizarre, he accused Western leaders of a "pathetic" and cowardly response to the Trump administration. As a political prop, he carried bright red "Trump Signature Knee Pads," suggesting he should have brought a pair for every world leader present. This conduct raised questions about his seriousness as a statesman, especially as his own policies back home are creating deep economic and social challenges.

          California's European-Style Climate Agenda

          If California were a nation, it would be the world's fourth-largest economy. Governor Newsom, however, often seems to prioritize the role of a climate activist over that of a pragmatic governor.

          He has consistently attributed events like the 2024 wildfire disaster to climate change, using the immediate shock of catastrophe to push his policy agenda. Similarly, state-induced water shortages are framed as the result of extreme droughts caused by CO₂ emissions. This narrative loop reinterprets every major weather event as a climate catastrophe, sidelining normal conditions in a media-driven panic.

          Newsom’s approach extends beyond environmental policy. Under his leadership, California has become a hub for progressive social policies, often prioritizing gender politics and state control over individual autonomy. This shift away from the traditional American spirit of a minimal state mirrors the bureaucratic model of the European Union.

          Since Newsom took office in 2019, California has become the U.S. model for implementing a radical Green Deal. Regulatory codes for industry, agriculture, and transportation are structured much like Brussels' playbook, with a goal of eliminating CO₂ emissions by 2045.

          The Soaring Costs of a Green Transformation

          This green transformation, funded by debt and subsidies, has come at a staggering cost. Over the last three years, California's budget deficit has reached approximately $110 billion. The state's total debt, including unfunded social obligations, now stands at an estimated $1.8 trillion.

          Newsom's tenure has also seen the rise of a state-funded, privately managed system of homelessness care. The number of people managed by this social complex has surged tenfold to 180,000. Critics argue this system functions similarly to a network of immigrant-run daycares in Minnesota that created a tax-extraction model. In California, poverty is managed and monetized, with major beneficiaries often connected to the Democratic Party, creating a political donation machine to finance future campaigns.

          Despite these fiscal realities, Newsom continues to position himself as a savior of the American Dream, a message he delivered on the friendly turf of the WEF, where belief in a centrally planned Net-Zero economy remains strong.

          Tax Hikes and the Billionaire Exodus

          To delay an economic collapse, California is pursuing aggressive fiscal measures. Alongside heavy burdens on the middle class and businesses, a so-called "billionaire tax" is close to being enacted. This populist tool mirrors policies seen in Europe, where wealth taxes are used to assign blame for economic decay while distracting from its root causes.

          Newsom’s billionaire tax is seen by many as a Trojan horse. Initially proposed as a one-time plunder of the private wealth of roughly 200 California billionaires, it is expected to become a recurring levy. The proposal calls for a five percent tax on total net worth, payable at once or over five years.

          This policy ignores the fact that much of this capital is invested in companies that create jobs and fund the state's future. Newsom needs liquidity to fund the green transformation, especially as the Trump administration's deregulation of the energy sector is encouraging businesses to leave California for "Red States" that value market freedom.

          The state's billionaires have responded decisively:

          • Larry Page, former CEO of Alphabet/Google, is spinning off parts of his companies to Delaware.

          • Elon Musk relocated Tesla long ago.

          • Peter Thiel, co-founder of Palantir, is moving capital to Miami, Florida.

          • David Sachs of Craft Ventures has also left California for Austin, Texas.

          This industrial exodus is a direct boost for business locations that protect private property, a dynamic nearly identical to the one currently unfolding in Germany under similar policies.

          A Familiar Playbook for a New Socialism

          Like his European counterparts, Newsom uses media skirmishes with political opponents like Donald Trump to distract from economic decline, capital flight, and criticism of his misplaced priorities.

          The proposed solutions in both California and the EU follow a similar pattern of controlled "green socialism." This includes social scoring models based on carbon footprints, expansive censorship on social media, and digital central bank currencies that would grant the state total control over the private sector. The ultimate goal is to forcibly reshape society to fit a political ideology, regardless of the cost, using "woke" rhetoric to soften its brutal reality.

          To stay updated on all economic events of today, please check out our Economic calendar
          Risk Warnings and Disclaimers
          You understand and acknowledge that there is a high degree of risk involved in trading. Following any strategies or investment methods may lead to potential losses. The content on the site is provided by our contributors and analysts for information purposes only. You are solely responsible for determining whether any trading assets, securities, strategy, or any other product is suitable for investing based on your own investment objectives and financial situation.
          Add to Favorites
          Share

          Is a Global LNG Glut Coming? US Exports Break Records

          Daniel Foster

          Commodity

          Data Interpretation

          Traders' Opinions

          Political

          Russia-Ukraine Conflict

          Economic

          Energy

          As countries worldwide pour investment into expanding their liquid natural gas (LNG) production and export capacity, the market is bracing for a potential oversupply. With a record-breaking 2025 in the books and even more gas expected to come online in 2026, a critical question emerges: how much LNG is truly needed to bridge the gap during the global transition to renewable energy?

          The US Dominates the Global LNG Market

          Last year marked a historic peak for the LNG trade, with export volumes surpassing multiple industry forecasts. This expansion has been overwhelmingly led by the United States, which shipped over 100 million metric tonnes of LNG in 2025 as several new plants became operational.

          According to data analysis firm LSEG, the U.S. exported an estimated 111 million metric tonnes (mmt) in 2025. This figure represents a 23 mmt increase from the previous year and towers over the 20 mmt exported by Qatar, the world's second-largest supplier.

          U.S. shipments accounted for roughly 25% of all global LNG exports in 2025. A key contributor was the new Plaquemines facility, operated by Venture Global, which shipped a reported 16.4 mmt after starting operations in December 2024. In December alone, the U.S. set a monthly export record of 11.5 mmt.

          Jason Feer, head of business intelligence at shipping firm Poten and Partners, highlighted the rapid growth. "It is remarkable that in nine years the U.S. has gone from zero LNG exports to over 100 mmt," he stated, validating the American approach of selling free-on-board and the reliability of its supplies.

          Europe's Shift and the Risk of Oversupply

          While the U.S. ramped up its LNG capacity, initial fears of a market glut were offset by geopolitical events. Following sanctions on Russia after its 2022 invasion of Ukraine, many European nations urgently sought alternative gas suppliers. The United States was perfectly positioned to fill this void. In December alone, Europe purchased 9 mmt of LNG from the U.S. as it continued to reduce its reliance on Russian imports.

          However, this has created a new set of concerns. One is Europe's growing dependence on the United States, which could supply up to 80% of the region's LNG imports by 2030. At the same time, as Europe accelerates its own renewable energy development, fears of an LNG glut in 2026 and beyond are resurfacing.

          Supply Is Set to Surge, Squeezing Profit Margins

          The wave of new supply is far from over. The Plaquemines facility is expected to reach full production capacity this year. Meanwhile, Cheniere's smaller modular plants are set to hit their capacity, with potential for further expansion. The Golden Pass LNG project, a venture between QatarEnergy and ExxonMobil, is also slated to begin production this year. Combined, these projects could add another 20 mmt to annual U.S. LNG production.

          Looking further ahead, the International Energy Agency (IEA) projects that new LNG export capacity will increase by about 300 billion cubic meters per year between 2025 and 2030—a staggering 50% rise. The U.S. is expected to account for 45% of this growth.

          This flood of supply is expected to drive down profit margins. While this is welcome news for consumers facing high energy bills, it poses a challenge for producers. Saul Kavonic, head of energy research at MST Marquee, noted that while "U.S. LNG has made outstanding margins since late 2021," these have now returned to more normal levels.

          If margins fall further, producers may be forced to scale back production to support prices. Conversely, lower LNG prices could make the fuel more attractive compared to more expensive options like coal and oil, potentially boosting demand.

          The Long-Term Outlook for LNG Demand

          The exact timing of when LNG supply will definitively outpace global demand remains uncertain. However, a consensus among energy experts is that the world's appetite for LNG will continue to grow until 2050.

          This prediction marks a reversal from a previous IEA forecast, which suggested that demand for all fossil fuels would peak much sooner. The updated outlook reflects two key realities:

          • Several countries are failing to meet their renewable energy capacity goals.

          • Power demand is rising sharply, driven by the tech sector's plans for massive new data centers to fuel advancements in artificial intelligence.

          In 2026, the continued expansion of global LNG production is set to exert downward pressure on prices, potentially revealing the first signs of a supply glut. At the same time, global LNG demand will likely keep rising, buoyed by the tech sector's energy needs, until renewable sources can fully close the gap.

          To stay updated on all economic events of today, please check out our Economic calendar
          Risk Warnings and Disclaimers
          You understand and acknowledge that there is a high degree of risk involved in trading. Following any strategies or investment methods may lead to potential losses. The content on the site is provided by our contributors and analysts for information purposes only. You are solely responsible for determining whether any trading assets, securities, strategy, or any other product is suitable for investing based on your own investment objectives and financial situation.
          Add to Favorites
          Share

          Yen on High Alert After Japan's Intervention Warning

          Alexander

          Central Bank

          Remarks of Officials

          Traders' Opinions

          Political

          Economic

          Forex

          Foreign exchange traders are bracing for a volatile week after Japan’s government issued a clear signal that it may intervene to halt the yen's recent slide. Officials warned that speculative currency moves have gone too far, putting the market on notice for direct action.

          Prime Minister Takaichi Sanae stated that the government is prepared to act if trading becomes "speculative and abnormal." This comment immediately shifted market sentiment after weeks of one-sided bets against the Japanese currency.

          Tensions escalated late Friday when reports surfaced that the Federal Reserve Bank of New York had contacted financial institutions to inquire about the yen exchange rate. That move alone was enough to rattle traders. Earlier the same day, Japan’s top currency official had pointedly refused to confirm whether Tokyo had conducted its own rate check, deepening the uncertainty.

          Fed 'Rate Checks' Trigger Sharp Yen Rebound

          Talk of intervention intensified as news of the New York Fed’s calls spread. Michael Brown at Pepperstone noted that rate checks are often the final warning before authorities step into the market. He added that the Takaichi administration has shown less tolerance for speculative currency moves than previous governments.

          This message forced a rapid reassessment among traders who had accumulated massive short positions on the yen, which had grown to their largest level in over a decade. The currency reacted violently, reversing a decline and surging by as much as 1.75% to 155.63 per dollar. The move marked the yen's biggest single-day gain since August, catching many short sellers off guard.

          Tokyo's Firm Line on 'Abnormal' Market Moves

          Prime Minister Takaichi reiterated her stance during a televised debate on Sunday. While acknowledging that exchange rates are determined by the market, she emphasized that "all necessary steps would be taken to deal with speculative and highly abnormal moves."

          Although she did not specify a market, officials have recently highlighted risks associated with both the yen and Japanese government bond yields. The bond market had already flashed warning signs last week, with yields on the longest-dated bonds jumping to record highs before retreating. This convergence of currency volatility and rising debt costs has increased pressure on policymakers.

          Nick Twidale of AT Global Markets advised caution ahead of Monday's trading open, suggesting the yen could trade near the 155-per-dollar level, a new focal point after last week's sharp reversal.

          Is Coordinated US-Japan Intervention on the Table?

          The yen’s recovery began shortly after Bank of Japan Governor Kazuo Ueda's press conference on Friday. It gained momentum during the U.S. trading session as Wall Street interpreted the Fed’s rate checks as a precursor to a possible joint intervention. Some traders even began pricing in the possibility of U.S. participation.

          Twidale noted that while the underlying desire to short the yen remains, traders will proceed with caution given the official warnings. He stressed that confirmed U.S. involvement would have significant ripple effects across global markets.

          This has led to comparisons with the 1985 Plaza Accord, where major economies coordinated to weaken the U.S. dollar. According to New York Fed data, the U.S. has only intervened in currency markets three times since 1996. The most recent instance was in 2011, when G7 nations jointly sold the yen to stabilize markets following Japan's earthquake.

          Anthony Doyle at Pinnacle Investment Management argued that Japan would struggle to support the yen alone without causing domestic or global fallout, making coordination a more viable strategy. He said that inquiries from the U.S. Treasury typically indicate the situation has escalated beyond routine market fluctuations.

          Politics and Key Price Levels to Watch

          Japan has a recent history of direct intervention, having spent nearly $100 billion buying yen in 2024. Those four interventions all occurred near the 160 yen-per-dollar level, establishing it as an unofficial line in the sand.

          Homin Lee at Lombard Odier said that authorities must take real action to anchor the USD/JPY exchange rate, noting that a joint move by Japan and the U.S. would be a powerful signal of direct coordination.

          Political factors are also at play. Lee pointed out that 160 is a psychologically important level ahead of Japan's snap lower-house election scheduled for February 8. Prime Minister Takaichi's campaign pledge to cut food taxes has already unsettled the debt market, pushing the 40-year bond yield above 4% for the first time since its introduction in 2007.

          To stay updated on all economic events of today, please check out our Economic calendar
          Risk Warnings and Disclaimers
          You understand and acknowledge that there is a high degree of risk involved in trading. Following any strategies or investment methods may lead to potential losses. The content on the site is provided by our contributors and analysts for information purposes only. You are solely responsible for determining whether any trading assets, securities, strategy, or any other product is suitable for investing based on your own investment objectives and financial situation.
          Add to Favorites
          Share

          How the United States Has Retained Leverage Over Iraq’s Oil Revenues for More Than Two Decades

          Gerik

          Political

          The Post-2003 Financial Architecture

          More than twenty years after the U.S.-led invasion, Iraq’s oil revenues remain deeply embedded in a financial framework shaped by Washington. Following the collapse of Saddam Hussein’s government in 2003, the Coalition Provisional Authority established the Development Fund for Iraq, with all oil export revenues deposited into an account at the Federal Reserve Bank of New York. This arrangement was formalized through an executive order signed by George W. Bush and renewed by every subsequent U.S. administration.
          Over time, the Development Fund was transformed into an account formally held by the Central Bank of Iraq at the Federal Reserve. While Iraqi authorities regained administrative control over budget execution, the location of these funds ensured that ultimate oversight of oil-derived dollar flows remained in U.S. hands. Given that oil revenues account for roughly 90% of Iraq’s state budget, this structure created a persistent channel of influence.

          Why Oil Revenue Custody Matters

          The significance of this arrangement lies not in ownership of the oil itself, but in control over the financial system that converts crude exports into usable dollars. By hosting Iraq’s reserves, Washington retains the ability to monitor, delay, or restrict access to funds. This leverage has translated directly into political influence. In 2020, when Baghdad called for the withdrawal of U.S. troops, officials cited by Reuters reported that Washington considered limiting Iraq’s access to its account at the Fed, after which Iraq’s stance softened.
          According to Toby Dodge of the London School of Economics, this mechanism represents a form of soft power comparable in effect to military presence. By influencing liquidity, imports, and currency stability, the United States can shape economic outcomes without direct intervention.

          Stability Benefits And Hidden Trade-Offs

          The arrangement has not been without advantages for Iraq. Iraqi officials have acknowledged to Reuters that holding reserves at the Fed helps maintain international confidence, facilitates access to dollars for trade, and shields oil revenues from legal claims by creditors linked to the pre-2003 era. The International Monetary Fund noted in a 2023 report that this custody framework supported exchange-rate stability and reduced systemic risk while Iraq’s banking sector remained fragile.
          However, these benefits come with structural constraints. As U.S. authorities intensified scrutiny of dollar flows to enforce sanctions against Iran, Iraq found itself increasingly exposed. Washington expanded oversight and imposed penalties on Iraqi banks accused of allowing dollars to reach sanctioned entities, effectively tightening control over Iraq’s financial arteries.

          The Dollar Auction And Market Distortions

          For years, the Central Bank of Iraq relied on daily dollar auctions to supply foreign currency to the economy. Under U.S. pressure, this mechanism was terminated in early 2025, marking a major shift in Iraq’s monetary operations. While the move aimed to curb illicit dollar leakage, it also reduced the availability of official dollars, contributing to a widening gap between the official exchange rate and the black-market rate.
          This development illustrates a clear causal relationship between external financial control and domestic economic stress. As official dollar access shrank, parallel markets expanded, raising transaction costs, fueling inflation, and eroding household purchasing power.

          Why Iraq Cannot Easily Break Free

          Despite growing political emphasis on economic sovereignty, analysts argue that a clean break from the Fed-centered system is unlikely in the near term. Iraq’s economy remains heavily dependent on oil exports priced in dollars, and alternative reserve arrangements would struggle to offer comparable legal protection and market credibility.
          Energy analyst Ben Cahill has argued that as long as Iraq relies on oil and the dollar-based global financial system, it will continue to accept a trade-off between stability and autonomy. The current framework, while limiting sovereignty, provides predictability in an otherwise volatile regional environment.

          A Legacy Of War That Still Shapes The Present

          The U.S. grip on Iraq’s oil revenues is not simply a technical financial arrangement but a lasting legacy of the 2003 invasion. By embedding Iraq’s most vital income stream within the U.S. financial system, Washington secured a form of influence that has endured long after troop levels declined.
          Today, control over oil revenues functions as a quiet but powerful constraint on Iraqi policymaking. It demonstrates how modern power is often exercised not through territory or troops, but through financial infrastructure that continues to shape state behavior decades after the original conflict has ended.
          Risk Warnings and Disclaimers
          You understand and acknowledge that there is a high degree of risk involved in trading. Following any strategies or investment methods may lead to potential losses. The content on the site is provided by our contributors and analysts for information purposes only. You are solely responsible for determining whether any trading assets, securities, strategy, or any other product is suitable for investing based on your own investment objectives and financial situation.
          Add to Favorites
          Share
          FastBull
          Copyright © 2026 FastBull Ltd

          728 RM B 7/F GEE LOK IND BLDG NO 34 HUNG TO RD KWUN TONG KLN HONG KONG

          TelegramInstagramTwitterfacebooklinkedin
          App Store Google Play Google Play
          Products
          Charts

          Chats

          Q&A with Experts
          Screeners
          Economic Calendar
          Data
          Tools
          Membership
          Features
          Function
          Markets
          Copy Trading
          Latest Signals
          Contests
          News
          Analysis
          24/7
          Columns
          Education
          Company
          Careers
          About Us
          Contact Us
          Advertising
          Help Center
          Feedback
          User Agreement
          Privacy Policy
          Personal Information Protection Statement
          Business

          White Label

          Data API

          Web Plug-ins

          Poster Maker

          Affiliate Program

          Risk Disclosure

          The risk of loss in trading financial instruments such as stocks, FX, commodities, futures, bonds, ETFs and crypto can be substantial. You may sustain a total loss of the funds that you deposit with your broker. Therefore, you should carefully consider whether such trading is suitable for you in light of your circumstances and financial resources.

          No decision to invest should be made without thoroughly conducting due diligence by yourself or consulting with your financial advisors. Our web content might not suit you since we don't know your financial conditions and investment needs. Our financial information might have latency or contain inaccuracy, so you should be fully responsible for any of your trading and investment decisions. The company will not be responsible for your capital loss.

          Without getting permission from the website, you are not allowed to copy the website's graphics, texts, or trademarks. Intellectual property rights in the content or data incorporated into this website belong to its providers and exchange merchants.

          Not Logged In

          Log in to access more features

          Connect Broker
          Become a signal provider
          Help Center
          Customer Service
          Dark Mode
          Price Up/Down Colors

          Log In

          Sign Up

          Position
          Layout
          Fullscreen
          Default to Chart
          The chart page opens by default when you visit fastbull.com