


- GBPUSD
- XAUUSD
- XAGUSD
- WTI
- USDX


Markets
Analysis
User
24/7
Economic Calendar
Education
Data
- Names
- Latest
- Prev


Russia offers China unprecedented oil discounts as India exits, testing China's absorption limits amid shifting energy flows.
Russian oil exporters are offering crude to China at record-breaking discounts as they scramble to secure demand from the world's top importer. The price cuts come as sellers anticipate losing India, another major customer, leaving China as the primary destination for their discounted barrels.
This strategic pivot follows the announcement of a trade agreement between U.S. President Donald Trump and Indian Prime Minister Narendra Modi, which reportedly includes a halt to India's Russian oil purchases. While details remain scarce, the potential shift has sent ripples through the energy market, forcing Russian suppliers to sweeten their deals for Chinese buyers.
With Western sanctions already pressuring demand from India, a formal halt in purchases would amplify Russia's reliance on China and increase the volume of its oil held in floating storage.
Analysts at JPMorgan, led by Natasha Kaneva, project that even with a new trade deal, India will likely maintain Russian crude imports at a level of 800,000 to 1 million barrels per day (bpd). This represents 17-21% of its total crude imports but is a significant drop from the peak of around 2 million bpd in June of last year.
In a February 4 note, the analysts wrote, "China, especially Shandong's independent refiners, are the main beneficiaries of this trend — absorbing most displaced Russian barrels and boosting margins, runs, and strategic stockpiles thanks to deep discounts and supportive domestic policy."
The price incentives for Chinese refiners have grown substantially, making Russian crude exceptionally competitive. According to trade sources, the discounts have widened significantly in recent weeks:
• ESPO Blend: Crude delivered from the Pacific port of Kozmino now sells at a discount of nearly $9 a barrel to ICE Brent, up from $7–$8 in previous months.
• Urals Grade: This grade, typically exported from the Baltics to India, is being offered at a discount of about $12 per barrel, with traders suggesting prices could fall even further.
"Chinese buyers have been benefiting from multi-year low discounts on Russian crude in recent months, to the extent that some have even reduced Iranian intake in order to absorb more Russian barrels," said Vortexa analyst Emma Li. "Given that India's pullback is likely to trigger even deeper discounts, this behaviour is likely to continue in the near term."
The primary buyers of this sanctioned oil are China's independent refiners, often called "teapots." In January, Russian oil volumes flowing into Shandong province, a major teapot hub, reached record highs. Meanwhile, China's state-owned refiners have avoided seaborne Russian crude since October after the U.S. sanctioned major producers Rosneft and Lukoil.
Despite the aggressive discounts, traders and analysts believe China's capacity to absorb Russian oil may be reaching its limit, especially as long as state refiners remain on the sidelines.
Data from analytics firm Kpler shows China's seaborne imports of Russian crude hit a record 1.7 million bpd in January. During the same period, India's imports fell to 1.1 million bpd, its lowest level since November 2022. OilX reported a similar figure for China's January imports at 1.64 million bpd, the highest since March 2024.
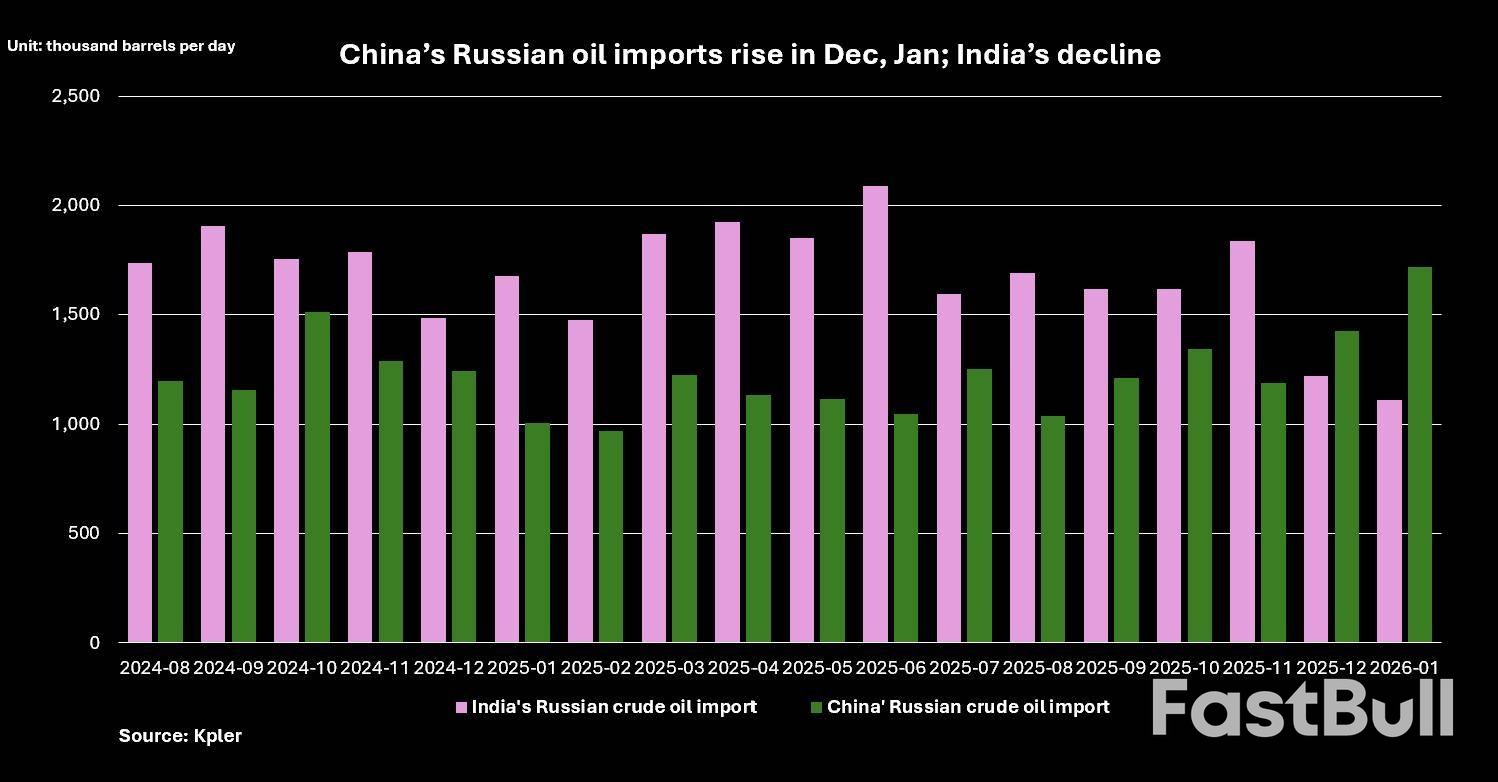
However, analysts caution that China's independent refineries simply do not have enough capacity to take on all the excess Russian supply.
"Amid rising onshore inventory, we expect Russian seaborne flows to China to decrease from March, following elevated levels of Jan-Feb 2026," said Sun Jianan, a senior analyst with Energy Aspects.
Vortexa's Li added, "Without re-engagement from the state-owned majors, Russia is still facing an oversupplied market despite strong teapot absorption."
Still, some potential for increased demand exists. CNPC is reportedly planning to restart a unit at its refinery in the northeastern city of Dalian around mid-year, a move that could capitalize on the high margins offered by discounted Russian crude.

728 RM B 7/F GEE LOK IND BLDG NO 34 HUNG TO RD KWUN TONG KLN HONG KONG





The risk of loss in trading financial instruments such as stocks, FX, commodities, futures, bonds, ETFs and crypto can be substantial. You may sustain a total loss of the funds that you deposit with your broker. Therefore, you should carefully consider whether such trading is suitable for you in light of your circumstances and financial resources.
No decision to invest should be made without thoroughly conducting due diligence by yourself or consulting with your financial advisors. Our web content might not suit you since we don't know your financial conditions and investment needs. Our financial information might have latency or contain inaccuracy, so you should be fully responsible for any of your trading and investment decisions. The company will not be responsible for your capital loss.
Without getting permission from the website, you are not allowed to copy the website's graphics, texts, or trademarks. Intellectual property rights in the content or data incorporated into this website belong to its providers and exchange merchants.
Not Logged In
Log in to access more features


Log In
Sign Up


