• Trade
  • Markets
  • Copy
  • Contests
  • News
  • 24/7
  • Calendar
  • Q&A
  • Chats
Trending
Screeners
SYMBOL
LAST
BID
ASK
HIGH
LOW
NET CHG.
%CHG.
SPREAD
SPX
S&P 500 Index
6819.37
6819.37
6819.37
6861.30
6801.50
-8.04
-0.12%
--
DJI
Dow Jones Industrial Average
48383.25
48383.25
48383.25
48679.14
48285.67
-74.79
-0.15%
--
IXIC
NASDAQ Composite Index
23112.07
23112.07
23112.07
23345.56
23012.00
-83.09
-0.36%
--
USDX
US Dollar Index
97.960
98.040
97.960
98.070
97.740
+0.010
+ 0.01%
--
EURUSD
Euro / US Dollar
1.17442
1.17451
1.17442
1.17686
1.17262
+0.00048
+ 0.04%
--
GBPUSD
Pound Sterling / US Dollar
1.33695
1.33702
1.33695
1.34014
1.33546
-0.00012
-0.01%
--
XAUUSD
Gold / US Dollar
4302.75
4303.16
4302.75
4350.16
4285.08
+3.36
+ 0.08%
--
WTI
Light Sweet Crude Oil
56.371
56.401
56.371
57.601
56.233
-0.862
-1.51%
--

Community Accounts

Signal Accounts
--
Profit Accounts
--
Loss Accounts
--
View More

Become a signal provider

Sell trading signals to earn additional income

View More

Guide to Copy Trading

Get started with ease and confidence

View More

Signal Accounts for Members

All Signal Accounts

Best Return
  • Best Return
  • Best P/L
  • Best MDD
Past 1W
  • Past 1W
  • Past 1M
  • Past 1Y

All Contests

  • All
  • Trump Updates
  • Recommend
  • Stocks
  • Cryptocurrencies
  • Central Banks
  • Featured News
Top News Only
Share

Turkey: Shoots Down A Drone In The Black Sea Using F-16 Fighter Jets

Share

Goldman Sachs Says They Believe That The Copper Price Is Vulnerable To An Ai-Linked Price Correction

Share

Goldman Sachs Upgrades 2026 Copper Price Forecast To $11400 From $10,650

Share

Attempts By Ukrainian Troops To Advance From The South-West To Outskirts Of Kupiansk Are Being Thwarted

Share

Russian Troops Control All Of Kupiansk - IFX Cites Russian Military

Share

On Monday (December 15), The South Korean Won Ultimately Rose 0.60% Against The US Dollar, Closing At 1468.91 Won. The Won Was On An Upward Trend Throughout The Day, Rising Significantly At 17:00 Beijing Time And Reaching A Daily High Of 1463.04 Won At 17:36

Share

Health Ministry: Israeli Forces Kill Palestinian Teen In West Bank

Share

New York Federal Reserve President Williams: Over Time, The Size Of Reserves Could Grow From $2.9 Trillion

Share

New York Fed President Williams: AI Valuations Are High, But There Is A Real Driving Factor

Share

New York Federal Reserve President Williams: The Job Market Is In Very Good Shape

Share

New York Fed President Williams: 'Very Supportive' Of USA Central Bank's Decision To Cut Interest Rates Last Week

Share

New York Fed President Williams: 'Too Early To Say' What Central Bank Should Do At January Meeting

Share

New York Fed President Williams: Strong Markets Part Of Reason Why Economy Will Grow Robustly In 2026

Share

New York Fed President Williams: What Constitutes Ample Reserves Will Change Over Time

Share

New York Fed President Williams: Market Valuations 'Elevated,' But There Are Reasons For Pricing

Share

New York Fed President Williams: Ample Reserves System Working Very Well

Share

New York Fed President Williams: Some Signs That Parts Of Underlying Economy Not As Strong As GDP Data Suggests

Share

New York Fed President Williams: Expects Coming Job Data Will Show Gradual Cooling

Share

Ukraine President Zelenskiy: Monitoring Of Ceasefire Should Be Part Of Security Guarantees

Share

Ukraine President Zelenskiy: Ukraine Needs Clear Understanding On Security Guarantees Before Taking Any Decisions Regarding Frontlines

TIME
ACT
FCST
PREV
Japan Tankan Small Manufacturing Outlook Index (Q4)

A:--

F: --

P: --

Japan Tankan Large Non-Manufacturing Outlook Index (Q4)

A:--

F: --

P: --

Japan Tankan Large Manufacturing Outlook Index (Q4)

A:--

F: --

P: --

Japan Tankan Small Manufacturing Diffusion Index (Q4)

A:--

F: --

P: --

Japan Tankan Large-Enterprise Capital Expenditure YoY (Q4)

A:--

F: --

P: --

U.K. Rightmove House Price Index YoY (Dec)

A:--

F: --

P: --

China, Mainland Industrial Output YoY (YTD) (Nov)

A:--

F: --

P: --

China, Mainland Urban Area Unemployment Rate (Nov)

A:--

F: --

P: --

Saudi Arabia CPI YoY (Nov)

A:--

F: --

P: --

Euro Zone Industrial Output YoY (Oct)

A:--

F: --

P: --

Euro Zone Industrial Output MoM (Oct)

A:--

F: --

P: --

Canada Existing Home Sales MoM (Nov)

A:--

F: --

P: --

Canada National Economic Confidence Index

A:--

F: --

P: --

Canada New Housing Starts (Nov)

A:--

F: --

P: --
U.S. NY Fed Manufacturing Employment Index (Dec)

A:--

F: --

P: --

U.S. NY Fed Manufacturing Index (Dec)

A:--

F: --

P: --

Canada Core CPI YoY (Nov)

A:--

F: --

P: --

Canada Manufacturing Unfilled Orders MoM (Oct)

A:--

F: --

P: --

U.S. NY Fed Manufacturing Prices Received Index (Dec)

A:--

F: --

P: --

U.S. NY Fed Manufacturing New Orders Index (Dec)

A:--

F: --

P: --

Canada Manufacturing New Orders MoM (Oct)

A:--

F: --

P: --

Canada Core CPI MoM (Nov)

A:--

F: --

P: --

Canada Trimmed CPI YoY (SA) (Nov)

A:--

F: --

P: --

Canada Manufacturing Inventory MoM (Oct)

A:--

F: --

P: --

Canada CPI YoY (Nov)

A:--

F: --

P: --

Canada CPI MoM (Nov)

A:--

F: --

P: --

Canada CPI YoY (SA) (Nov)

A:--

F: --

P: --

Canada Core CPI MoM (SA) (Nov)

A:--

F: --

P: --

Canada CPI MoM (SA) (Nov)

A:--

F: --

P: --

Federal Reserve Board Governor Milan delivered a speech
U.S. NAHB Housing Market Index (Dec)

A:--

F: --

P: --

Australia Composite PMI Prelim (Dec)

--

F: --

P: --

Australia Services PMI Prelim (Dec)

--

F: --

P: --

Australia Manufacturing PMI Prelim (Dec)

--

F: --

P: --

Japan Manufacturing PMI Prelim (SA) (Dec)

--

F: --

P: --

U.K. 3-Month ILO Employment Change (Oct)

--

F: --

P: --

U.K. Unemployment Claimant Count (Nov)

--

F: --

P: --

U.K. Unemployment Rate (Nov)

--

F: --

P: --

U.K. 3-Month ILO Unemployment Rate (Oct)

--

F: --

P: --

U.K. Average Weekly Earnings (3-Month Average, Including Bonuses) YoY (Oct)

--

F: --

P: --

U.K. Average Weekly Earnings (3-Month Average, Excluding Bonuses) YoY (Oct)

--

F: --

P: --

France Services PMI Prelim (Dec)

--

F: --

P: --

France Composite PMI Prelim (SA) (Dec)

--

F: --

P: --

France Manufacturing PMI Prelim (Dec)

--

F: --

P: --

Germany Services PMI Prelim (SA) (Dec)

--

F: --

P: --

Germany Manufacturing PMI Prelim (SA) (Dec)

--

F: --

P: --

Germany Composite PMI Prelim (SA) (Dec)

--

F: --

P: --

Euro Zone Composite PMI Prelim (SA) (Dec)

--

F: --

P: --

Euro Zone Services PMI Prelim (SA) (Dec)

--

F: --

P: --

Euro Zone Manufacturing PMI Prelim (SA) (Dec)

--

F: --

P: --

U.K. Services PMI Prelim (Dec)

--

F: --

P: --

U.K. Manufacturing PMI Prelim (Dec)

--

F: --

P: --

U.K. Composite PMI Prelim (Dec)

--

F: --

P: --

Euro Zone ZEW Economic Sentiment Index (Dec)

--

F: --

P: --

Germany ZEW Current Conditions Index (Dec)

--

F: --

P: --

Germany ZEW Economic Sentiment Index (Dec)

--

F: --

P: --

Euro Zone Trade Balance (Not SA) (Oct)

--

F: --

P: --

Euro Zone ZEW Current Conditions Index (Dec)

--

F: --

P: --

Euro Zone Trade Balance (SA) (Oct)

--

F: --

P: --

Euro Zone Total Reserve Assets (Nov)

--

F: --

P: --

U.K. Inflation Rate Expectations

--

F: --

P: --

Q&A with Experts
    • All
    • Chatrooms
    • Groups
    • Friends
    Connecting
    .
    .
    .
    Type here...
    Add Symbol or Code

      No matching data

      All
      Trump Updates
      Recommend
      Stocks
      Cryptocurrencies
      Central Banks
      Featured News
      • All
      • Russia-Ukraine Conflict
      • Middle East Flashpoint
      • All
      • Russia-Ukraine Conflict
      • Middle East Flashpoint
      Search
      Products

      Charts Free Forever

      Chats Q&A with Experts
      Screeners Economic Calendar Data Tools
      Membership Features
      Data Warehouse Market Trends Institutional Data Policy Rates Macro

      Market Trends

      Market Sentiment Order Book Forex Correlations

      Top Indicators

      Charts Free Forever
      Markets

      News

      News Analysis 24/7 Columns Education
      From Institutions From Analysts
      Topics Columnists

      Latest Views

      Latest Views

      Trending Topics

      Top Columnists

      Latest Update

      Signals

      Copy Rankings Latest Signals Become a signal provider AI Rating
      Contests
      Brokers

      Overview Brokers Assessment Rankings Regulators News Claims
      Broker listing Forex Brokers Comparison Tool Live Spread Comparison Scam
      Q&A Complaint Scam Alert Videos Tips to Detect Scam
      More

      Business
      Events
      Careers About Us Advertising Help Center

      White Label

      Data API

      Web Plug-ins

      Affiliate Program

      Awards Institution Evaluation IB Seminar Salon Event Exhibition
      Vietnam Thailand Singapore Dubai
      Fans Party Investment Sharing Session
      FastBull Summit BrokersView Expo
      Recent Searches
        Top Searches
          Markets
          News
          Analysis
          User
          24/7
          Economic Calendar
          Education
          Data
          • Names
          • Latest
          • Prev

          View All

          No data

          Scan to Download

          Faster Charts, Chat Faster!

          Download App
          English
          • English
          • Español
          • العربية
          • Bahasa Indonesia
          • Bahasa Melayu
          • Tiếng Việt
          • ภาษาไทย
          • Français
          • Italiano
          • Türkçe
          • Русский язык
          • 简中
          • 繁中
          Open Account
          Search
          Products
          Charts Free Forever
          Markets
          News
          Signals

          Copy Rankings Latest Signals Become a signal provider AI Rating
          Contests
          Brokers

          Overview Brokers Assessment Rankings Regulators News Claims
          Broker listing Forex Brokers Comparison Tool Live Spread Comparison Scam
          Q&A Complaint Scam Alert Videos Tips to Detect Scam
          More

          Business
          Events
          Careers About Us Advertising Help Center

          White Label

          Data API

          Web Plug-ins

          Affiliate Program

          Awards Institution Evaluation IB Seminar Salon Event Exhibition
          Vietnam Thailand Singapore Dubai
          Fans Party Investment Sharing Session
          FastBull Summit BrokersView Expo

          Trump: Strong Dollar Sounds Good But 'you Make A Hell Of A Lot More' With A Weaker One

          Devin

          Economic

          Summary:

           U.S. President Donald Trump said on Friday he liked a strong dollar but "you make a hell of a lot more money" with a weaker one.

          U.S. President Donald Trump said on Friday he liked a strong dollar but "you make a hell of a lot more money" with a weaker one.

          "So when we have a strong dollar, one thing happens: It sounds good. But you don't do any tourism. You can't sell tractors, you can't sell trucks, you can't sell anything," Trump said at the White House before leaving on a trip to Scotland.

          "It is good for inflation, that's about it."

          The dollar index (.DXY), opens new tab, which measures the greenback's strength against six major currencies, steadied on Friday after hitting two-week lows earlier in the week. It is still down roughly 10% over the six months Trump has been in office.

          Trump has often complained that dollar strength blunts U.S. export competitiveness and hurts U.S. manufacturing and jobs.

          Trump told reporters on Friday that manufacturers would be the first to benefit from a falling dollar, citing construction and mining equipment maker Caterpillar (CAT.N), opens new tab, whose shares have risen 16% over the last month.

          Japan and China fought for weaker currencies for decades and were able to dominate markets over the years, Trump said.

          "Now it doesn't sound good, but you make a hell of a lot more money with a weaker dollar - not a weak dollar but a weaker dollar - than you do with a strong dollar," he said.

          At the same time he acknowledged that pushing for a weaker dollar wasn't a good look, saying a strong dollar is good psychologically.

          "It makes you feel good," he said. "I love strong dollars."

          Source: Reuters

          To stay updated on all economic events of today, please check out our Economic calendar
          Risk Warnings and Disclaimers
          You understand and acknowledge that there is a high degree of risk involved in trading. Following any strategies or investment methods may lead to potential losses. The content on the site is provided by our contributors and analysts for information purposes only. You are solely responsible for determining whether any trading assets, securities, strategy, or any other product is suitable for investing based on your own investment objectives and financial situation.
          Add to Favorites
          Share

          OPEC+ panel likely to keep oil policy steady on Monday, sources say

          Adam

          Commodity

          An OPEC+ panel is unlikely to alter existing plans to raise oil output when it meets on Monday, four OPEC+ delegates said, noting the producer group is keen to recover market share while summer demand is helping to absorb the extra barrels.
          The meeting of the Joint Ministerial Monitoring Committee (JMMC), which includes top ministers from the Organization of the Petroleum Exporting Countries and allies led by Russia, is scheduled for 1200 GMT on Monday.
          Four OPEC+ sources told Reuters the meeting is unlikely to alter the group's existing policy, which calls for eight members to raise output by 548,000 barrels per day in August. Another source said it was too early to say.
          OPEC and the Saudi government communications office did not respond to a request for comment.
          OPEC+, which pumps about half of the world's oil, has been curtailing production for several years to support the market. But it reversed course this year to regain market share, and as U.S. President Donald Trump demanded OPEC pump more to help keep a lid on gasoline prices.
          The eight OPEC+ producers hold a separate meeting on August 3 and remain likely to agree to a further 548,000 bpd increase for September, three of the sources said, as reported by Reuters earlier this month.
          This would mean that, by September, OPEC+ will have unwound their most recent production cut of 2.2 million bpd, and the United Arab Emirates will have delivered a 300,000 bpd quota increase ahead of schedule.
          The JMMC meets every two months and can recommend changes to OPEC+ output policy.
          Oil prices have remained supported despite the OPEC+ increases thanks to summer demand and the fact that some members have not raised production as much as the headline quota hikes have called for. Brent crude was trading close to $70 a barrel on Friday.

          Source:Reuters

          Risk Warnings and Disclaimers
          You understand and acknowledge that there is a high degree of risk involved in trading. Following any strategies or investment methods may lead to potential losses. The content on the site is provided by our contributors and analysts for information purposes only. You are solely responsible for determining whether any trading assets, securities, strategy, or any other product is suitable for investing based on your own investment objectives and financial situation.
          Add to Favorites
          Share

          S&P500 Today: Consumer Discretionary and Financials Push US Stocks Toward Weekly Win

          Adam

          Stocks

          S&P 500 Extends Weekly Gains as Traders Eye Earnings Strength and Trade Hopes

          S&P500 Today: Consumer Discretionary and Financials Push US Stocks Toward Weekly Win_1Daily E-mini S&P 500 Index

          The S&P 500 added 0.3% mid-session Friday, set to notch its fourth straight weekly gain, bolstered by upbeat corporate earnings and cautious optimism surrounding global trade talks. The Nasdaq also rose 0.3%, while the Dow Jones Industrial Average advanced 92 points, or 0.2%.
          Week-to-date, the S&P 500 is up about 1.2%, slightly outperforming the Dow and Nasdaq, both tracking 1% higher.

          Are Sector Leaders Signaling Broader Market Strength?

          Consumer Discretionary led gains, climbing 0.62% as traders rotated back into growth names.
          Financials and Industrials each gained around 0.5%, showing resilience despite rate uncertainty.
          Technology rose 0.25%, lifted modestly after Thursday’s pullback in megacaps.
          Health Care, Materials, and Utilities saw mild advances under 0.3%, while Communication Services was flat.
          Defensive groups lagged, with Consumer Staples dipping 0.1% and Real Estate falling 0.32%.
          Energy dropped 0.6% as oil prices eased after a strong run earlier in the week.

          Which Stocks Are Fueling the S&P 500’s Momentum?

          S&P500 Today: Consumer Discretionary and Financials Push US Stocks Toward Weekly Win_2Daily Newmont Corporation
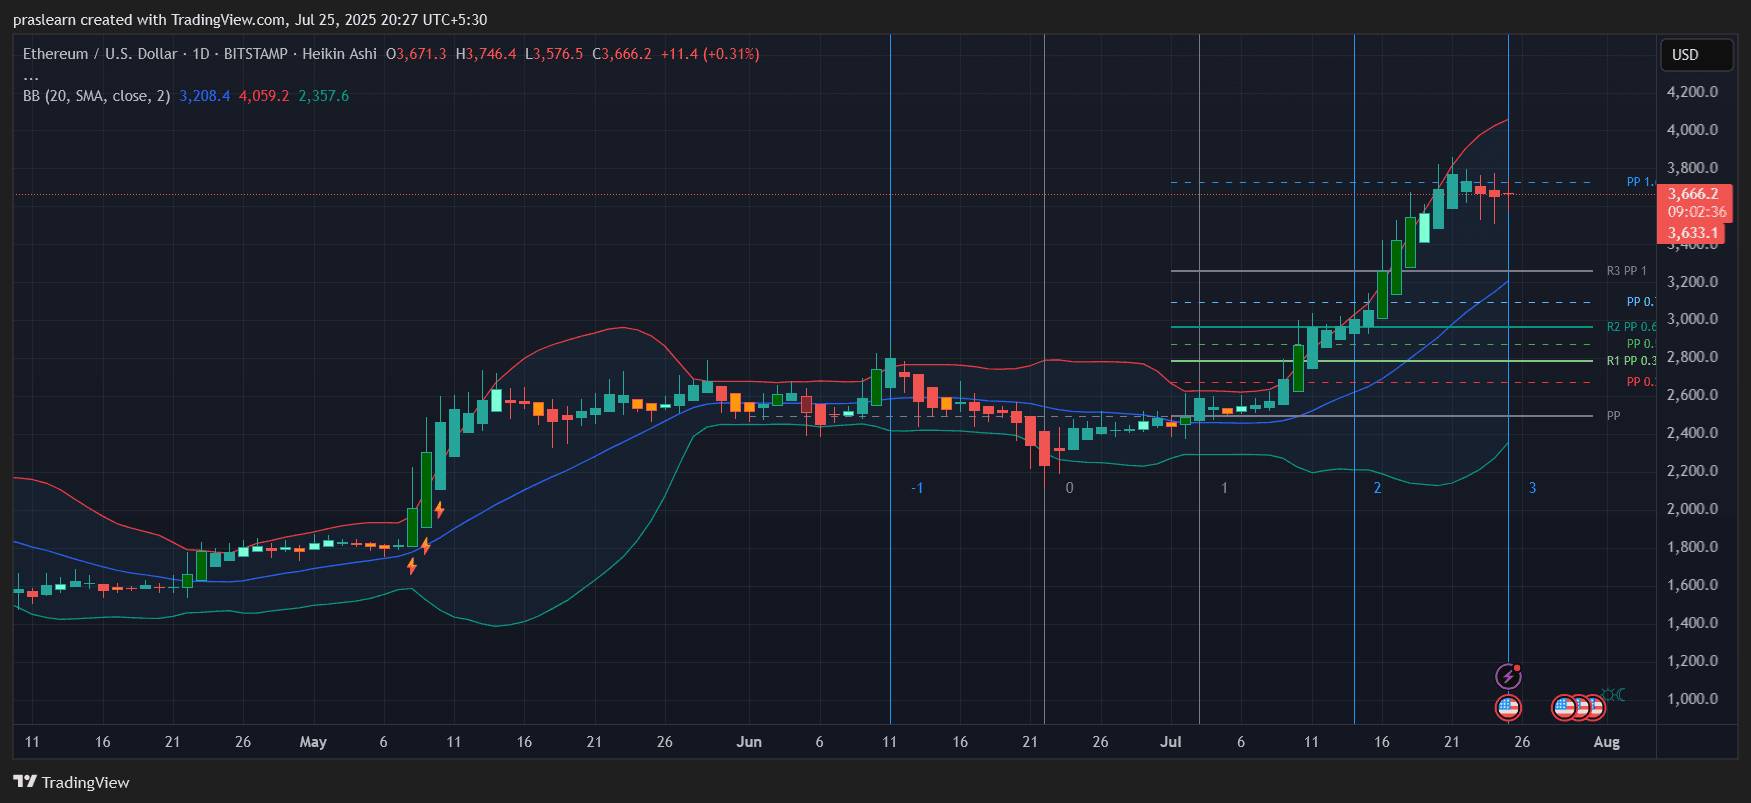
          Deckers Outdoor Corp surged over 12% following strong earnings, while Newmont Corporation jumped 6.5% on firmer gold prices and mining optimism. VeriSign and Aon also posted gains above 5%.
          Health care names like Edwards Lifesciences, Molina, and Elevance rose more than 3.5% as investors revisited managed care stocks.
          GE Vernova advanced nearly 4%, helping power Industrials higher.
          S&P500 Today: Consumer Discretionary and Financials Push US Stocks Toward Weekly Win_3

          Daily Charter Communications, Inc.

          On the downside, Charter Communications sank 16.6% following a disappointing outlook.
          Intel dropped over 9% after poor earnings, dragging semis. Comcast slid more than 5%, and West Pharmaceutical fell 4.3%.
          Other notable decliners included Textron, Bristol-Myers, and IQVIA, each shedding over 2.5%.

          What’s Driving Sentiment Outside the Earnings Stream?

          Traders also parsed comments from President Trump, who placed odds of a trade agreement with the EU at 50% and just 25% with Japan. The remarks, while cautious, offered hope for tariff relief and renewed demand.
          Meanwhile, crypto markets saw diverging flows—Bitcoin ETFs faced their first weekly outflows since early June, while Ether ETFs drew in over $1.3 billion this week, reflecting shifting sentiment in digital assets.

          What’s Next for Markets into Next Week?

          With earnings season peaking and the S&P 500 eyeing fresh highs, attention turns to the Federal Reserve’s upcoming policy meeting and key inflation data.
          Traders will look for signs of a potential rate pause or pivot. Short-term, momentum favors risk assets, but upside may hinge on how tech names rebound after this week’s mixed performance.
          Source: fxempire
          Risk Warnings and Disclaimers
          You understand and acknowledge that there is a high degree of risk involved in trading. Following any strategies or investment methods may lead to potential losses. The content on the site is provided by our contributors and analysts for information purposes only. You are solely responsible for determining whether any trading assets, securities, strategy, or any other product is suitable for investing based on your own investment objectives and financial situation.
          Add to Favorites
          Share

          EU And US Could Reach Trade Deal This Weekend - Reuters

          Thomas

          Economic

          The European Union and the United States might reach a framework trade deal this weekend that would end months of uncertainty for European industry, according to a report from Reuters, citing EU officials and diplomats on Friday.

          The potential agreement would likely include a 15% baseline tariff on all EU goods entering the United States, with European steel and aluminum facing a probable 50% tariff, these sources said.

          U.S. President Donald Trump expressed caution about the prospects, stating on Friday that there was a "50-50 chance or perhaps less" of reaching a trade agreement with the European Union. He added that Brussels wanted to "make a deal very badly."

          One source indicated that a weekend deal appeared likely as the "agreement is basically in the hands of Trump now."

          There might also be a high-level meeting to finalize terms, as a source familiar with the negotiations mentioned there was a "good chance" European Commission President Ursula von der Leyen would meet Trump in Scotland over the weekend.

          A spokesperson for the European Commission did not respond to multiple requests for comment regarding a possible meeting between the leaders.

          Source: Yahoo Finance

          To stay updated on all economic events of today, please check out our Economic calendar
          Risk Warnings and Disclaimers
          You understand and acknowledge that there is a high degree of risk involved in trading. Following any strategies or investment methods may lead to potential losses. The content on the site is provided by our contributors and analysts for information purposes only. You are solely responsible for determining whether any trading assets, securities, strategy, or any other product is suitable for investing based on your own investment objectives and financial situation.
          Add to Favorites
          Share

          EU's Von Der Leyen To Meet Trump In Bid To Clinch Trade Deal

          Daniel Carter

          Political

          European Commission President Ursula von der Leyen said she will travel to Scotland this weekend to meet with US President Donald Trump, as the two sides aim to conclude a trade deal ahead of an Aug. 1 deadline when 30% tariffs on the bloc's exports are otherwise due to kick in.
          After months of talks and shuttle diplomacy between Brussels and Washington DC, the two sides have been zeroing in on an agreement this past week that would see the EU face 15% tariffs on most of its trade. Limited exemptions are expected for aviation, some medical devices and generic medicines, several spirits, and a specific set of manufacturing equipment that the US needs, Bloomberg previously reported.
          Steel and aluminum imports would likely benefit from a quota under the arrangements under discussion but above that threshold they would face a higher tariff of 50%.
          Earlier on Friday, Trump said there was a 50:50 chance of a deal with the EU.
          Trump announced tariffs on almost all US trading partners in April, declaring his intent to bring back domestic manufacturing, to pay for a massive tax-cut extension and to stop the rest of the world from taking advantage of the US. He has also sought to remove what he describes as barriers for American companies to do business around the world.
          Alongside a universal levy, the US president has hit cars and auto parts with a 25% levy, and steel and aluminum with double that. He's also threatened to target pharmaceuticals and semiconductors with new duties as early as next month, and recently announced a 50% tariff on copper.
          The EU has been seeking quotas and a ceiling on future sectoral tariffs that the US has yet to implement but it's unclear if an initial agreement will shield the bloc from potential future levies at this stage.
          The agreement would also cover non-tariff barriers, cooperation on economic security matters and strategic purchases by the EU in sectors such as energy and artificial intelligence.

          Source: Bloomberg Europe

          Risk Warnings and Disclaimers
          You understand and acknowledge that there is a high degree of risk involved in trading. Following any strategies or investment methods may lead to potential losses. The content on the site is provided by our contributors and analysts for information purposes only. You are solely responsible for determining whether any trading assets, securities, strategy, or any other product is suitable for investing based on your own investment objectives and financial situation.
          Add to Favorites
          Share

          Is Ethereum Price About To Skyrocket?

          Thomas

          Cryptocurrency

          Ethereum price is once again in the spotlight. Not just because of its price action, but because institutional investors are finally showing their cards. The U.S. spot Ethereum ETFs have started pulling serious weight, and the charts are responding. So, what's the Ethereum price prediction?

          Ethereum Price Prediction: Why is Ethereum Price Heating Up?

          ETH/USD Daily Chart- TradingView

          Let’s look at the chart first. ETH price has been on a sharp uptrend since late June. The Heikin Ashi candles are clean, consecutive, and mostly bullish green. More importantly, the Ethereum price has stayed consistently above the mid-Bollinger Band, a sign of strong momentum. ETH price recently touched the upper Bollinger Band near $3750 and has since pulled back slightly to around $3660, suggesting a cooling phase after an overextended rally.

          But here's the thing. This isn't just a random move. Ethereum price cracked through key resistance levels like $3200 and $3400 with barely any hesitation. Pivot points show ETH is currently consolidating just under the R3 level. That’s usually the area where smart money decides whether to book profits or push for a breakout.

          If ETH price stays above the $3550 support, we could see a clean push toward $3900 and possibly $4200 in the coming weeks. On the downside, a drop below $3400 would indicate the bulls are exhausted, and a retest of the $3200 region could follow.

          Are Ethereum ETFs Driving This Surge?

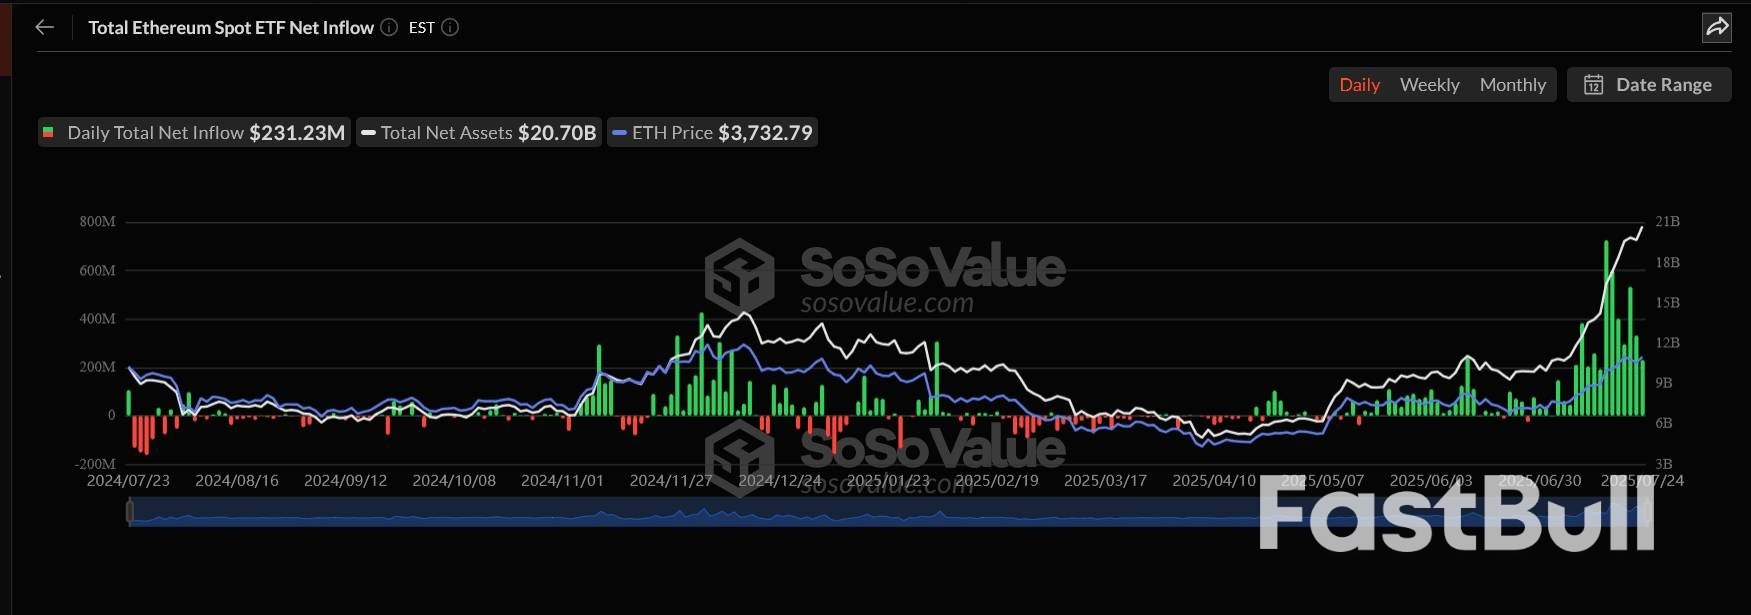
          Total ETH ETF Inflow: Image Source: SoSoValue

          Absolutely. The ETH ETF narrative is no longer speculative. It is here, and the numbers tell the story.

          As of July 24, the cumulative net inflow into Ethereum spot ETFs has reached $8.88 billion. Just on that day, inflows totaled over $231 million. That is not retail money. This is institutional conviction, and it is spreading fast. The ETFs now hold over $20.7 billion worth of ETH, which accounts for nearly 5 percent of Ethereum's total market cap.

          That kind of buy pressure does not just prop up the price. It changes the entire market structure. Fewer coins are in circulation. Volatility tightens. And demand starts to outpace supply.

          The impact is already visible. ETH’s daily volume spiked past $2.1 billion in ETF trades alone. That sort of liquidity injection builds a foundation for long-term price appreciation and stability.

          Ethereum ETFs are injecting real momentum into the market. With over $8.8 billion in cumulative inflows and $231 million added in a single day, institutional interest is no longer theory it’s visible demand.

          These ETFs are soaking up circulating supply, which naturally puts upward pressure on price. It also brings more stability and legitimacy to ETH, making it attractive not just to traders, but to long-term asset managers who previously avoided crypto due to regulatory uncertainty.

          This kind of sustained inflow shifts ETH from a speculative asset to a portfolio staple. If the current trend holds, the ETF-driven demand could create a new price floor around $3600 to $3700. From there, a break past $4000 is likely, especially if daily inflows continue above $200 million. The more capital that flows into ETFs, the stronger the buying wall becomes, setting up Ethereum for a breakout rally toward $4200 or even higher in Q3.

          What’s the Ethereum Price Prediction?

          If this ETF momentum continues, ETH price does not just have a shot at reclaiming $4000. It could create a new price floor there. Based on the current chart setup, a push toward $4200 is technically valid, especially if ETF inflows stay above the $200 million daily average. That level aligns with extended Bollinger projections and Fibonacci targets from the last swing low in early July.

          But don’t ignore short-term corrections. If ETF hype cools temporarily, Ethereum price could retrace to the $3200 zone before resuming upward.

          Ethereum price is no longer trading just on sentiment or tech upgrades. It is now backed by serious capital through regulated ETFs. That changes the game. The charts are bullish, but the inflow numbers are what really validate this trend. As long as those numbers keep climbing, the road to $4000 and beyond is wide open.

          Source: CryptoSlate

          Risk Warnings and Disclaimers
          You understand and acknowledge that there is a high degree of risk involved in trading. Following any strategies or investment methods may lead to potential losses. The content on the site is provided by our contributors and analysts for information purposes only. You are solely responsible for determining whether any trading assets, securities, strategy, or any other product is suitable for investing based on your own investment objectives and financial situation.
          Add to Favorites
          Share

          FX, Stocks Pull Back But Set For Weekly Gains On Trade Optimism

          Samantha Luan

          Economic

          Stocks

          Forex

          Key points:

          ● Turkey's lira set for best day since June 2024
          ● Senegal's dollar bonds gain on IMF programme hopes
          ● Turkey, Kenya, Bulgaria ratings to be reviewed
          ● MSCI EM FX, stocks indexes set for weekly gains

          MSCI's index tracking global EM currencies was down 0.3%, as most Asian currencies depreciated against the dollar. The index, however, was set to log weekly gains after two weeks of losses.

          This week, markets took on more risk after the U.S. signed a trade deal with Japan and signalled that more agreements were in the works, reviving some hopes that the worst tariff impacts could be avoided.However, investors were cautious with risk assets in order to brave the upcoming week, which will feature U.S. jobs data, a meeting of the Federal Reserve and Trump's August 1 tariff deadline.

          On the day, South Africa's randfell 0.7%. Most emerging European currencies were subdued against the euro."We would expect market swings to be temporary ... trade negotiations will ultimately lead to moderate policy, but we expect a tariff-led economic slowdown to be mild and short-lived, rather than recessionary," said Mark Haefele, chief investment officer at UBS Global Wealth Management.

          Turkey's lirawas 0.7% higher against the greenback, a day after its central bank delivered a surprise 300 basis point interest rate cut. The currency eyed its biggest one-day gain since June 2024.Worries over the independence of the Fed also remained, with Trump's calls for lower interest rates persistent despite his reiterating he was not planning to fire the Fed chair.Haefele said these fears, along with lower interest rates could continue to impact the dollar, and investors could look to reduce their holdings.

          Russia's roublewas down 0.4% against the greenback, over-the-counter-market data showed, ahead of a central bank decision where it is expected to cut rates by 200 basis points.Stocks in the region also pulled back after two days of gains, with MSCI's EM stocks gaugeCBOE:EFSdown 0.8%. It was still set for a second week of gains, however.

          Equities in Polandfell 0.6%, while Hungary'swere down 0.2%. Turkish stockswere little changed, though set for their fifth week of gains, their longest winning streak since December.South African equitiesslipped 0.7%, as gold miners weighed, tracking lower prices of the bullion.In Senegal, international bonds extended their rally, with dollar bonds maturing in 2033 gaining more than 1 cent to the dollar.

          The International Monetary Fund said on Thursday it would send a mission to Dakar next month to discuss the nation's debt misreporting case and a potential new programme.Meanwhile, Fitch and Moody's will review their rating on Turkey, while Kenya and Bulgaria are also due a review.

          Source: TradingView

          To stay updated on all economic events of today, please check out our Economic calendar
          Risk Warnings and Disclaimers
          You understand and acknowledge that there is a high degree of risk involved in trading. Following any strategies or investment methods may lead to potential losses. The content on the site is provided by our contributors and analysts for information purposes only. You are solely responsible for determining whether any trading assets, securities, strategy, or any other product is suitable for investing based on your own investment objectives and financial situation.
          Add to Favorites
          Share
          FastBull
          Copyright © 2025 FastBull Ltd

          728 RM B 7/F GEE LOK IND BLDG NO 34 HUNG TO RD KWUN TONG KLN HONG KONG

          TelegramInstagramTwitterfacebooklinkedin
          App Store Google Play Google Play
          Products
          Charts

          Chats

          Q&A with Experts
          Screeners
          Economic Calendar
          Data
          Tools
          Membership
          Features
          Function
          Markets
          Copy Trading
          Latest Signals
          Contests
          News
          Analysis
          24/7
          Columns
          Education
          Company
          Careers
          About Us
          Contact Us
          Advertising
          Help Center
          Feedback
          User Agreement
          Privacy Policy
          Business

          White Label

          Data API

          Web Plug-ins

          Poster Maker

          Affiliate Program

          Risk Disclosure

          The risk of loss in trading financial instruments such as stocks, FX, commodities, futures, bonds, ETFs and crypto can be substantial. You may sustain a total loss of the funds that you deposit with your broker. Therefore, you should carefully consider whether such trading is suitable for you in light of your circumstances and financial resources.

          No decision to invest should be made without thoroughly conducting due diligence by yourself or consulting with your financial advisors. Our web content might not suit you since we don't know your financial conditions and investment needs. Our financial information might have latency or contain inaccuracy, so you should be fully responsible for any of your trading and investment decisions. The company will not be responsible for your capital loss.

          Without getting permission from the website, you are not allowed to copy the website's graphics, texts, or trademarks. Intellectual property rights in the content or data incorporated into this website belong to its providers and exchange merchants.

          Not Logged In

          Log in to access more features

          FastBull Membership

          Not yet

          Purchase

          Become a signal provider
          Help Center
          Customer Service
          Dark Mode
          Price Up/Down Colors

          Log In

          Sign Up

          Position
          Layout
          Fullscreen
          Default to Chart
          The chart page opens by default when you visit fastbull.com