

Markets
News
Analysis
User
24/7
Economic Calendar
Education
Data
- Names
- Latest
- Prev


Signal Accounts for Members
All Signal Accounts
All Contests
On Thursday (January 29) At The Close Of Trading In New York (05:59 Beijing Time On Friday), The Offshore Yuan (CNH) Was Quoted At 6.9447 Against The US Dollar, Down 10 Points From The Close Of Trading In New York On Wednesday. The Yuan Traded In The Range Of 6.9382-6.9547 During The Day
[Airline ETFs Rise Over 2.6%, Leading US Sector ETFs; S&P Technology Sector Falls Over 1.8%] On Thursday (January 29), The Global Airline ETF Rose 2.64%, Regional Bank ETFs And Banking ETFs Rose Up To 1.84%, The Energy ETF Rose 0.92%, The Semiconductor ETF Rose 0.21%, The Internet Stock Index ETF And Consumer Discretionary ETF Fell Up To 0.48%, The Technology Sector ETF Fell 1.58%, And The Global Technology Stock Index ETF Fell 1.76%. Among The 11 Sectors Of The S&P 500, The Information Technology/technology Sector Fell 1.86%, The Consumer Discretionary Sector Fell 0.64%, The Energy Sector Rose 1.08%, The Real Estate Sector Rose 1.42%, And The Telecommunications Sector Rose 2.92%
On Thursday (January 29), Spot Silver Fell 0.61% To $116.0075 Per Ounce In Late New York Trading, Trading Between $121.6540 And $106.8954. Comex Silver Futures Rose 2.87% To $116.790 Per Ounce. Comex Copper Futures Rose 0.78% To $6.2855 Per Pound, Having Reached $6.5830 At 22:31 Beijing Time. Spot Platinum Fell 2.65%, And Spot Palladium Fell 2.34%
On Thursday (January 29), Spot Gold Rose 0.43% To $5,394.00 Per Ounce In Late New York Trading. At 14:23 Beijing Time, It Reached $5,595.47, Continuing To Set New Historical Highs. A Short-term Plunge Began At 23:00, Hitting A Daily Low Of $5,459.31 At 23:36. Comex Gold Futures Rose 1.97% To $5,408.30 Per Ounce, Having Reached $5,586.20 At 14:22
Stryker: Foreign Exchange Is Expected Slightly Positive Impact On Sales & Adj Net Eps Should Rates Hold Near Year-To-Date Levels For 2026
Bank Of Canada: Canada Government Will Participate In All Fixed-Rate Cmb Syndications Proposed For 2026
Toronto Stock Index .GSPTSE Unofficially Closes Down 159.94 Points, Or 0.48 Percent, At 33016.13
The S&P 500 Initially Closed Down 0.1%, With The Technology Sector Down 2%, Consumer Discretionary Down 0.6%, Energy Up 1.1%, And Telecoms Up 3%. The NASDAQ 100 Initially Closed Down 0.5%, With Atlassian, Microsoft, And Strategy Technology Among The Worst Performers, All Down Approximately 10%. Synopsys Fell 6%, Cadence Fell 5.7%, ASML Rose 2%, And Meta Rose 10.8%. Salesforce Initially Closed Down 6.3%, Boeing Fell 3%, And Microsoft Led The Decline Among Dow Jones Components. JPMorgan Chase Rose 1.6%, Honeywell Rose 4.9%, And IBM Rose Approximately 5%
The Nasdaq Golden Dragon China Index Closed Up 0.3% Initially. Among Popular Chinese Concept Stocks, NIO Closed Up 3.8%, Yum China Rose 1%, Tencent, New Oriental, Li Auto, Xiaomi, And Meituan Rose By More Than 0.9%, Alibaba Fell 0.7%, NetEase Fell 1.3%, WeRide Fell 4.5%, And Pony.ai Fell 7.9%. In The ETF Market, Ashr Rose 0.9%, Kweb Rose 0.5%, And Cqqq Fell 1.5%
ANZ - Roy Morgan New Zealand Consumer Confidence Index 107.2 In January From 101.5 Previous Month
USA Treasury: Thailand Added To Monitoring List Of Trading Partners Whose Currency Practices 'Merit Close Attention' Due To Its Growing Current Account Surplus And Trade Surplus With USA
USA Treasury: No Major Trading Partners Met All Three Criteria For Enhanced Analysis During Review Period
USA Treasury: Now Monitoring More Broadly Whether Countries That Smooth Exchange Rate Movements Do So To Resist Depreciation Pressures
USA Treasury Official Says New Criteria Not Aimed At Any Specific Country On Monitoring List But Will Aid Future Analysis During A Period Of Relative Dollar Depreciation
USA Treasury: Monitoring Trading Partners' Use Of Capital Controls, Macroprudential Measures, Government Investment Vehicles To Influence Foreign Exchange Markets
 South Africa PPI YoY (Dec)
A:--
F: --
P: --
 Euro Zone Consumer Confidence Index Final (Jan)
A:--
F: --
P: --
Euro Zone Selling Price Expectations (Jan)A:--
F: --
P: --
Euro Zone Industrial Climate Index (Jan)A:--
F: --
Euro Zone Services Sentiment Index (Jan)A:--
F: --
Euro Zone Economic Sentiment Indicator (Jan)A:--
F: --
Euro Zone Consumer Inflation Expectations (Jan)A:--
F: --
P: --
 Italy 5-Year BTP Bond Auction Avg. Yield
A:--
F: --
P: --
Italy 10-Year BTP Bond Auction Avg. YieldA:--
F: --
P: --
 France Unemployment Class-A (Dec)
A:--
F: --
P: --
South Africa Repo Rate (Jan)A:--
F: --
P: --
 Canada Average Weekly Earnings YoY (Nov)
A:--
F: --
 U.S. Nonfarm Unit Labor Cost Final (Q3)
A:--
F: --
P: --
U.S. Initial Jobless Claims 4-Week Avg. (SA)A:--
F: --
U.S. Weekly Continued Jobless Claims (SA)A:--
F: --
U.S. Trade Balance (Nov)A:--
F: --
U.S. Weekly Initial Jobless Claims (SA)A:--
F: --
Canada Trade Balance (SA) (Nov)A:--
F: --
U.S. Exports (Nov)A:--
F: --
P: --
Canada Imports (SA) (Nov)A:--
F: --
Canada Exports (SA) (Nov)A:--
F: --
U.S. Unit Labor Cost Revised MoM (SA) (Q3)A:--
F: --
U.S. Factory Orders MoM (Excl. Defense) (Nov)A:--
F: --
P: --
U.S. Factory Orders MoM (Nov)A:--
F: --
U.S. Wholesale Sales MoM (SA) (Nov)A:--
F: --
P: --
U.S. Factory Orders MoM (Excl. Transport) (Nov)A:--
F: --
U.S. Non-Defense Capital Durable Goods Orders Revised MoM (Excl. Aircraft) (SA) (Nov)A:--
F: --
U.S. EIA Weekly Natural Gas Stocks ChangeA:--
F: --
P: --
 Brazil CAGED Net Payroll Jobs (Dec)
A:--
F: --
P: --
U.S. Weekly Treasuries Held by Foreign Central BanksA:--
F: --
P: --
 South Korea Services Output MoM (Dec)
--
F: --
P: --
South Korea Industrial Output MoM (SA) (Dec)--
F: --
P: --
South Korea Retail Sales MoM (Dec)--
F: --
P: --
 Japan Tokyo CPI YoY (Excl. Food & Energy) (Jan)
--
F: --
P: --
Japan Tokyo CPI MoM (Excl. Food & Energy) (Jan)--
F: --
P: --
Japan Unemployment Rate (Dec)--
F: --
P: --
Japan Tokyo CPI YoY (Jan)--
F: --
P: --
Japan Jobs to Applicants Ratio (Dec)--
F: --
P: --
Japan Tokyo CPI MoM (Jan)--
F: --
P: --
Japan Tokyo Core CPI YoY (Jan)--
F: --
P: --
Japan Retail Sales YoY (Dec)--
F: --
Japan Industrial Inventory MoM (Dec)--
F: --
P: --
Japan Retail Sales (Dec)--
F: --
P: --
Japan Retail Sales MoM (SA) (Dec)--
F: --
Japan Large-Scale Retail Sales YoY (Dec)--
F: --
P: --
Japan Industrial Output Prelim MoM (Dec)--
F: --
P: --
Japan Industrial Output Prelim YoY (Dec)--
F: --
P: --
 Australia PPI YoY (Q4)
--
F: --
P: --
Australia PPI QoQ (Q4)--
F: --
P: --
Japan Construction Orders YoY (Dec)--
F: --
P: --
Japan New Housing Starts YoY (Dec)--
F: --
P: --
France GDP Prelim YoY (SA) (Q4)--
F: --
P: --
 Turkey Trade Balance (Dec)
--
F: --
P: --
France PPI MoM (Dec)--
F: --
P: --
 Germany Unemployment Rate (SA) (Jan)
--
F: --
P: --
Germany GDP Prelim YoY (Not SA) (Q4)--
F: --
P: --
Germany GDP Prelim QoQ (SA) (Q4)--
F: --
P: --
Germany GDP Prelim YoY (Working-day Adjusted) (Q4)--
F: --
P: --
Italy GDP Prelim YoY (SA) (Q4)--
F: --
P: --
 U.K. Mortgage Approvals (Dec)
--
F: --
P: --


No matching data
Latest Views
Latest Views
Trending Topics
Top Columnists
Latest Update
White Label
Data API
Web Plug-ins
Affiliate Program
View All
No data
President Trump said he intends to announce his pick to replace Federal Reserve Chair Jerome Powell next week, ending weeks of speculation over who will lead the U.S. central bank after Powell's term expires in May 2026.

WASHINGTON, Jan 29 (Reuters) - President Trump said he intends to announce his pick to replace Federal Reserve Chair Jerome Powell next week, ending weeks of speculation over who will lead the U.S. central bank after Powell's term expires in May 2026.

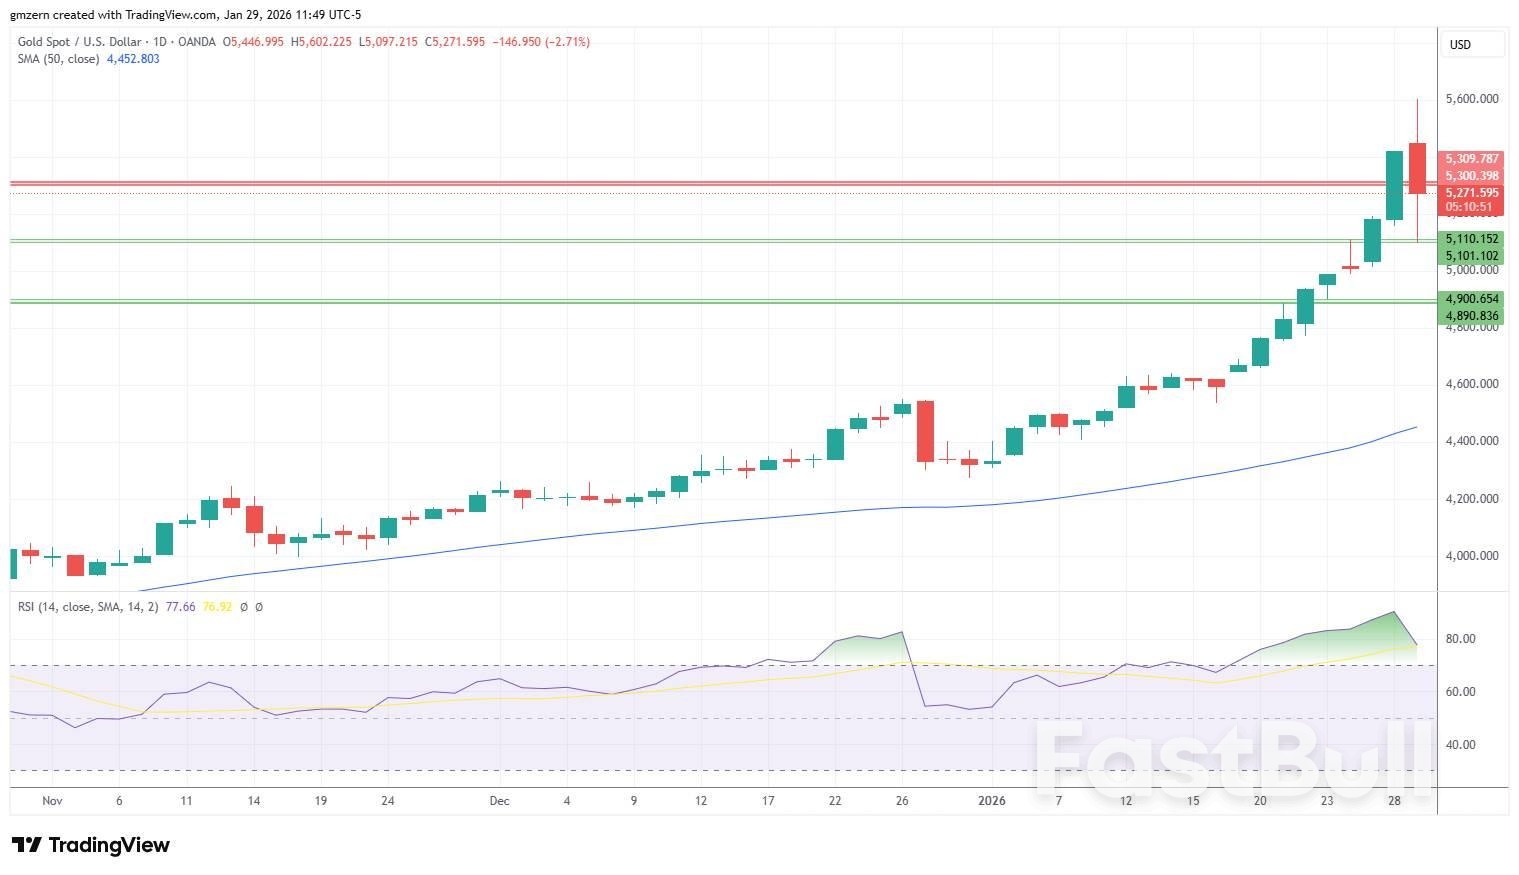 Gold 290126 Daily Chart
Gold suffered a sell-off after testing historic highs as traders rushed to take profits off the table.
In case gold declines below the support at $5100 – $5110, it will head towards the next support level at $4890 – $4900.
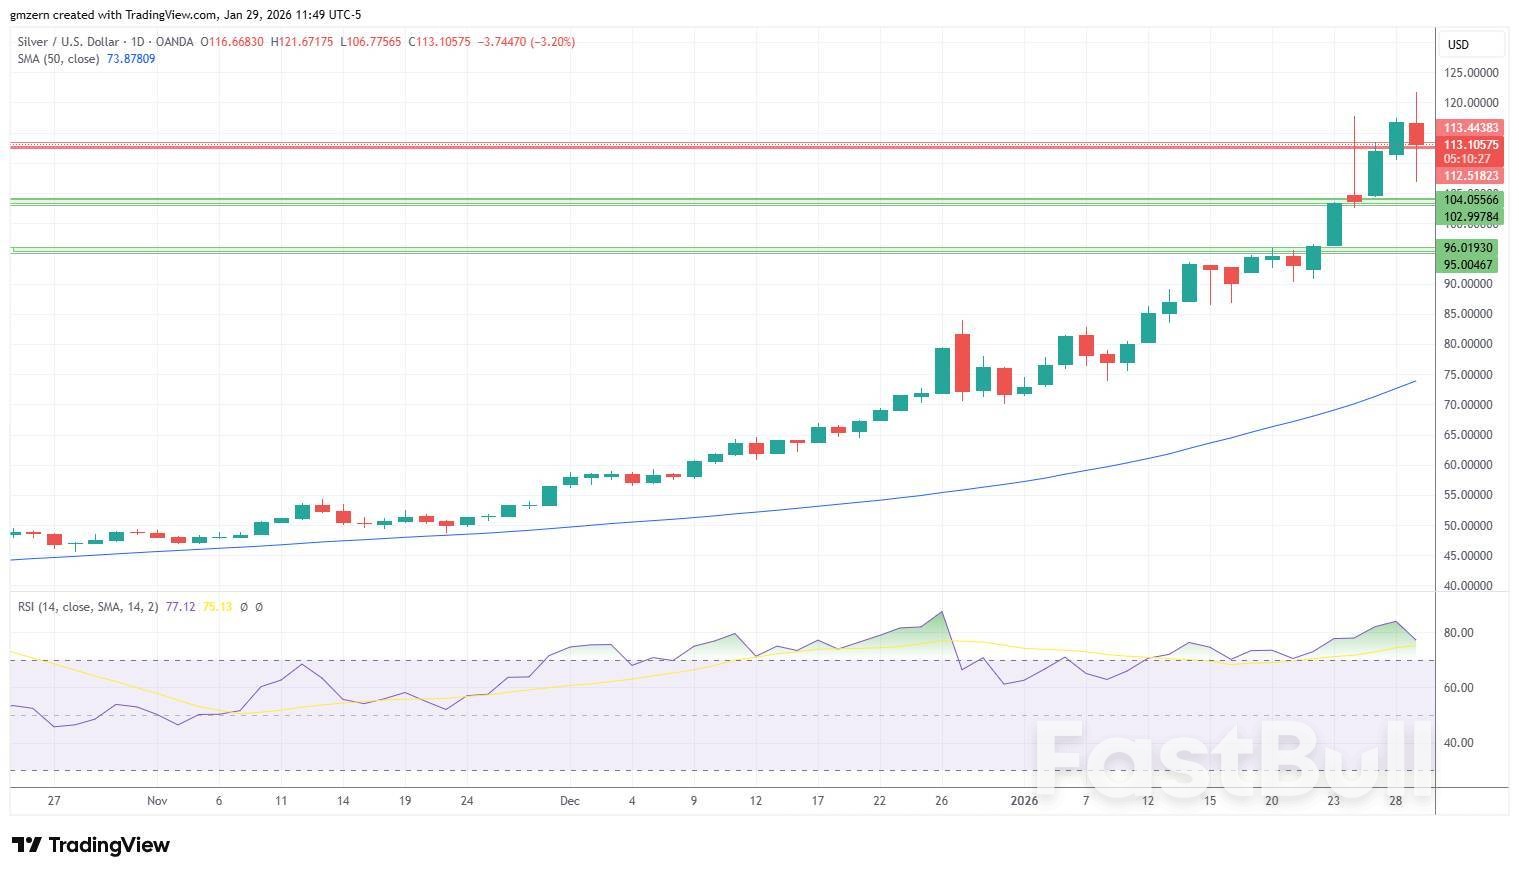 Silver 290126 Daily Chart
Silver made an attempt to settle above the $120.00 level but lost momentum and pulled back.
A move below the $110.00 level will push silver towards the support at $103.00 – $104.00.
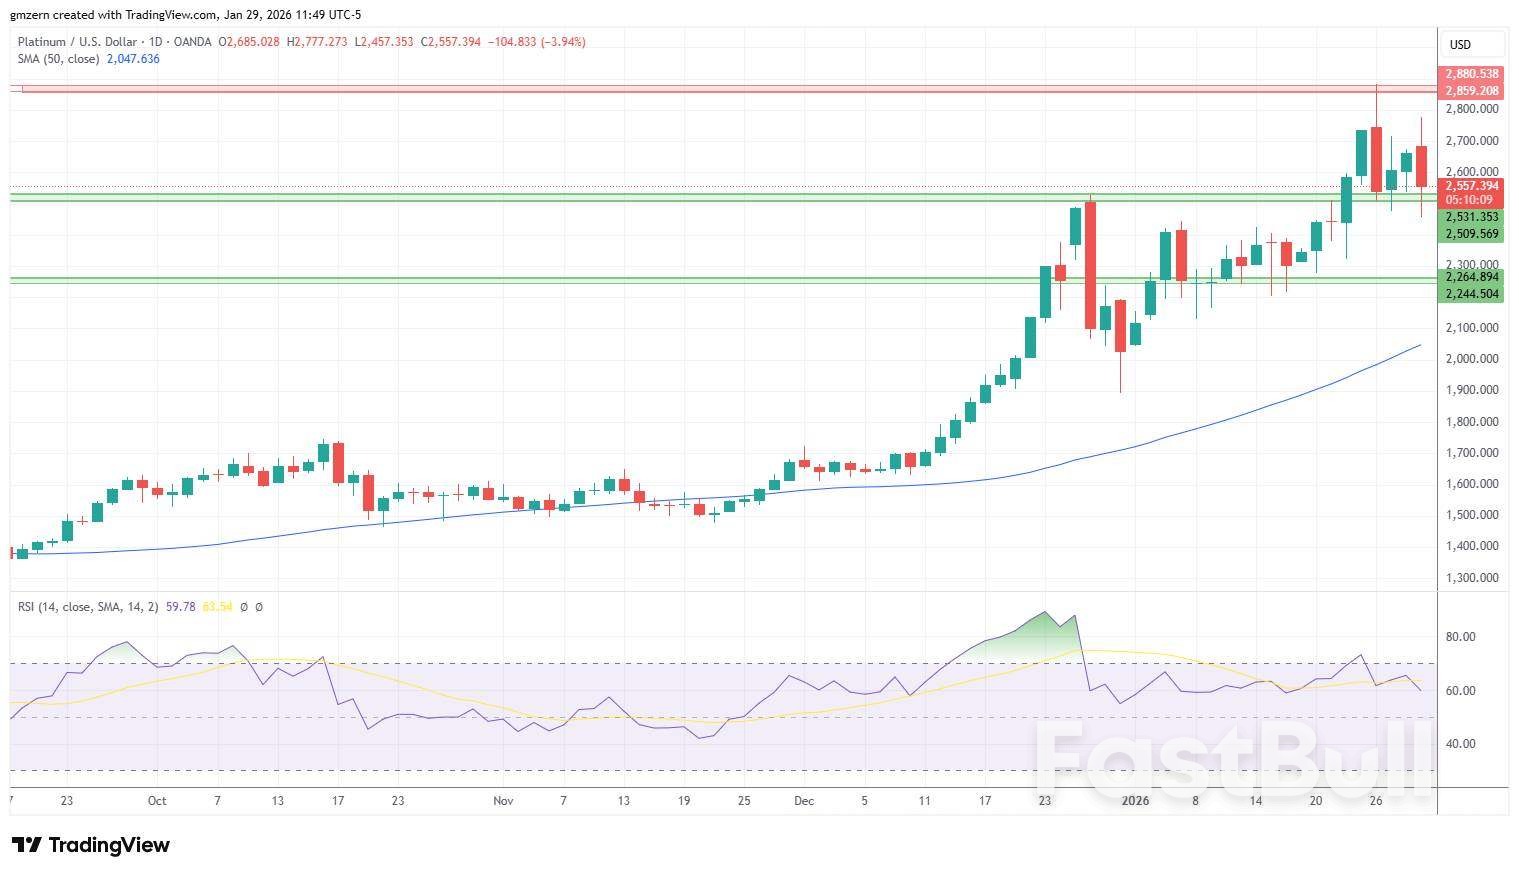 Platinum 290126 Daily Chart
Platinum is down by more than 4% amid strong pullback in precious metals markets.
A successful test of the support at $2510 – $2530 will push platinum towards the next support level at $2245 – $2265.
European nations have begun discussing a potential shared nuclear umbrella, signaling a major shift in strategic thinking as reliance on the United States comes under question. German Chancellor Friedrich Merz confirmed these preliminary talks are underway to supplement existing security agreements.
Merz emphasized that while the conversations are happening, they remain in the early stages and no immediate decisions are expected. "We know that we have to reach a number of strategic and military policy decisions, but at the moment, the time is not ripe," he told reporters.
The move comes amid growing transatlantic friction. The Trump administration has repeatedly challenged traditional alliances, prompting European leaders to reassess their defense posture. Europe has long depended on the U.S. and its nuclear arsenal for security but has recently increased military spending in response to pressure from Washington.
President Trump’s actions have unsettled European allies, including his suggestion of purchasing Greenland from Denmark, a NATO partner, and his threats to impose tariffs. He has also previously implied that the U.S. might not defend allies who fail to meet defense spending targets, fueling concerns about the reliability of American security guarantees.
For Germany, any discussion of nuclear armament is particularly sensitive. The country is prohibited from developing its own nuclear weapons under two key treaties: the 1990 "Four Plus Two" agreement that paved the way for German reunification and the 1969 nuclear non-proliferation treaty.
However, Merz noted that these obligations do not prevent Germany from exploring joint defense solutions with its partners. The talks specifically involve Europe’s only two nuclear powers, Britain and France. "These talks are taking place," Merz stated, adding that they "are also not in conflict with nuclear-sharing with the United States of America."
Adding weight to the discussions, Thomas Roewekamp, the head of Germany's parliamentary defense committee, said the country possesses the technical expertise to contribute to a joint European nuclear weapon.
"We do not have missiles or warheads, but we do have a significant technological advantage that we could contribute to a joint European initiative," said Roewekamp, a member of Merz's Christian Democratic Union party. This suggests that while legally constrained from building its own arsenal, Germany could play a crucial role in a collaborative European defense framework.
Canada’s international trade deficit widened significantly in November, hitting C$2.2 billion compared to a revised C$395 million gap in October. According to new data from Statistics Canada, the change was driven by a sharp decline in merchandise exports, reflecting a broader push by Canadian firms to diversify away from the U.S. market.
This trade balance has been in deficit territory for most of the year, with a single marginal surplus recorded in September. The trend coincides with trade uncertainty that began in February 2025, linked to tariffs and policy threats from U.S. President Donald Trump.
The November deficit was primarily fueled by a steep fall in several key export sectors, with total export volumes down 0.9%. Imports, by contrast, saw a minimal decrease of only 0.1% to C$66.14 billion.
The most significant drops in exports included:
• Metals and Nonmetallic Goods: This category plummeted by 24.4%, led by a sharp fall in unwrought gold exports to Britain, the United States, and Hong Kong.
• Motor Vehicles and Parts: Exports fell by 11.6%, the largest drop for this category in three years.
The slight decline in overall imports was led by lower imports of motor vehicles, parts, and energy products.
Despite the widening overall deficit, Canada's trade surplus with the United States actually improved, climbing to C$6.6 billion in November from C$5.2 billion the previous month. This happened because imports from the U.S. fell more steeply (-5.4%) than exports to the U.S. did (-1.8%).
This dynamic reflects the impact of U.S. levies on Canadian steel, automotive, aluminum, and lumber, which have pushed exporters to seek new markets. As a result, the U.S. accounted for just over 68% of Canada's total exports in November, a notable decrease from 76% a year ago.
While trade patterns with the U.S. are shifting, Canada's efforts to grow trade with other nations are producing uneven outcomes.
Imports from countries other than the U.S. surged by 7.8% to their highest level on record, with China and Germany leading the trend. At the same time, exports to these non-U.S. destinations fell by 4.9%. This combination widened Canada's trade deficit with the rest of the world to C$8.8 billion in November, up from C$5.6 billion in October.
Stuart Bergman, chief economist at Export Development Canada, suggested that while the diversification effort is moving in the right direction, results will take time. "I do see the momentum moving in the right direction. Are we going to see results overnight? No," he said. Bergman expects exports to the U.S., which have now declined for two consecutive months, to continue shrinking as Canadian firms find new markets.
However, he warned that Canada's exports remain concentrated, with almost 90% still going to the U.S., Britain, the European Union, and China.
Following the data release, the Canadian dollar strengthened, trading up 0.32% to C$1.3511 against the U.S. dollar. Yields on two-year government bonds fell 0.5 basis points to 2.4192%.
Statistics Canada also noted that the release of the November trade data was delayed because a 43-day government shutdown in the United States had impacted data collection for several months.
The global race for artificial intelligence dominance is increasingly becoming a battle of electricity. While China ramps up its development of large language models, Western countries are grappling with the immense energy demands required to power the data centers that make AI possible.

This growing energy challenge highlights a key strategic advantage for Beijing: its enormous and stable electricity resources.
In the United States and Europe, the ever-expanding computational load from AI is putting enormous strain on power grids. These grids were already in a precarious position, as rapid electrification and the addition of solar and wind power have outpaced investment in the necessary supportive infrastructure.
The consequences have been clear: an increasing frequency of major power outages and painfully high energy prices.
"As energy demand surges and grid modernization accelerates, utilities and developers are dealing with the twin pressures of global trade uncertainty and grid reliability," noted Jeremy Furr, senior vice president of strategic sourcing at Stryten Energy, in a recent op-ed for Utility Dive.
Paradoxically, China—the world's largest installer of renewable energy—is not facing the same level of existential threat to its power supply. A key difference is China's sustained and considerable investment in expanding and modernizing its power grids, allowing it to match grid capacity with demand far more successfully than its Western counterparts.
While the country experienced regional outages early in the decade, it has not suffered any serious blackouts since. This stability puts China in a strong economic and geopolitical position.
"In terms of electricity capacity, the differences between China, the US and the EU are substantial, and China is clearly staying ahead of the curve across scale, structure and growth momentum," Alberto Vettoretti, managing partner at Dezan Shira and Associates, told the South China Morning Post.
China's abundant, stable, and affordable energy could give the country a decisive advantage in the global AI competition. Beijing is amplifying this advantage with direct government support.
The state is now subsidizing energy for data centers, a move prompted by complaints from Chinese tech companies about high energy costs associated with using less efficient domestic semiconductors. This is just one of many incentives for the country's AI firms. As Time reported, with AI dominance now a core government policy, "every city and region is offering incentives to AI start-ups."
This state-led push is part of the "AI+ Initiative" announced last August, which aims to "reshape the paradigm of human production and life" and integrate AI into 90% of China's economy by 2030.
Achieving such an ambitious goal will require staggering amounts of energy. However, Beijing plans to harness the power of AI to manage this demand by optimizing its own power grid.
AI can be instrumental in regulating a grid increasingly powered by variable resources while facing skyrocketing, around-the-clock demand. Large language models can process supply and demand data to calculate fluctuations in real-time more affordably and efficiently than other models.
"If AI models are well trained to give accurate forecasts on how much renewable electricity will be generated throughout the day and how much electricity will be needed at corresponding times, then the grid operator can decide how to balance the demand and supply in advance more efficiently and safely," Fang Lurui of Xi'an Jiaotong-Liverpool University told Reuters.
With plans to comprehensively integrate AI into its power grid by next year, China is building a powerful feedback loop where energy powers AI, and AI, in turn, strengthens the energy system—potentially securing its lead in the technological frontier of the 21st century.
It can be hard to explain to a general audience how important the release of the World Energy Outlook (WEO) is to policymakers, energy companies and investors who make hundreds of billions of dollars in investment decisions worldwide each year.

Beginning in the early 1990s, the Outlook included a Current Policies Scenario (CPS) that forecast future oil and natural gas demand over the coming decades based on current laws and government energy policies. This scenario was then used by banks and companies to extrapolate how many billions of dollars they must invest to satisfy coming energy demand.
The IEA's all-star reputation made the CPS the benchmark for global energy supply and demand forecasts for decades – until recently.
In 2020, under its long-time Executive Director Fatih Birol, the IEA decided to abandon the CPS, "in part due to pressure from European nations and green campaigners," according to Bloomberg energy analyst Javier Blas. Most of these green campaigners were interested in using climate policies to permanently displace oil and coal production.
To do this, IEA inserted new scenarios that considered policy ambitions and aspirations that had not yet become law. This analytical misdirection allowed Paris Accord-era net-zero emission goals to become a concrete forecasting reality. As a result, these forecasts showed peak global oil demand only an additional 3 million to 106 million barrels a day by 2030 before permanently declining.
Riding on IEA's reputation, these forecasts helped the Davos crowd churn elite public opinion toward the Net-zero and Environmental, Social, and Governance (ESG) framework in the early 2020s, which played a role in the ultimate suppression of billions of dollars in investment in carbon and hydrocarbon resources.
The IEA reinstated the Current Policies Scenario for 2025 after pressure from the Trump administration, while confirming that no peak in global oil demand should be expected until at least 2050. This is a welcome decision, but not before much damage was done, according to a recent report published by the National Center for Energy Analytics (NCEA).
The report, written by Neil Atkinson, a NCEA Visiting Fellow and the former head of the IEA's Oil Industry and Markets division, and Adam Sieminski, former administrator for the U.S. Energy Information Administration, found that while reinstatement of the CPS in the 2025 WEO "has gone a long way toward answering that its scenarios are divorced from reality," the IEA must still do more to reverse past mistakes.
The latest critique found that the IEA is still making a series of unsupportable market assumptions, including:
Electric Vehicles: Forecasts of electric vehicle adoption remain overly optimistic, leading to overestimates of oil demand destruction for light-duty vehicles.
Aviation: A forecast for even a small reduction in aviation fuel use remains overly aggressive.
Marine shipping: The IEA continues to present overly aggressive forecasts of a significant decline in crude oil use for global oceangoing shipping.
Even if the IEA fixes its methodological problems and appoints a new Executive Director, damage from the five-year absence of the Current Policies Scenario could last for a long time. Sieminski and Atkinson estimate that as much as $1.5 trillion of underinvestment in oil and natural gas exploration is expected over the next decade. Underinvestment in the oil patch leads to supply shortfalls, which inevitably brings about a spike in energy prices and a new, much higher price plateau.
By projecting a 2030 demand peak for oil, the IEA sacrificed its credibility, giving succor and elite air cover to organizations like the Net-Zero Banking Alliance, a UN-backed group whose members topped out at 140 banks with trillions of dollars in assets, pledging to align their portfolios with net-zero greenhouse gas emissions by 2050.
It is unknown exactly how much international investment banks withdrew from funding Arctic oil and coal resources, but many went on the record saying they did. The collapse of the Banking Alliance in the fall of 2025, driven by a combination of political pressure and market realities, will not make up for the consequences of a self-inflicted, years-long supply-demand lag.
The report's authors do not go so far as to directly accuse the IEA of sneakily undermining the investment climate enough to create future recession-causing price spikes, but energy experts know that similar production shortfalls in the past have done exactly that.
In the 1970s, a barrel of oil went from $4 to a new plateau of about $32 a barrel by 1981, a seven-fold rise in the nominal price that crashed many national economies. In the super-spike era between 2004 and 2013, long-term oil prices roughly tripled while playing an underappreciated supporting role in the 2008 Global Financial Crisis.
If another major upward price correction arrives in the coming years, don't forget to include the IEA's willful errors when making a list of perpetrators. All government institutions are political, no matter how much structure is insulated from direct influence. Let's hope the IEA has learned a lesson or two about the costs of believing there is a "right side of history" to be on.
William Murray is a former chief speechwriter for the Environmental Protection Agency (EPA), the past editor of RealClearEnergy from 2015-2017, and has covered energy and environmental policy in Washington D.C., as a journalist and analyst for the past two decades.
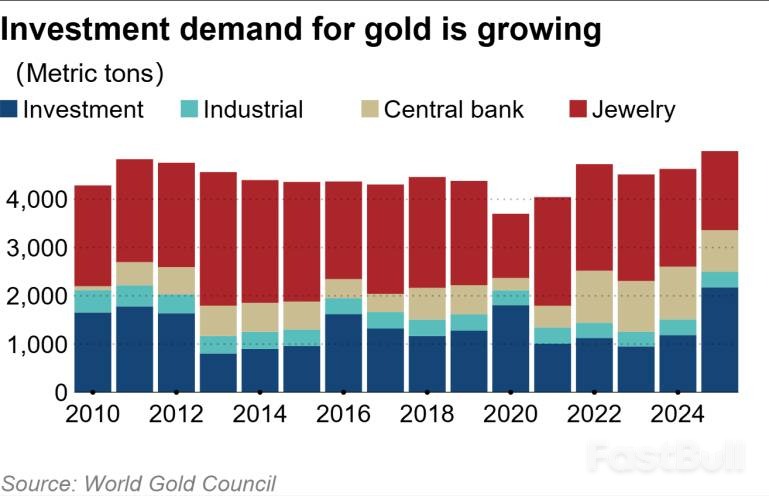
Investor demand for gold skyrocketed by 84% last year as mounting geopolitical risks and economic turbulence sent investors scrambling for safe-haven assets. According to statistics from the World Gold Council, this surge pushed the average London spot price to a new high of $3,431.5 per troy ounce, a 44% increase from 2024.
While overall gold demand edged up by just 1% to 5,002.3 metric tons, its value soared 45% to a record $555 billion, underscoring the impact of higher prices.
The primary engine behind gold's record-breaking year was investment demand, which climbed to 2,175.3 tons. This figure represents 60% of the 3,671.6 tons mined in 2025, a sharp increase from the roughly 30% share seen between 2021 and 2024.
Several factors fueled this rush into gold:
• Geopolitical Instability: Worsening global tensions prompted a flight to the tangible security of gold.
• Economic Concerns: Uncertainty stemming from U.S. tariff policies drove investors to hedge their portfolios.
• Diversification: Concerns about a weakening U.S. dollar and elevated stock prices made gold an attractive alternative for diversification.
This influx of capital created a self-reinforcing cycle, where daily price highs attracted even more money from investors seeking to capitalize on the upward momentum.
The most dramatic shift occurred in exchange-traded funds (ETFs) backed by physical gold. After seeing a net outflow of 2.9 tons in 2024, these funds experienced a massive net inflow of 801.2 tons last year.
The regional breakdown of ETF inflows was led by North America:
• North America: Funds based in the region accounted for 446 tons, over half of the global total.
• Asia: The region saw the second-largest inflow at 215 tons.
• Europe: Net inflows reached 131 tons, a figure tempered by significant profit-taking in October.
Demand for physical gold bars and coins also saw strong growth, rising 16% to 1,374.1 tons.
This trend was particularly evident in China, a major gold market. While Chinese demand for gold jewelry fell by 25%, demand for bars and coins climbed 28%. This shift reflects a broader global pattern, as worldwide jewelry demand dropped 18% to 1,542.3 tons, largely due to slowing consumption in both India and China.
Central banks, which had been buying over 1,000 tons of gold annually for the previous three years, slowed their pace in 2025. Purchases fell by 20% to 863 tons, as record-high prices likely prompted a more cautious approach.
However, this level of buying is still significantly higher than the annual average of 473 tons recorded between 2010 and 2021. This indicates that the strategic appetite for gold among the world's central banks remains strong, even at elevated prices.
728 RM B 7/F GEE LOK IND BLDG NO 34 HUNG TO RD KWUN TONG KLN HONG KONG


White Label
Data API
Web Plug-ins
Poster Maker
Affiliate Program
The risk of loss in trading financial instruments such as stocks, FX, commodities, futures, bonds, ETFs and crypto can be substantial. You may sustain a total loss of the funds that you deposit with your broker. Therefore, you should carefully consider whether such trading is suitable for you in light of your circumstances and financial resources.
No decision to invest should be made without thoroughly conducting due diligence by yourself or consulting with your financial advisors. Our web content might not suit you since we don't know your financial conditions and investment needs. Our financial information might have latency or contain inaccuracy, so you should be fully responsible for any of your trading and investment decisions. The company will not be responsible for your capital loss.
Without getting permission from the website, you are not allowed to copy the website's graphics, texts, or trademarks. Intellectual property rights in the content or data incorporated into this website belong to its providers and exchange merchants.
Not Logged In
Log in to access more features


Log In
Sign Up


