• Trade
  • Markets
  • Copy
  • Contests
  • News
  • 24/7
  • Calendar
  • Q&A
  • Chats
Trending
Screeners
SYMBOL
LAST
BID
ASK
HIGH
LOW
NET CHG.
%CHG.
SPREAD
SPX
S&P 500 Index
6857.13
6857.13
6857.13
6865.94
6827.13
+7.41
+ 0.11%
--
DJI
Dow Jones Industrial Average
47850.93
47850.93
47850.93
48049.72
47692.96
-31.96
-0.07%
--
IXIC
NASDAQ Composite Index
23505.13
23505.13
23505.13
23528.53
23372.33
+51.04
+ 0.22%
--
USDX
US Dollar Index
98.930
99.010
98.930
98.980
98.740
-0.050
-0.05%
--
EURUSD
Euro / US Dollar
1.16499
1.16509
1.16499
1.16715
1.16408
+0.00054
+ 0.05%
--
GBPUSD
Pound Sterling / US Dollar
1.33377
1.33386
1.33377
1.33622
1.33165
+0.00106
+ 0.08%
--
XAUUSD
Gold / US Dollar
4223.95
4224.38
4223.95
4230.62
4194.54
+16.78
+ 0.40%
--
WTI
Light Sweet Crude Oil
59.366
59.396
59.366
59.543
59.187
-0.017
-0.03%
--

Community Accounts

Signal Accounts
--
Profit Accounts
--
Loss Accounts
--
View More

Become a signal provider

Sell trading signals to earn additional income

View More

Guide to Copy Trading

Get started with ease and confidence

View More

Signal Accounts for Members

All Signal Accounts

Best Return
  • Best Return
  • Best P/L
  • Best MDD
Past 1W
  • Past 1W
  • Past 1M
  • Past 1Y

All Contests

  • All
  • Trump Updates
  • Recommend
  • Stocks
  • Cryptocurrencies
  • Central Banks
  • Featured News
Top News Only
Share

Citigroup Expects European Central Bank To Hold Interest Rates At 2.0% At Least Until End-Of-2027 Versus Prior Forecast Of Cuts To 1.5% By March 2026

Share

Japan Economy Minister Kiuchi: Hope Bank Of Japan Guides Appropriate Monetary Policy To Stably Achieve 2% Inflation Target, Working Closely With Government In Line With Principles Stipulated In Government-Bank Of Japan Joint Agreement

Share

Japan Economy Minister Kiuchi: Specific Monetary Policy Means Up To Bank Of Japan To Decide, Government Won't Comment

Share

Japan Economy Minister Kiuchi: Government Will Watch Market Moves With High Sense Of Urgency

Share

Japan Economy Minister Kiuchi: Important For Stock, Forex, Bond Markets To Move Stably Reflecting Fundamentals

Share

Norway Government: Will Order 2 More German-Made Submarines, Taking Total To 6 Submarines, Increasing Planned Spending By Nok 46 Billion

Share

Norway Government: Plans To Buy Long-Range Artillery Weapons For Nok 19 Billion, With Strike Distance Of Up To 500 Km

Share

Japan Economy Minister Kiuchi: Inflationary Impact Of Stimulus Package Likely Limited

Share

BP : BofA Global Research Cuts To Underperform From Neutral, Cuts Price Objective To 375P From 440P

Share

Shell : BofA Global Research Cuts To Neutral From Buy, Cuts Price Objective To 3100P From 3200P

Share

Russia Plans To Supply 5-5.5 Million Tons Of Fertilizers To India In 2025

Share

Euro Zone Q3 Employment Revised To 0.6% Year-On-Year

Share

Rheinmetall Ag : BofA Global Research Cuts Price Objective To EUR 2215 From EUR 2540

Share

China's Commerce Minister: Will Eliminate Restrictive Measures

Share

Russia - India Statement Says Defence Partnership Is Responding To India's Aspirations For Self-Reliance

Share

Russia - India Statement Says Defence Ties Being Reoriented Towards Joint R&D And Production Of Advanced Defence Platforms

Share

Russia And India Express Interest In Deepening Cooperation In Exploration, Processing And Refining Technologies For Critical Minerals And Rare Earth Elements

Share

Eurostat - Euro Zone Q3 Employment +0.6% Year-On-Year (Reuters Poll +0.5%)

Share

Eurostat - Euro Zone Q3 Employment +0.2% Quarter-On-Quarter (Reuters Poll +0.1%)

Share

Indian Rupee At 89.98 Per USA Dollar As Of 3:30 P.M. Ist, Nearly Unchanged Form 89.9750 Previous Close

TIME
ACT
FCST
PREV
U.S. Challenger Job Cuts MoM (Nov)

A:--

F: --

P: --

U.S. Initial Jobless Claims 4-Week Avg. (SA)

A:--

F: --

P: --

U.S. Weekly Initial Jobless Claims (SA)

A:--

F: --

P: --

U.S. Weekly Continued Jobless Claims (SA)

A:--

F: --

P: --

Canada Ivey PMI (SA) (Nov)

A:--

F: --

P: --

Canada Ivey PMI (Not SA) (Nov)

A:--

F: --

P: --

U.S. Non-Defense Capital Durable Goods Orders Revised MoM (Excl. Aircraft) (SA) (Sept)

A:--

F: --

P: --
U.S. Factory Orders MoM (Excl. Transport) (Sept)

A:--

F: --

P: --

U.S. Factory Orders MoM (Sept)

A:--

F: --

P: --

U.S. Factory Orders MoM (Excl. Defense) (Sept)

A:--

F: --

P: --

U.S. EIA Weekly Natural Gas Stocks Change

A:--

F: --

P: --

Saudi Arabia Crude Oil Production

A:--

F: --

P: --

U.S. Weekly Treasuries Held by Foreign Central Banks

A:--

F: --

P: --

Japan Foreign Exchange Reserves (Nov)

A:--

F: --

P: --

India Repo Rate

A:--

F: --

P: --

India Benchmark Interest Rate

A:--

F: --

P: --

India Reverse Repo Rate

A:--

F: --

P: --

India Cash Reserve Ratio

A:--

F: --

P: --

Japan Leading Indicators Prelim (Oct)

A:--

F: --

P: --

U.K. Halifax House Price Index YoY (SA) (Nov)

A:--

F: --

P: --

U.K. Halifax House Price Index MoM (SA) (Nov)

A:--

F: --

P: --

France Current Account (Not SA) (Oct)

A:--

F: --

P: --

France Trade Balance (SA) (Oct)

A:--

F: --

P: --

France Industrial Output MoM (SA) (Oct)

A:--

F: --

P: --

Italy Retail Sales MoM (SA) (Oct)

A:--

F: --

P: --

Euro Zone Employment YoY (SA) (Q3)

A:--

F: --

P: --

Euro Zone GDP Final YoY (Q3)

A:--

F: --

P: --

Euro Zone GDP Final QoQ (Q3)

A:--

F: --

P: --

Euro Zone Employment Final QoQ (SA) (Q3)

A:--

F: --

P: --

Euro Zone Employment Final (SA) (Q3)

A:--

F: --

P: --
Brazil PPI MoM (Oct)

--

F: --

P: --

Mexico Consumer Confidence Index (Nov)

--

F: --

P: --

Canada Unemployment Rate (SA) (Nov)

--

F: --

P: --

Canada Labor Force Participation Rate (SA) (Nov)

--

F: --

P: --

Canada Employment (SA) (Nov)

--

F: --

P: --

Canada Part-Time Employment (SA) (Nov)

--

F: --

P: --

Canada Full-time Employment (SA) (Nov)

--

F: --

P: --

U.S. Personal Income MoM (Sept)

--

F: --

P: --

U.S. Dallas Fed PCE Price Index YoY (Sept)

--

F: --

P: --

U.S. PCE Price Index YoY (SA) (Sept)

--

F: --

P: --

U.S. PCE Price Index MoM (Sept)

--

F: --

P: --

U.S. Personal Outlays MoM (SA) (Sept)

--

F: --

P: --

U.S. Core PCE Price Index MoM (Sept)

--

F: --

P: --

U.S. UMich 5-Year-Ahead Inflation Expectations Prelim YoY (Dec)

--

F: --

P: --

U.S. Core PCE Price Index YoY (Sept)

--

F: --

P: --

U.S. Real Personal Consumption Expenditures MoM (Sept)

--

F: --

P: --

U.S. 5-10 Year-Ahead Inflation Expectations (Dec)

--

F: --

P: --

U.S. UMich Current Economic Conditions Index Prelim (Dec)

--

F: --

P: --

U.S. UMich Consumer Sentiment Index Prelim (Dec)

--

F: --

P: --

U.S. UMich 1-Year-Ahead Inflation Expectations Prelim (Dec)

--

F: --

P: --

U.S. UMich Consumer Expectations Index Prelim (Dec)

--

F: --

P: --

U.S. Weekly Total Rig Count

--

F: --

P: --

U.S. Weekly Total Oil Rig Count

--

F: --

P: --

U.S. Consumer Credit (SA) (Oct)

--

F: --

P: --

China, Mainland Foreign Exchange Reserves (Nov)

--

F: --

P: --

China, Mainland Exports YoY (USD) (Nov)

--

F: --

P: --

Q&A with Experts
    • All
    • Chatrooms
    • Groups
    • Friends
    Connecting
    .
    .
    .
    Type here...
    Add Symbol or Code

      No matching data

      All
      Trump Updates
      Recommend
      Stocks
      Cryptocurrencies
      Central Banks
      Featured News
      • All
      • Russia-Ukraine Conflict
      • Middle East Flashpoint
      • All
      • Russia-Ukraine Conflict
      • Middle East Flashpoint
      Search
      Products

      Charts Free Forever

      Chats Q&A with Experts
      Screeners Economic Calendar Data Tools
      Membership Features
      Data Warehouse Market Trends Institutional Data Policy Rates Macro

      Market Trends

      Market Sentiment Order Book Forex Correlations

      Top Indicators

      Charts Free Forever
      Markets

      News

      News Analysis 24/7 Columns Education
      From Institutions From Analysts
      Topics Columnists

      Latest Views

      Latest Views

      Trending Topics

      Top Columnists

      Latest Update

      Signals

      Copy Rankings Latest Signals Become a signal provider AI Rating
      Contests
      Brokers

      Overview Brokers Assessment Rankings Regulators News Claims
      Broker listing Forex Brokers Comparison Tool Live Spread Comparison Scam
      Q&A Complaint Scam Alert Videos Tips to Detect Scam
      More

      Business
      Events
      Careers About Us Advertising Help Center

      White Label

      Data API

      Web Plug-ins

      Affiliate Program

      Awards Institution Evaluation IB Seminar Salon Event Exhibition
      Vietnam Thailand Singapore Dubai
      Fans Party Investment Sharing Session
      FastBull Summit BrokersView Expo
      Recent Searches
        Top Searches
          Markets
          News
          Analysis
          User
          24/7
          Economic Calendar
          Education
          Data
          • Names
          • Latest
          • Prev

          View All

          No data

          Scan to Download

          Faster Charts, Chat Faster!

          Download App
          English
          • English
          • Español
          • العربية
          • Bahasa Indonesia
          • Bahasa Melayu
          • Tiếng Việt
          • ภาษาไทย
          • Français
          • Italiano
          • Türkçe
          • Русский язык
          • 简中
          • 繁中
          Open Account
          Search
          Products
          Charts Free Forever
          Markets
          News
          Signals

          Copy Rankings Latest Signals Become a signal provider AI Rating
          Contests
          Brokers

          Overview Brokers Assessment Rankings Regulators News Claims
          Broker listing Forex Brokers Comparison Tool Live Spread Comparison Scam
          Q&A Complaint Scam Alert Videos Tips to Detect Scam
          More

          Business
          Events
          Careers About Us Advertising Help Center

          White Label

          Data API

          Web Plug-ins

          Affiliate Program

          Awards Institution Evaluation IB Seminar Salon Event Exhibition
          Vietnam Thailand Singapore Dubai
          Fans Party Investment Sharing Session
          FastBull Summit BrokersView Expo

          Syria Condemns Netanyahu's Visit to Its Israeli-occupied South

          Glendon

          Political

          Palestinian-Israeli conflict

          Summary:

          Netanyahu pledges support for Druze minority during visit; Israel has expanded military presence in Syria post-Assad; Syria demands return to original buffer zone, Israel refuses; US-brokered talks for Israel-Syria security pact have faltered.

          Israel's Prime Minister Benjamin Netanyahu visited Israeli troops deployed in southern Syria, drawing strong condemnation from the government in Damascus, which denounced the trip as a violation of sovereignty.

          Israel expanded its military presence in southern Syria after the ousting of Bashar al-Assad last December, seizing positions east of a U.N.-patrolled buffer zone that separates the Israeli-occupied Golan Heights from Syrian territory.

          Wearing a flak jacket and helmet, Netanyahu on Wednesday visited troops on Syrian territory, according to photographs published by his office. He reiterated Israel's commitment to protect Syria's Druze minority, whose community straddles the border into northern Israel.

          "We attach immense importance to our capability here, both defensive and offensive, safeguarding our Druze allies, and especially safeguarding the State of Israel and its northern border opposite the Golan Heights," Netanyahu told the troops, according to a statement from his office.

          "This is a mission that can develop at any moment, but we are counting on you," he said.

          The Islamist-led government in Damascus said Netanyahu's visit was "a dangerous violation of Syrian sovereignty and unity," and called it an attempt to "impose a fait accompli."

          There was no immediate comment from the Israeli government.

          TALKS ON A SECURITY PACT

          Israel captured the Golan Heights from Syria in a 1967 war and later annexed it, a move not recognised by most countries. Syria has demanded that Israel returns to the original buffer zone, but senior Israeli officials have said they will not relinquish the new posts.

          For months, Syria has been in U.S.-brokered talks with Israel to reach a security pact that Damascus hopes will reverse Israel's recent seizures of its land but that would fall far short of a full peace treaty.

          The talks have faltered since Israel introduced a new demand, opens new tab to allow the opening of a "humanitarian corridor" to Syria's southern province of Sweida. Syria rejected the request as a breach of its sovereignty.

          A Syrian military official said the visit showed Israel was not willing to relinquish any territory.

          "Netanyahu's visit sends a message: we won't withdraw from the areas we entered after December 8... Regardless of the security deal, its future or its fate, this is the message they're sending Syria - that Israel is not willing to give up these outposts," the official told Reuters.

          The two countries have technically been at war since the creation of Israel in 1948, despite periodic armistices. Syria does not recognise the state of Israel.

          Since Assad's ousting, Israel has carried out unprecedented strikes on Syrian military assets including the defence ministry, sent troops into its south and lobbied the U.S. to keep Syria weak and decentralised.

          Source: Reuters

          Risk Warnings and Disclaimers
          You understand and acknowledge that there is a high degree of risk involved in trading. Following any strategies or investment methods may lead to potential losses. The content on the site is provided by our contributors and analysts for information purposes only. You are solely responsible for determining whether any trading assets, securities, strategy, or any other product is suitable for investing based on your own investment objectives and financial situation.
          Add to Favorites
          Share

          EU’s Ambassador Urges Reset with China as Rare Earth Easing Offers Diplomatic Opening

          Gerik

          Economic

          Limited Progress Since Summer Summit Highlights Persistent Strain

          Jorge Toledo, the European Union’s chief envoy to China, delivered a frank assessment of the diplomatic impasse between the two economic powers, stating that relations have seen little improvement since their summer summit. Speaking at a panel discussion in Beijing, Toledo pointed to ongoing challenges tied to supply chain vulnerabilities and restrictive Chinese export controls particularly those involving rare earth elements essential to European manufacturing.
          This candid statement underscores a causal link between unresolved trade tensions and the current diplomatic deadlock. Europe’s persistent dependency on Chinese rare earths continues to expose its industrial base to supply disruptions, limiting strategic autonomy and amplifying calls for diversification.

          Rare Earth Export Suspension Presents Opportunity

          However, recent developments offer a potential turning point. China’s decision to suspend export controls on rare earth magnets has been welcomed by EU officials as a positive gesture. The move came shortly after U.S. President Donald Trump and Chinese President Xi Jinping reached a partial agreement aimed at easing broader geopolitical tensions an outcome that also eased some of Europe’s concerns.
          Toledo described this shift as “good news,” suggesting it could serve as the foundation for broader cooperation if both parties commit to rebuilding trust. This reflects a correlated opportunity between diplomatic de-escalation and the strategic easing of trade barriers. Whether this opening evolves into lasting cooperation depends on sustained transparency and mutual restraint.

          Media Narratives and Misunderstanding of EU Unity

          Toledo also addressed recent critical portrayals of the EU in Chinese media, which he characterized as misrepresentations designed to shift blame onto Brussels for existing trade and diplomatic frictions. He emphasized that the EU is a unified political union, not merely a collection of individual states acting independently.
          This distinction is crucial, as misinterpretation of EU structure may lead Beijing to underestimate the bloc’s cohesion and its ability to formulate collective responses to perceived economic coercion. Toledo warned that dismissing the EU’s political agency would be “risky and not conducive” to productive engagement.
          While tensions remain high and recent diplomatic efforts have yielded limited results, China’s easing of rare earth export controls has injected a note of optimism into an otherwise difficult relationship. For the European Union, the path forward will require not just economic recalibration but also a renewed political dialogue grounded in mutual recognition and respect. As both sides weigh their next steps, the rare earth détente may yet serve as a springboard toward broader strategic stability if built upon constructively.

          Source: Bloomberg

          To stay updated on all economic events of today, please check out our Economic calendar
          Risk Warnings and Disclaimers
          You understand and acknowledge that there is a high degree of risk involved in trading. Following any strategies or investment methods may lead to potential losses. The content on the site is provided by our contributors and analysts for information purposes only. You are solely responsible for determining whether any trading assets, securities, strategy, or any other product is suitable for investing based on your own investment objectives and financial situation.
          Add to Favorites
          Share

          Cocoa Slump Saves The Chocolate Bar – But Not Your Christmas Treats

          Justin

          Forex

          Commodity

          Economic

          Summary

          · Cocoa futures have fallen to ~USD 5,000/t, a 21-month low and more than 50% off the peak, though still roughly twice their long-term average.
          · Market structure has flipped from extreme backwardation to mild contango, signalling a major easing in supply tightness.
          · High prices triggered both demand destruction (shrinkflation, dilution) and a strong supply response across West Africa and emerging origins.
          · The drop comes too late to improve Christmas chocolate, but next year's Easter eggs may benefit.

          The retreat reflects a classic case of "the best cure for high prices is high prices." After several years of weather disruptions, disease pressure and ageing trees in Ivory Coast and Ghana, the world's two dominant producers, the 2023–24 deficit pushed physical supply to breaking point. Crucially, farmgate prices lagged the futures spike, leaving farmers unable to invest just as climate volatility was intensifying. This mismatch created the conditions for the parabolic rise.

          That dynamic is now reversing. Improved rainfall, better fertiliser use and rising producer-country prices have encouraged farmers to rehabilitate plantations, prune more aggressively and replant high-yielding varieties. Beyond West Africa, elevated returns have sparked investment in Latin America and Southeast Asia, gradually broadening the global supply base.

          This transition is visible in the forward curve. One year ago, the Dec-24 futures contract traded in New York held a 23% premium over Dec-25, an extreme backwardation that highlighted acute nearby scarcity. Today, Dec-25 trades at a USD 270/t or 5.5% discount to Dec-26, reflecting a return to contango and a market that is no longer scrambling for prompt supply. Producers are again willing to hedge, inventories are starting to recover and traders are no longer paying panic-level premiums to secure beans.

          Demand has also played an essential role in normalising the balance. Record-high raw material costs forced chocolate manufacturers into a series of unpopular choices: shrinkflation, price increases and the quiet dilution of cocoa content. The latter has become sufficiently widespread that some UK biscuits and bars can no longer legally be labelled "chocolate," instead qualifying only as "chocolate flavour" coatings dominated by palm and shea oils. This is classic demand destruction — the point at which consumers either trade down or manufacturers reformulate to protect margins.

          Lower cocoa prices will not immediately reverse shrinkflation or dilution. Recipe reformulations tend to stick, at least for a while. Reversing them requires either competitive pressure or a sustained period of lower input costs. But the potential is now there. Cocoa at USD 5,000/t is still expensive by past standards but far more manageable for manufacturers than USD 12,000/t.

          Seasonality adds a timely twist. The current slump arrives far too late to affect Christmas assortments already produced and priced months ago. The supply shock hit during the production cycle for 2024 holiday products, meaning consumers will still face high prices and—depending on the brand—lighter bars with more palm oil than they might expect. But if the market stabilises around current levels, the impact could show up in 2026's Easter eggs and bunnies. In a market where humour is often in short supply, it is tempting to say that while the cocoa slump won't save Christmas, it may soften the blow for Easter.

          From a trading perspective, the picture now looks considerably more balanced than it did a few months ago. The froth that characterised the peak has largely evaporated, evident in the sharp contraction in aggregate open interest as speculative positions were unwound. The recent stabilisation and modest uptick in open interest likely reflect a mix of fresh speculative selling and renewed producer hedging as prices return to more workable levels. With the parabolic phase behind us, price action should increasingly be driven by more conventional fundamentals: West African weather patterns, disease management, the pace of replanting and political risk in key producer nations. On the demand side, global growth trends, consumer sentiment and the extent to which manufacturers restore cocoa content will shape the recovery profile.

          The next key question is sustainability. Can the new supply momentum be maintained? West Africa remains vulnerable to climate variability, and gains in new origins may be too small to offset problems if a serious weather event hits the region again. Meanwhile, if manufacturers do not reverse shrinkflation or dilution, demand may not rebound as quickly thereby keeping a ceiling on prices.

          Overall, cocoa's downturn marks the start of normalisation after a once-in-a-generation shock. The slump has stabilised the market, given farmers breathing room and eased pressure on buyers. For consumers, the benefits are coming — just not in time to salvage this year's Christmas stockings. But Easter? That might finally bring a bit more real chocolate and a bit less "chocolate-flavoured" improvisation.
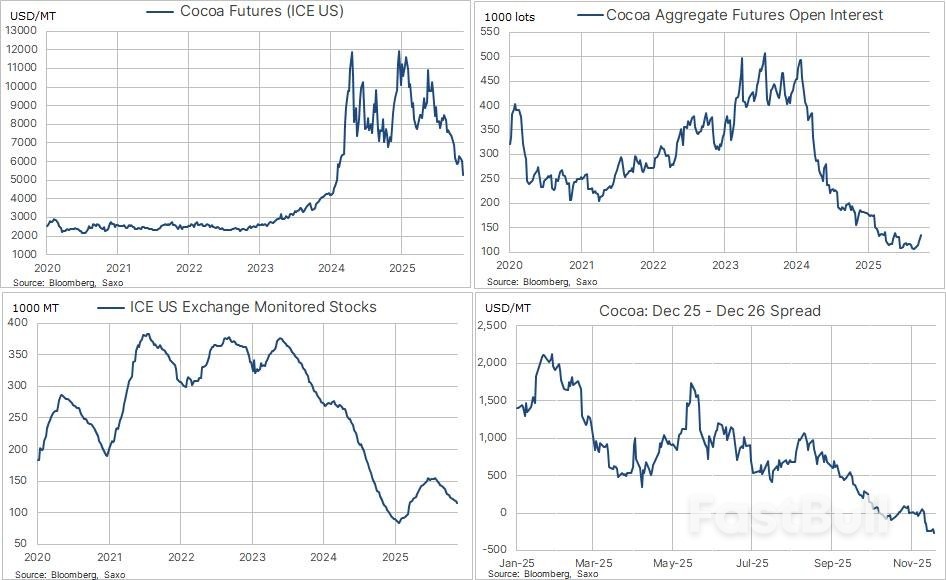
          Cocoa charts

          Source: SAXO

          To stay updated on all economic events of today, please check out our Economic calendar
          Risk Warnings and Disclaimers
          You understand and acknowledge that there is a high degree of risk involved in trading. Following any strategies or investment methods may lead to potential losses. The content on the site is provided by our contributors and analysts for information purposes only. You are solely responsible for determining whether any trading assets, securities, strategy, or any other product is suitable for investing based on your own investment objectives and financial situation.
          Add to Favorites
          Share

          Building an Emergency Fund Doesn’t Have to Be Overwhelming — Here’s How to Start

          Gerik

          Economic

          A Crucial Financial Cushion in Unpredictable Times

          From unexpected car repairs to medical emergencies, unplanned expenses can disrupt even the most stable financial routines. That’s why an emergency fund savings set aside strictly for urgent and unforeseen costs is essential. According to Miklos Ringbauer, a certified public accountant, the ability to cover life’s surprises hinges on having access to immediate cash.
          The commonly cited benchmark is to save three to six months of living expenses. However, that target can feel intimidating for those managing debt or tight budgets. But, as Jaime Eckels of Plante Moran Financial Advisors explains, building an emergency fund is even more critical in those circumstances because it prevents further debt accumulation. This causal benefit is clear: savings help break the cycle of borrowing to cover emergencies.

          Start Small and Make the Goal Attainable

          The overwhelming nature of saving several months' worth of expenses can be a deterrent. Experts suggest beginning with an initial milestone such as saving $1,000 before progressing to one month, then gradually to three and six months of expenses. Eckels points out that even small regular deposits, such as $20 from each paycheck, contribute meaningfully over time.
          Crucially, storing these funds in a separate high-yield savings account (rather than mixing them with everyday savings) helps reinforce their purpose and makes it less tempting to withdraw unnecessarily. This separation also aids in tracking and mental accounting.

          Tailor the Fund to Your Lifestyle and Income Pattern

          There’s no universal target amount for everyone. Rachel Lawrence of Monarch Money stresses that your fund should reflect your actual obligations. A single professional with few responsibilities might need only $2,000 to $3,000, whereas a parent with dependents and multiple financial liabilities should aim for a more extensive cushion.
          For freelancers and gig workers, the suggestion is to maintain two types of funds: one to stabilize income during lean months and another strictly for emergencies. By setting aside money during periods of high income, self-employed individuals can create a buffer system that protects against income volatility a frequent challenge in the gig economy.

          Automate the Process for Long-Term Success

          Automation is another powerful tool in building emergency savings. By scheduling recurring transfers into a dedicated savings account ideally coinciding with payday you can build a habit while eliminating the decision-making fatigue around saving. Eckels recommends choosing an account separate from your checking account, preferably at a different institution, to make accessing the money less convenient unless truly needed.
          This behavioral barrier helps preserve the integrity of the emergency fund while building a disciplined financial routine.

          Make Your Progress Visible and Rewarding

          Creating visual cues to track your savings can be a strong motivator. Lawrence recommends tools like habit-tracking apps, progress charts, or personalized visual goal markers to trigger psychological rewards. These tools help reinforce consistency and can make the act of saving feel emotionally satisfying not just financially responsible.
          The more visible the progress, the more often the brain feels reinforced, and the stronger the habit becomes.

          Use Windfalls Strategically

          For individuals with very little monthly wiggle room, occasional windfalls such as tax refunds, bonuses, or rare third paychecks in a month can be used to make significant strides toward an emergency fund. Lawrence advises a balanced approach: keep 10% of the windfall for personal use and direct the rest into your fund. This method ensures you’re both saving and celebrating the extra cash, which supports long-term motivation.
          Importantly, experts agree that using your emergency fund in a real emergency is a sign of financial strength not weakness. The fund’s purpose is to be used in times of genuine need. As Lawrence explains, you wouldn’t feel guilty about using a retirement fund to retire or a down payment to buy a home. The same principle applies here.
          Once used, the next step is simply to rebuild it knowing it served its purpose exactly as intended.
          An emergency fund is not an all-or-nothing financial goal it’s a progressive, strategic cushion that grows with discipline, planning, and flexibility. Whether you’re dealing with debt, earning a variable income, or just starting out, building a safety net is not only possible but essential. With the right mindset and tools, even small steps can lead to significant financial stability over time.

          Source: AP

          To stay updated on all economic events of today, please check out our Economic calendar
          Risk Warnings and Disclaimers
          You understand and acknowledge that there is a high degree of risk involved in trading. Following any strategies or investment methods may lead to potential losses. The content on the site is provided by our contributors and analysts for information purposes only. You are solely responsible for determining whether any trading assets, securities, strategy, or any other product is suitable for investing based on your own investment objectives and financial situation.
          Add to Favorites
          Share

          USD Rises: Fed Minutes Boost Demand for The Dollar, Focus Shifts to Labour-Market Reports

          FXOpen

          Forex

          Technical Analysis

          The dollar strengthened across the board following the publication of the minutes from the latest Federal Reserve meeting. The document confirmed the regulator's readiness to cut rates further, but without clear timing and with an emphasis on future decisions depending on incoming data. For some market participants, this sounded less "dovish" than expected, prompting increased demand for the dollar, while Treasury yields held near local highs.

          Another source of uncertainty remains the impact of the prolonged US government shutdown. Due to the suspension of statistical agencies, some key releases on employment and inflation were not published on schedule, meaning that the upcoming batch of labour-market data may bring surprises. Today, investors are focused on private-sector employment reports, jobless-claims data, and related indicators, which will help shape expectations ahead of the Fed's next decisions.

          USD/JPY

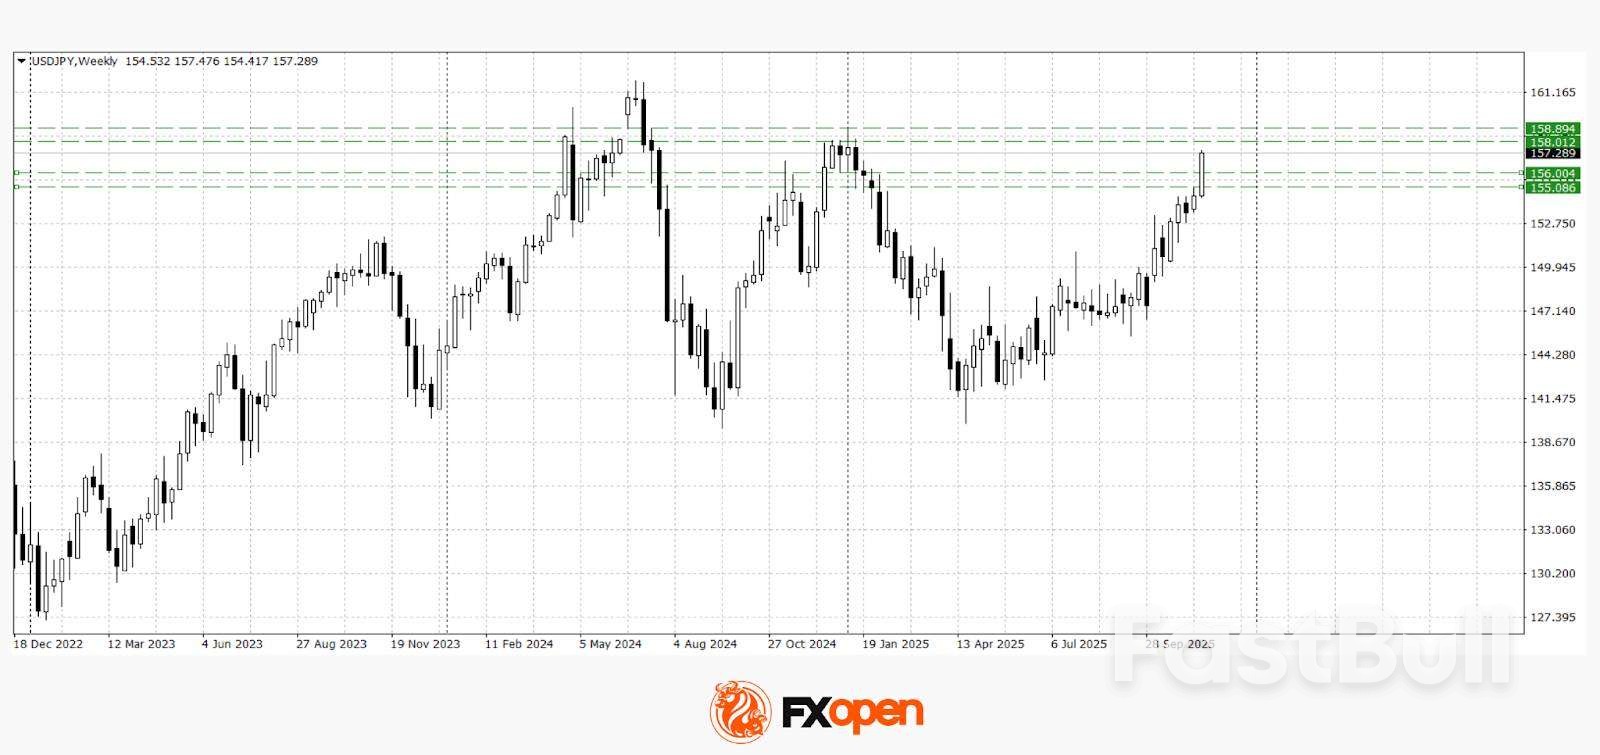
          The USD/JPY pair has reached this year's extremes, reacting to the monetary-policy differential. The pair is trading above 157.00, reflecting a combination of a more resilient dollar and the Bank of Japan's persistently dovish stance. The market still does not see the Japanese regulator preparing for tightening, whereas the Fed, despite being in a rate-cutting cycle, maintains a cautious tone and highlights inflation risks.

          Technical analysis of USD/JPY suggests a possible test of the key 158.00–158.90 range if the 157.00 level confirms itself as support. Should a downward pullback develop, the pair may decline towards 155.20–156.00.

          Events that may influence USD/JPY pricing in the coming trading sessions include:

          • today at 16:30 (GMT+3): US average hourly earnings
          • today at 16:30 (GMT+3): US non-farm employment change
          • today at 16:30 (GMT+3): Philadelphia Fed manufacturing index

          USD/CAD

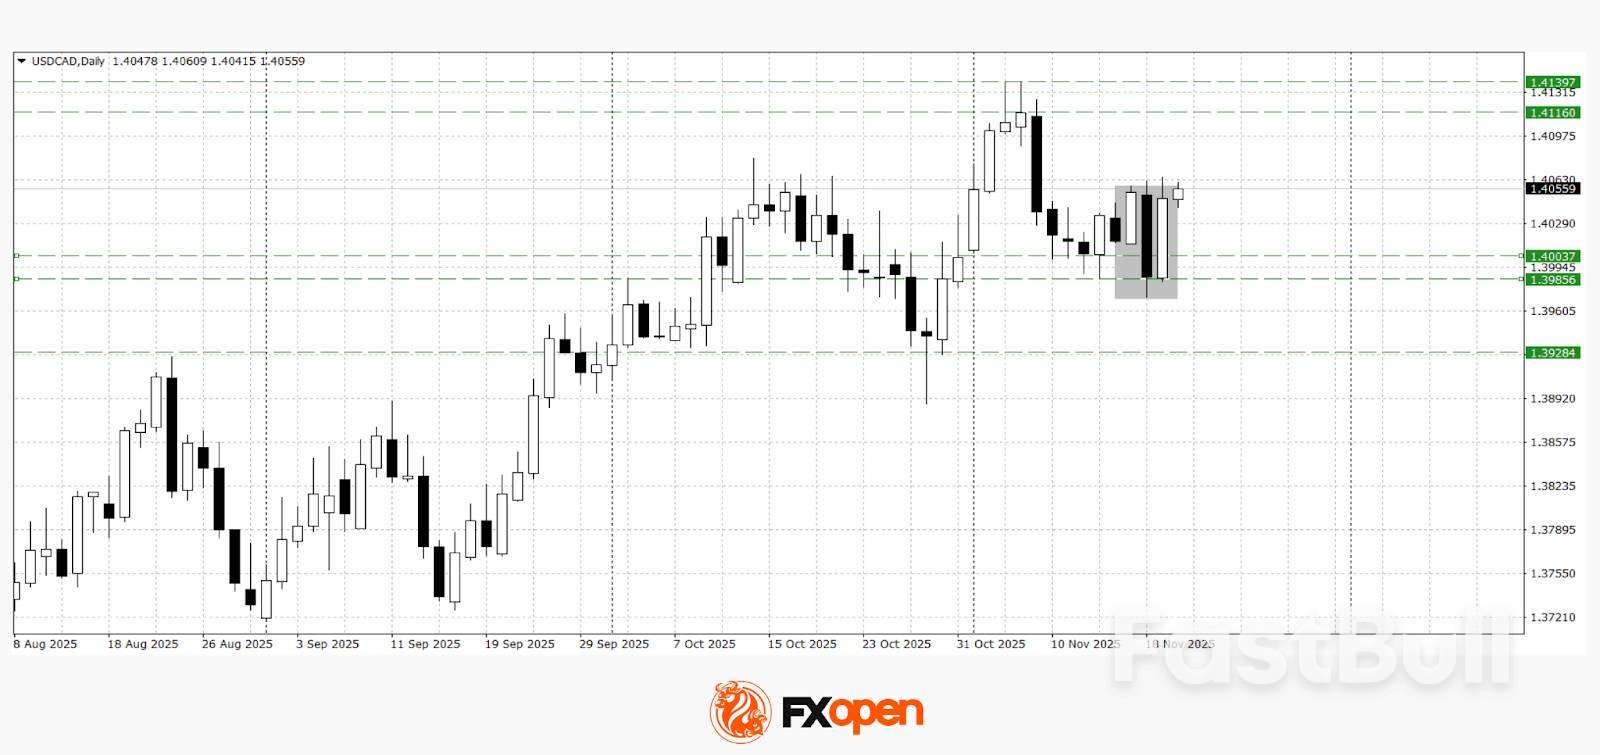
          Sellers of USD/CAD made another attempt yesterday to break support at 1.3980, but were unsuccessful. The price rebounded sharply from this level and held above 1.4000. If the upward momentum continues, the pair may revisit recent highs near 1.4140. A firm move back below 1.4000 could trigger another approach towards 1.3930.

          Events that may influence USD/CAD pricing in the coming trading sessions include:

          • today at 15:30 (GMT+3): Canada Raw Materials Price Index (RMPI)
          • today at 18:00 (GMT+3): US existing home sales
          • tomorrow at 16:30 (GMT+3): Canada core retail sales index

          Source: FXOpen

          Risk Warnings and Disclaimers
          You understand and acknowledge that there is a high degree of risk involved in trading. Following any strategies or investment methods may lead to potential losses. The content on the site is provided by our contributors and analysts for information purposes only. You are solely responsible for determining whether any trading assets, securities, strategy, or any other product is suitable for investing based on your own investment objectives and financial situation.
          Add to Favorites
          Share

          India’s Micro-Drama Boom Mirrors China’s Playbook, Ignites Fierce New Race for Digital Attention

          Gerik

          Economic

          China-Inspired Format, India’s Fierce Adaptation

          India’s entertainment landscape is undergoing a structural transformation as micro-dramas short videos ranging from 90 seconds to two minutes gain explosive traction. Inspired by China’s $7 billion micro-drama industry, Indian platforms are adapting the format for their own mass digital audience, especially in the absence of Chinese-origin apps like TikTok, which were banned in 2020.
          This content model isn’t new to India. The initial surge of Chinese short-form formats like TikTok saw massive adoption before the regulatory crackdown. The market void has since been filled by homegrown apps like Moj (launched by ShareChat), and international platforms like Instagram’s Reels. The causal momentum from TikTok’s ban led directly to the proliferation of new platforms and now, serialized micro-dramas are the next frontier.

          A New Digital Arms Race for Attention

          ShareChat’s launch of QuickTV, a subscription-based micro-drama platform featuring professional productions, has already captured 40 million monthly viewers. Amazon’s MX Player has responded with “Fatafat,” while others like Zee’s Bullet and Hoichoi’s Sooper are entering the fray. These efforts are supported by a causal logic: to compete in India’s fragmented and mobile-first media market, content must be optimized for fast, snackable, scroll-resistant formats.
          Notably, India’s 750–800 million smartphone users (second only to China) form a mobile-native consumer base that increasingly treats TV as a secondary screen. As Sooper’s content head Sambbhav Khetarpal observes, the shift toward mobile streaming has been building over several years, but micro-dramas offer a natural format for this consumption behavior.

          From Copycats to Content Innovation

          The earliest Indian micro-dramas were dubbed versions of Chinese shows. But the industry is quickly evolving from mimicry to localization. According to Bitkraft’s Anuj Tandon, early copycatting is part of the industry’s learning curve, but sustained engagement will require original, high-quality storytelling. This correlates with user behavior Indian viewers scroll away from stale or unengaging content in seconds, demanding a narrative “hook” nearly every minute, as producer Karanvir Bohra points out.
          This pivot is not just strategic, but necessary. Platforms hoping to carve out identity and retention will need to shift from volume to value emphasizing culturally relevant, character-driven, and emotionally gripping series that reflect India’s linguistic and regional diversity.

          Monetization: From Burn Rates to Revenue Models

          Unlike earlier content platforms that relied heavily on unsustainable cash-burn strategies, most Indian micro-drama platforms now focus on subscription models, with plans to diversify into ad revenue as they scale beyond 10–15 million users. Currently, 70%–80% of subscription income is reportedly spent on marketing content across Instagram and Facebook.
          However, long-term monetization will hinge on ad-integration. As adtech firm Moloco’s Siddharth Jhawar explains, inserting ads every 3–4 short videos is easier and less disruptive than placing ads within longer narratives. This causally enhances monetization efficiency and opens doors for TikTok-style advertising models that have already proved lucrative in the global short-video economy.
          Meta is also entering this space with its own scripted content under Instagram Reels, such as the micro-drama series Party for Two, which targets Gen Z creators and viewers. This signals a correlated threat as legacy platforms transition from user-generated content to curated short-format storytelling, newer platforms must scale content libraries fast to retain attention.

          Cost-Efficient Production and Talent Abundance

          Indian platforms benefit from exceptionally low production costs often less than $3,000 per micro-drama series and a vast talent ecosystem drawn from Bollywood, streaming services, and television. This economic model enables fast content turnover and experimentation, creating fertile ground for a production boom.
          Writers like Anurag Shukla, who has contributed to multiple recent micro-dramas, expect a 3–4 year surge in content creation as platforms try to outpace each other in volume and originality. The causal condition here is the combination of low-cost content creation and scalable user acquisition, offering platforms a rare chance to leapfrog traditional long-form models.

          India’s Micro-Drama Moment Has Arrived

          India is entering a new phase of digital storytelling, where micro-dramas sit at the intersection of content innovation, platform monetization, and user behavior. What began as an import from China has rapidly morphed into an indigenous content race powered by smartphones, regional diversity, and evolving consumption habits.
          But sustaining this momentum will require more than copying Chinese plots or flooding feeds with videos. Platforms must balance narrative quality with scale, create robust content IP, and find the right monetization mix to compete in a saturated digital ecosystem. When Indian micro-dramas begin influencing Chinese content creators, that will be the ultimate sign the industry has come full circle.

          Source: CNBC

          To stay updated on all economic events of today, please check out our Economic calendar
          Risk Warnings and Disclaimers
          You understand and acknowledge that there is a high degree of risk involved in trading. Following any strategies or investment methods may lead to potential losses. The content on the site is provided by our contributors and analysts for information purposes only. You are solely responsible for determining whether any trading assets, securities, strategy, or any other product is suitable for investing based on your own investment objectives and financial situation.
          Add to Favorites
          Share

          Cardano ADA Price Prediction 2025-2030: Can $0.51 Support Trigger a Move Toward $10?

          Winkelmann

          Cryptocurrency

          Stocks

          Cardano ADA Price Prediction 2025-2030: Can $0.51 Support Trigger a Move Toward $10?_1

          This cardano ada price prediction examines whether the critical $0.51 support zone can act as a launchpad for a long-term move toward $10 between 2025 and 2030. By combining technical analysis, on-chain data, macro drivers and network development trends, this guide provides balanced scenarios to help traders and investors understand potential price paths, key risks and realistic expectations for ADA’s future performance.

          Current ADA Market Analysis & Key Technical Levels

          Live Price, Market Cap & Technical Indicators

          The current cardano ada price prediction is highly sensitive to short-term volatility and broader market sentiment. ADA continues to trade within a compressed range, reflecting indecision among market participants and aligning with typical consolidation phases seen before major breakouts.

          • Market structure remains range-bound with declining momentum
          • RSI trending near neutral territory, indicating balance between buyers and sellers
          • Moving averages showing potential squeeze formation
          IndicatorCurrent Signal
          RSI (14)Neutral to mildly bullish
          MACDEarly convergence forming
          200-Day MAActing as dynamic resistance

          Critical $0.51 Support Level Analysis

          The $0.51 level remains the most closely watched zone in any ada cardano price prediction model. Historically, this level has acted as a liquidity magnet and structural base, reinforcing its importance in short and mid-term outlooks.

          • Repeated rebounds from $0.51 highlight strong buyer interest
          • Breakdown below may accelerate bearish momentum
          • Sustained hold strengthens bullish continuation probability

          Whale Activity & Exchange Netflows

          On-chain data reveals increasing whale wallet accumulation during consolidation phases, a behaviour often preceding larger directional moves. Exchange netflows indicate moderate outflows, suggesting investors are positioning for longer-term holding rather than immediate selling pressure.

          This pattern aligns with broader narratives surrounding cardano ada price prediction crypto news, reinforcing the theory that institutional confidence may be rebuilding.

          Cardano Price Prediction 2025: ETF Decision Year

          Monthly Price Forecast Q1-Q4 2025

          QuarterProjected Range (USD)Market Theme
          Q1 2025$0.60 – $0.88Accumulation phase
          Q2 2025$0.75 – $1.05Speculative momentum
          Q3 2025$0.85 – $1.25ETF sentiment anticipation
          Q4 2025$1.10 – $1.60Trend confirmation phase

          Bullish Scenario: With ETF Approval ($2+ Target)

          If regulatory approval occurs, cardano ada price prediction 2025 models suggest accelerated capital inflows into ADA. ETF confirmation may attract institutional demand comparable to historical BTC and ETH behaviour.

          • Increased liquidity and investor confidence
          • Enhanced credibility within mainstream finance
          • Potential range expansion toward $2.00–$2.40

          Bearish Scenario: Without ETF ($0.85–$1.25 Range)

          Without ETF approval, price action may remain confined within a moderate growth band. This scenario still retains upward momentum but reflects conservative sentiment and delayed institutional commitment.

          • Slower adoption cycle continuation
          • Range-bound consolidation through late 2025
          • Sensitive reaction to macroeconomic conditions

          This outlook also aligns with conservative projections seen in cardano ada price prediction july 2025 discussions, which anticipate gradual progression rather than explosive price action.

          ADA Price Forecast 2026-2030: Path to $10

          Year-by-Year Price Predictions (Min/Avg/Max)

          Long-term scenarios for ADA between 2026 and 2030 depend on network execution, macro cycles and overall crypto market structure. The table below outlines an illustrative year-by-year range often considered in mid-term cardano ada price prediction models.

          YearMin (USD)Average (USD)Max (USD)
          2026$0.90$1.60$2.40
          2027$1.20$2.10$3.20
          2028$1.50$2.80$4.50
          2029$1.80$3.50$6.50
          2030$2.20$4.80$10.00

          These values are not guarantees but scenario ranges, providing a structured view for ada cardano price prediction discussions through 2030.

          Key Milestones & Network Upgrades Timeline

          For any multi-year cardano ada price prediction 2030 roadmap, technical milestones are as important as market cycles. Some of the key checkpoints that could influence sentiment and valuation include:

          • Major scalability upgrades improving throughput and transaction finality
          • Refinements to governance and on-chain voting frameworks
          • Expansion of sidechains and interoperability with other networks
          • New tooling for developers building high-performance DeFi and dApps

          If delivered on schedule, these milestones may support the thesis that ADA can gradually move into a higher valuation band over the 2026-2030 window.

          DeFi Growth & Institutional Adoption Factors

          DeFi activity and institutional interest are key pillars behind any ambitious cardano ada price prediction. Capital tends to follow robust ecosystems with real usage and reliable infrastructure.

          • Growth in total value locked (TVL) across Cardano-native DeFi protocols
          • Availability of institutional-grade custody and staking solutions
          • Listing of ADA-focused products on regulated venues and potential ETF structures
          • Enterprise and government pilots that validate long-term utility

          Balanced analysis, rather than purely speculative cardano ada price prediction crypto news headlines, should weigh these adoption factors when assessing ADA’s potential path toward higher price targets by 2030.

          Technical Analysis: Falling Wedge Breakout Potential

          Weekly & Daily Chart Patterns

          On higher timeframes, ADA has at times formed structures resembling a falling wedge, a pattern that can precede bullish reversals if confirmed by volume and follow-through. Shorter-term charts may show nested wedges or channels inside the broader formation.

          • Weekly charts highlighting a series of lower highs with diminishing downside momentum
          • Daily charts showing tightening ranges as volatility compresses
          • Breakout attempts accompanied by incremental volume spikes

          In this context, traders often frame cardano ada price prediction scenarios around whether a decisive breakout above wedge resistance can unlock a new trend leg.

          Moving Averages & RSI Signals

          Trend-following indicators provide additional confirmation for any falling wedge breakout thesis. Moving averages and momentum oscillators help distinguish between genuine reversals and short-lived rallies.

          IndicatorTypical Bullish Confirmation Signal
          50-Day MAPrice reclaiming and holding above after wedge breakout
          200-Day MAGolden cross or sustained trade above long-term trendline
          RSIMove from oversold into 50–70 range with higher lows

          When these conditions align, they support more constructive cardano ada price prediction views, especially in multi-year frameworks extending to 2030.

          Support & Resistance Levels Through 2030

          Mapping long-term support and resistance gives structure to both conservative and aggressive targets used in extended forecasts such as cardano ada price prediction atgraphite.com or other research sources. Below is an illustrative level map for the coming years:

          ZoneApproximate Price Band (USD)Role
          Major Support$0.50 – $0.70Structural base and long-term accumulation region
          Intermediate Range$1.00 – $3.00Rotation and consolidation area in many models
          Expansion Zone$3.00 – $6.50Potential mid-cycle rally targets
          Speculative Upper Band$6.50 – $10.00Aggressive upside target range toward 2030

          These bands help frame both shorter-term ideas such as cardano ada price prediction 2025 and longer horizons like cardano ada price prediction 2030 within a consistent technical structure, rather than relying solely on isolated price points.

          Fundamental Catalysts That Could Drive ADA Higher

          Smart Contract Growth & Plutus Scripts Metrics

          Smart contract expansion remains one of the most influential pillars behind any ada cardano price prediction. The continued evolution of Plutus scripts and developer tooling directly affects network usage, transaction volume and ecosystem maturity.

          • Rising number of deployed smart contracts and active dApps
          • Growth in developer participation and GitHub activity
          • Increased DeFi protocol adoption and transaction throughput

          These metrics often provide a more grounded perspective than short-term cardano ada price prediction crypto news narratives focused solely on speculative momentum.

          Plomin Hard Fork Impact & Decentralization Progress

          The Plomin hard fork represents a significant phase in Cardano’s governance and decentralization journey. Its implementation may improve network efficiency, security and participation in on-chain decision-making.

          • Enhanced staking participation and validator efficiency
          • Improved governance mechanisms and voting structures
          • Higher transparency in protocol-level upgrades

          For long-term cardano ada price prediction 2030 models, sustained decentralization and reliable governance frameworks are critical in supporting institutional confidence and long-term valuation.

          Competition with Ethereum & Market Position

          Cardano’s positioning as a third-generation blockchain places it in direct competition with Ethereum, Solana and other Layer-1 ecosystems. Its appeal lies in scalability, formal verification and academic-driven development.

          • Lower transaction fees compared to congested networks
          • Energy-efficient proof-of-stake architecture
          • Strong community-led ecosystem development

          How effectively Cardano captures market share in high-growth sectors such as DeFi and gaming will significantly shape any mid-to-long term cardano ada price prediction trajectory.

          Risk Factors & Long-Term Outlook (2031-2050)

          What Could Invalidate the $10 Target

          While optimistic projections exist, several risk elements could weaken or invalidate the $10 scenario often mentioned in cardano ada price prediction narratives.

          • Prolonged network stagnation or delayed upgrades
          • Loss of developer and user interest to competing chains
          • Adverse regulatory decisions or global macro downturns

          Sustained failure to innovate would significantly challenge aggressive targets projected in some ada cardano price prediction models.

          ADA Price Predictions 2040 & 2050

          YearProjected Average Range (USD)Key Assumptions
          2040$12.00 – $25.00Mass adoption and mature blockchain utility
          2050$25.00 – $50.00+Global integration and sustained institutional use

          These extended forecasts are speculative in nature and are meant to complement long-term perspectives such as cardano ada price prediction atgraphite.com and similar research-based models.

          Investment Strategy & Risk Management

          Effective planning is essential when interpreting any cardano ada price prediction 2025 or longer-term outlooks. Investors should balance optimism with realistic portfolio safeguards.

          • Use layered entry strategies rather than single-price accumulation
          • Diversify exposure across multiple digital assets
          • Apply position sizing aligned with risk tolerance
          • Regularly review macro and on-chain data signals

          Rather than reacting to short-lived cardano ada price prediction july 2025 speculation spikes, disciplined strategies focused on fundamentals tend to provide more sustainable outcomes over multi-decade horizons.

          FAQs about Cardano ADA Price Prediction

          1. Can Cardano ADA reach $10?

          Reaching $10 is possible under aggressive scenarios where sustained adoption, strong DeFi growth, major network upgrades and favourable macro conditions align. Most cardano ada price prediction models view $10 as a long-term target rather than a near-term expectation.

          2. How much will 1 ADA be worth in 2030?

          Estimates vary widely. Conservative projections place ADA between $2 and $4, while optimistic forecasts supported by widespread adoption and ecosystem maturity suggest prices could exceed $8 by 2030.

          3. Can Cardano reach $100 dollars?

          $100 remains a highly speculative level requiring massive market expansion, enterprise integration and global-scale usage. Most current cardano ada price prediction frameworks do not consider this level realistic within the next few decades.

          Conclusion

          This cardano ada price prediction highlights how ADA’s future depends on technical strength, ecosystem expansion and broader market conditions. While the $0.51 support zone may provide a base for growth, long-term progress toward higher targets requires sustained innovation and adoption. Investors should balance opportunity with careful risk evaluation and realistic expectations when assessing ADA’s potential through 2030 and beyond.

          Risk Warnings and Disclaimers
          You understand and acknowledge that there is a high degree of risk involved in trading. Following any strategies or investment methods may lead to potential losses. The content on the site is provided by our contributors and analysts for information purposes only. You are solely responsible for determining whether any trading assets, securities, strategy, or any other product is suitable for investing based on your own investment objectives and financial situation.
          Add to Favorites
          Share
          FastBull
          Copyright © 2025 FastBull Ltd

          728 RM B 7/F GEE LOK IND BLDG NO 34 HUNG TO RD KWUN TONG KLN HONG KONG

          TelegramInstagramTwitterfacebooklinkedin
          App Store Google Play Google Play
          Products
          Charts

          Chats

          Q&A with Experts
          Screeners
          Economic Calendar
          Data
          Tools
          Membership
          Features
          Function
          Markets
          Copy Trading
          Latest Signals
          Contests
          News
          Analysis
          24/7
          Columns
          Education
          Company
          Careers
          About Us
          Contact Us
          Advertising
          Help Center
          Feedback
          User Agreement
          Privacy Policy
          Business

          White Label

          Data API

          Web Plug-ins

          Poster Maker

          Affiliate Program

          Risk Disclosure

          The risk of loss in trading financial instruments such as stocks, FX, commodities, futures, bonds, ETFs and crypto can be substantial. You may sustain a total loss of the funds that you deposit with your broker. Therefore, you should carefully consider whether such trading is suitable for you in light of your circumstances and financial resources.

          No decision to invest should be made without thoroughly conducting due diligence by yourself or consulting with your financial advisors. Our web content might not suit you since we don't know your financial conditions and investment needs. Our financial information might have latency or contain inaccuracy, so you should be fully responsible for any of your trading and investment decisions. The company will not be responsible for your capital loss.

          Without getting permission from the website, you are not allowed to copy the website's graphics, texts, or trademarks. Intellectual property rights in the content or data incorporated into this website belong to its providers and exchange merchants.

          Not Logged In

          Log in to access more features

          FastBull Membership

          Not yet

          Purchase

          Become a signal provider
          Help Center
          Customer Service
          Dark Mode
          Price Up/Down Colors

          Log In

          Sign Up

          Position
          Layout
          Fullscreen
          Default to Chart
          The chart page opens by default when you visit fastbull.com