

Markets
News
Analysis
User
24/7
Economic Calendar
Education
Data
- Names
- Latest
- Prev


Signal Accounts for Members
All Signal Accounts
All Contests
 U.K. Trade Balance Non-EU (SA) (Oct)
A:--
F: --
P: --
U.K. Trade Balance (Oct)A:--
F: --
P: --
U.K. Services Index MoMA:--
F: --
P: --
U.K. Construction Output MoM (SA) (Oct)A:--
F: --
P: --
U.K. Industrial Output YoY (Oct)A:--
F: --
P: --
U.K. Trade Balance (SA) (Oct)A:--
F: --
P: --
U.K. Trade Balance EU (SA) (Oct)A:--
F: --
P: --
U.K. Manufacturing Output YoY (Oct)A:--
F: --
P: --
U.K. GDP MoM (Oct)A:--
F: --
P: --
U.K. GDP YoY (SA) (Oct)A:--
F: --
P: --
U.K. Industrial Output MoM (Oct)A:--
F: --
P: --
U.K. Construction Output YoY (Oct)A:--
F: --
P: --
 France HICP Final MoM (Nov)
A:--
F: --
P: --
 China, Mainland Outstanding Loans Growth YoY (Nov)
A:--
F: --
P: --
China, Mainland M2 Money Supply YoY (Nov)A:--
F: --
P: --
China, Mainland M0 Money Supply YoY (Nov)A:--
F: --
P: --
China, Mainland M1 Money Supply YoY (Nov)A:--
F: --
P: --
 India CPI YoY (Nov)
A:--
F: --
P: --
India Deposit Gowth YoYA:--
F: --
P: --
 Brazil Services Growth YoY (Oct)
A:--
F: --
P: --
 Mexico Industrial Output YoY (Oct)
A:--
F: --
P: --
 Russia Trade Balance (Oct)
A:--
F: --
P: --
 Philadelphia Fed President Henry Paulson delivers a speech
 Canada Building Permits MoM (SA) (Oct)
A:--
F: --
P: --
Canada Wholesale Sales YoY (Oct)A:--
F: --
P: --
Canada Wholesale Inventory MoM (Oct)A:--
F: --
P: --
Canada Wholesale Inventory YoY (Oct)A:--
F: --
P: --
Canada Wholesale Sales MoM (SA) (Oct)A:--
F: --
P: --
 Germany Current Account (Not SA) (Oct)
A:--
F: --
P: --
U.S. Weekly Total Rig CountA:--
F: --
P: --
U.S. Weekly Total Oil Rig CountA:--
F: --
P: --
 Japan Tankan Large Non-Manufacturing Diffusion Index (Q4)
--
F: --
P: --
Japan Tankan Small Manufacturing Outlook Index (Q4)--
F: --
P: --
Japan Tankan Large Non-Manufacturing Outlook Index (Q4)--
F: --
P: --
Japan Tankan Large Manufacturing Outlook Index (Q4)--
F: --
P: --
Japan Tankan Small Manufacturing Diffusion Index (Q4)--
F: --
P: --
Japan Tankan Large Manufacturing Diffusion Index (Q4)--
F: --
P: --
Japan Tankan Large-Enterprise Capital Expenditure YoY (Q4)--
F: --
P: --
U.K. Rightmove House Price Index YoY (Dec)--
F: --
P: --
China, Mainland Industrial Output YoY (YTD) (Nov)--
F: --
P: --
China, Mainland Urban Area Unemployment Rate (Nov)--
F: --
P: --
 Saudi Arabia CPI YoY (Nov)
--
F: --
P: --
 Euro Zone Industrial Output YoY (Oct)
--
F: --
P: --
Euro Zone Industrial Output MoM (Oct)--
F: --
P: --
Canada Existing Home Sales MoM (Nov)--
F: --
P: --
Euro Zone Total Reserve Assets (Nov)--
F: --
P: --
U.K. Inflation Rate Expectations--
F: --
P: --
Canada National Economic Confidence Index--
F: --
P: --
Canada New Housing Starts (Nov)--
F: --
P: --
U.S. NY Fed Manufacturing Employment Index (Dec)--
F: --
P: --
U.S. NY Fed Manufacturing Index (Dec)--
F: --
P: --
Canada Core CPI YoY (Nov)--
F: --
P: --
Canada Manufacturing Unfilled Orders MoM (Oct)--
F: --
P: --
Canada Manufacturing New Orders MoM (Oct)--
F: --
P: --
Canada Core CPI MoM (Nov)--
F: --
P: --
Canada Manufacturing Inventory MoM (Oct)--
F: --
P: --
Canada CPI YoY (Nov)--
F: --
P: --
Canada CPI MoM (Nov)--
F: --
P: --
Canada CPI YoY (SA) (Nov)--
F: --
P: --
Canada Core CPI MoM (SA) (Nov)--
F: --
P: --

No matching data
Latest Views
Latest Views
Trending Topics
Top Columnists
Latest Update
White Label
Data API
Web Plug-ins
Affiliate Program
View All
No data
Indian households expect price pressures to stay low over the next 12 months, surveys by the Reserve Bank of India showed.
Indian households expect price pressures to stay low over the next 12 months, surveys by the Reserve Bank of India showed.
In the May round of surveys on inflation expectations, released Friday, households’ perception of current inflation declined 10 basis points from the previous poll in March, while they expected inflation to moderate by 20 basis points a year from now.
In such surveys, the direction, rather than the absolute level, is important. The reviews were conducted during May 2-11 in 19 major cities, with 6,079 responses. Inflationary pressures “eased across major product groups including food products and non-food items,” the RBI said.
The Reserve Bank of India on Friday surprised with a half point cut in interest rates as growth prospects dimmed and inflation eased. Governor Sanjay Malhotra declared victory over inflation in a post-policy press conference.
Meanwhile, two separate surveys on consumer confidence in urban and rural areas showed households remain generally optimistic about the future, though their expectations about the current period remained largely unchanged from the previous rounds of studies.
As I discussed here yesterday, the “end of US exceptionalism” theme is now a pretty mainstream view. There was a brief period where the idea of global diversification was withering on the vine.
Going “all-in” on America started to seem like the rational choice in a world where all the leading tech stocks were in the US, and where any decade-spanning chart of past performance would show that diversification simply didn’t pay versus a simple S&P 500 tracker.
But while it’s a cliche, there is actually some truth to that “past performance is not an indicator of future performance” boiler plate. It took the return of Donald Trump to catalyse it, but so far at least, it seems that the “rest of the world” is catching up with the US market after a lengthy period of underperforming.
Bloomberg held a “Money & Macro” event in New York yesterday, and I found comments from one panellist very informative (I hasten to add, I read the write-up, I wasn’t in the room).
Monica Dicenso, Head of Global Investment Opportunities at JPMorgan Chase Bank, noted that the company’s discretionary portfolios have moved from “overweight” to “neutral” on the US, and that clients are keen to spread their risk. “When I have that conversation, people are saying, give me something outside of the US,” she said.
Now, I think it’s important to note that we’re not talking about investors scrambling to get out of the US. This isn’t like the denouement to the tech bubble, say. Investors aren’t thinking “argh, I need to lock in my US profits before the whole thing collapses.” They’re just starting to see more appealing opportunities elsewhere.
However, it does imply that the weight of capital flows that have been piling into the US will diminish, while the capital flows going elsewhere will increase.
Passive investing has come to dominate a great deal of global capital allocation. So this shift may have some interesting effects. It might mean that the stocks that benefited the most from automated inflows struggle more as the shift occurs, for example.
But I think what’s probably more interesting for investors is thinking about who the winners might be. It’s one thing when a massive market accustomed to massive inflows sees those inflows diminish a bit. It’s another when a smaller market accustomed to weak flows suddenly sees a lot more money coming in.
As I also said yesterday, this strikes me as a good opportunity for any country looking to cultivate a healthy and growing equity market investment culture. Which is why it’s a shame, as my Bloomberg Opinion friend Chris Hughes points out, that the UK is doing anything but.
However, the UK is not the only global market out there, and the good news is that plenty of other markets are also appealing after long periods of underperformance.
Firstly, there’s the question of governance. The late David Fuller, a brilliant financial markets analyst, used to say “in emerging markets, governance is everything.” What’s interesting to me now is that the governance gap seems to be closing between “emerging” and “developed” markets quite sharply and along several dimensions.
One guest at the conference was Chile’s former finance minister, Ignacio Briones, who discussed the tricky topic of pension reforms. An audience member asked about the country’s priorities for the coming years.
Briones emphasised the point that both the left and right-wing parties fundamentally agreed on issues like growth being critical to living standards (with all faddish talk of “degrowth” thrown out), and that infrastructure needs to be easier to build, and corporation tax more competitive.
Chile is hardly the least politically stable emerging market. This is not an astonishing transformation. But what struck me was that he was basically describing “consensus” politics as many in the UK used to whine about in the early 2000s, and now pine desperately for.
Moreover, there are plenty of countries in Latin America which have seen significant improvements to the political environment. As an obvious example, Argentina’s experiment with a form of libertarianism may yet go wrong, but so far it’s done a lot better than anyone expected.
If capital starts to feel more welcome in these economies at a time when the US appears to be actively trying to discourage foreign capital — well, capital typically doesn’t need to be told twice.
Secondly, Louis Vincent-Gave, chief executive of consultancy Gavekal, made the good point that amid the US retreat from the world, Latin America has the advantage of still being part of what the US views as its sphere of influence.
That gives the region an important advantage in terms of being more sheltered from hostile US economic policies. Moreover, most countries in Latin America still have considerable room to cut interest rates, which tends to be good news for domestic markets.
In short, if you’re looking to get a bit of diversification into your portfolio, then this looks like yet another underappreciated and undervalued region to dig into.
U.S. money market funds witnessed huge inflows in the week ended June 4 as investor caution over a rise in U.S. tariffs on steel imports, uncertainties over President Donald Trump's trade disputes with China and a crucial employment report on Friday, boosted demand for safer investment avenues.
According to LSEG Lipper data, U.S. investors bought a net $66.24 billion worth of money market funds during the week, registering their largest weekly net purchase since December 4, 2024.
At the same time, riskier equity funds faced a net $7.42 billion worth of weekly outflows, sharply higher than approximately $5.39 billion worth of net disposals in the prior week.
The small-cap segment witnessed a net $2.99 billion worth of drawdowns, the highest for a week since April 30. Outflows from multi-cap, mid-cap and large-cap funds stood at $2.13 billion, $1.05 billion and $962 million, respectively.
Sectoral funds, meanwhile, experienced a minor $136 million worth of inflows with investors adding a net $1.15 billion into tech, and $309 million into consumer staples, while withdrawing nearly $1.16 billion from financials.
Weekly net inflows into U.S. bond funds, meanwhile, cooled to a four-week low of $4.8 billion during the week.
Despite the weaker demand in the broader segment, the short-to-intermediate investment-grade funds turned popular, grossing a net $3.98 billion- the highest since November 2024- worth of inflows during the week.
Inflation-protected funds and general domestic taxable fixed income funds also attracted a significant $634 million and $505 million, worth of inflows.
The OPEC+ producer group is expected to accelerate supply hikes later this year, possibly leading to a surplus in the fourth quarter that could place some downward pressure on oil prices, according to analysts at HSBC.
Since April, the Organization of the Petroleum Exporting Countries and its allies, a group known as OPEC+, has either made or announced output upticks totalling some 1.37 million barrels per day, or 62% of the 2.2 million of the total amount of supply it plans to put back into the market.
Strategists have suggested that these countries, which include producers like Saudi Arabia and Russia, are attempting to recapture some market share during a time of broader economic uncertainty stemming from global trade tensions and an ongoing transition to greener fuel sources.
At its May meeting, OPEC+ confirmed that it will raise its quota by 411,000 bpd for July, roughly equivalent to three monthly output increases and the same as May and June, the HSBC analysts said in a note to clients on Friday.
Meanwhile, recent data from the Energy Information Administration showed that global crude production is tipped to expand by 840,000 barrels per day this year and by 680,000 bpd in 2026.
Against this backdrop, the HSBC analysts led by Kim Fustier predicted that OPEC+ will pump up supply by 411,000 and 274,000 bpd in August and September, respectively -- a move the brokerage said would compress "five increases into two months".
Traditionally strong demand in the summer travel season is expected to absorb the impact of the OPEC+ output increases, the HSBC analysts said. But they flagged that the hikes "should tip the market into a bigger fourth quarter surplus than previously forecasted".
"Deteriorating fundamentals after summer raise downside risks to oil prices and our $65 per barrel assumption from fourth quarter onwards," the analysts added.
On Friday, oil prices were choppy as traders eyed concerns over slowing growth and weakening demand, but were still on track for the first positive week in three amid growing expectations that global supplies will be tighter than initially expected this year.
At 06:43 ET, Brent futures rose 0.1% to $65.41 a barrel, and U.S. West Texas Intermediate crude futures increased by 0.1% to $63.41 per barrel.
The European Central Bank (ECB) should take a break from lowering interest rates to give officials a chance to assess recent shocks, particularly from trade, according to Governing Council member Yannis Stournaras.
“Now the best thing is wait and see,” the Greek central bank chief told Bloomberg Television. “It’s nearly done but with such uncertainty worldwide you can never say it’s done.”
The comments echo President Christine Lagarde on Thursday after the ECB reduced its deposit rate for an eighth time, to 2%. That move left policymakers “in a good position to navigate the uncertain conditions that will be coming up”, she said.
Officials envisage a pause when they next set policy in July, with some possibly even seeing the campaign as finished, according to people familiar with the matter.
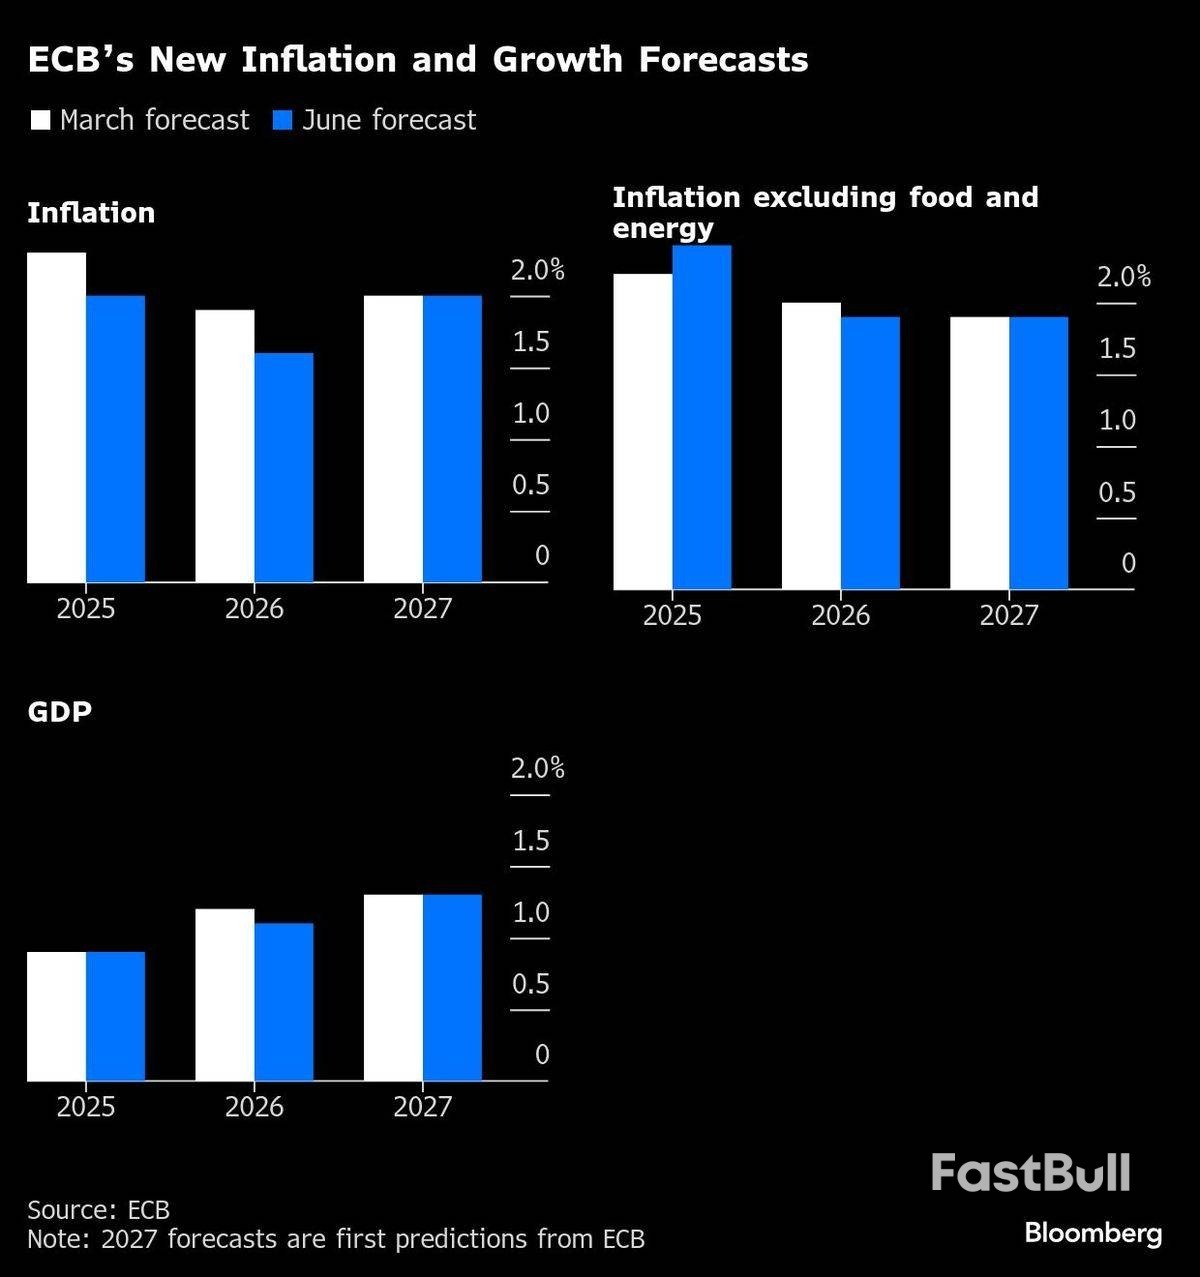
Stournaras said another decrease in borrowing costs would need the eurozone’s 20-nation economy to weaken beyond what’s currently envisaged, stranding inflation below the 2% target — a scenario he doesn’t see happening.
“The bar for another rate cut is high, in July and beyond,” he said in a separate Bloomberg interview in London. “It would need big downward surprises to cut again — so, much weaker growth or much stronger disinflation. But we keep all options open as uncertainty is high and there are many known and unknown unknowns.”
Inflation eased more than expected in May, to 1.9%. New ECB projections published on Thursday foresee prices rising by just 1.6% in 2026 before hitting 2% in 2027.
“I’m not worried about a temporary undershooting of inflation, and at the moment I don’t see a risk of ending up in a too-low inflation scenario as pre-pandemic,” Stournaras said. “If there’s a reversal in US tariff policy and a more careful fiscal policy in the US, the strength of the euro may quickly reverse.”
At the same time, the economy has proved resilient with a stronger-than-anticipated performance at the start of the year that was revised higher still on Friday, to a quarterly advance of 0.6%. It’s yet to feel the full force of US tariffs, however. The ECB expects expansion of 0.9% this year and 1.1% next.
“If the economy continues as we have forecast, I think we’ll stay at 2%,” Stournaras said. “If the economy weakens, we might go below. If the economy strengths, we might change course.”
He advocated a “smooth, steady-hand policy,” without cutting rates too much and too fast, only to have to raise them quickly later.
Stournaras said views among the Governing Council aren’t too far apart, with this week’s decision almost unanimous.
“The difference between what you’d call dovish and hawkish is not that big,” he said. “We have converged.”
The season’s rising mercury now brings a familiar pattern: Europe and Asia step up their competition to secure cargoes of liquefied natural gas.
So far this year, despite a bigger need to fill depleted inventories and forecasts for scorching weather, Europe appears to be winning the supply it needs. Prices, while still higher than last year, have been trading in a narrow range for a month now.
With Russian gas largely lost, Europe needs about €7 billion ($8 billion) of additional LNG imports from April to October, according to Bloomberg Intelligence. Currently, shipments to the continent are higher than usual for this time of year, ship-tracking data compiled by Bloomberg show.
By contrast, China’s imports have been sluggish over four consecutive months, primarily because of weaker economic activity, tariff tensions with the US and rising domestic alternatives.
In addition, two tankers bound for India this month diverted to Europe mid-journey because of ample inventories and cooler-than-expected weather in the south Asian nation.
“Asia Pacific LNG demand is shaping up to be muted,” Aldo Spanjer, head of energy strategy at BNP Paribas SA, said in a note this week. “Europe will be able to attract enough LNG this summer to start Winter-25 with a relatively comfortable stock level.”
Imports by northwest Europe and Italy could be roughly one-third higher than last year, which would translate to continued healthy injections into storage, according to BloombergNEF.
Strong power generation from renewables will help cushion the stress from growing demand, while global supplies of the super-chilled fuel will top up when Shell Plc’s LNG Canada project starts exporting as soon as late June.
So far, so good for Europe, but competition could get worse in July and August, the hottest months in the Northern Hemisphere. Gas-hungry Egypt is about to demonstrate greater appetite for LNG in the coming weeks.
That means some cargoes initially meant for Europe may be diverted, potentially leading to higher prices and slower stockpiling.
Where does a giant refinery in Nigeria, Africa’s largest oil producer, go to source the raw materials it needs to make fuels for 228 million people? Try crude fields around Midland in West Texas, about 6,500 miles away. This year, the Dangote refinery bought a third of its crude from the US, mostly West Texas Intermediate-Midland, ship tracking compiled by Bloomberg shows. The proportion has been almost double what it was last year.
The London Metal Exchange has compelled Mercuria Energy Group Ltd. to lend out its huge position in aluminum to other traders to reduce risks to the market, according to people familiar with the matter.
The US is using its dominance of a niche petroleum gas — ethane — as a bargaining chip in its trade war with China.
Nippon Steel Corp. and United States Steel Corp. are on pace to finalize their $14.1 billion combination with Trump administration before a June 18 deadline, according to people familiar with the matter.
Silver extended gains to 13-year highs while platinum reached its highest level since early 2022, signaling growing investor appetite for the precious metals used in key industries.
Stonepeak Partners is in exclusive talks for a buyout of Yinson Holdings Bhd. that may value the Malaysian energy infrastructure company at as much as 9 billion ringgit ($2.1 billion), according to people with knowledge of the matter.
Industrial decarbonization initiatives are the latest to take a hit in the US as the Trump administration rolls back climate-related funding. The cement and chemicals industries were the largest beneficiaries of the $6 billion allocated last year by the Department of Energy’s Industrial Demonstrations Program. These sectors have now seen the largest cuts, with the government withdrawing about 90% of the grants, according to BNEF.
A warming planet, complex geopolitics and fierce competition are putting companies’ operations under increasing scrutiny. The Bloomberg Sustainable Business Summit returns to London on June 26 to explore ways to bolster resilience and mitigate risk.
JPMorgan Chase (JPM -0.99%) is a sprawling financial services titan. This mega-bank has produced a total return of 208% in the past five years. It's difficult for anyone to complain about that type of gain.
As of this writing, shares of JPMorgan Chase trade just 5% off of their all-time high. Investors might have their eyes on the business if they're looking to gain more exposure to the industry in their portfolio, but where will this top bank stock be in five years?
JPMorgan's impressive stock performance in the past five years has been driven, unsurprisingly, by strong financial gains. In 2024, the company reported revenue of $178 billion, which was 54% higher than in 2019. What's more, diluted earnings per share soared 84% during that time.
The momentum has continued into 2025, despite recent economic challenges. In Q1, total deposits were up 2% year over year, providing low-cost funding to power loan growth. Net interest income rose 1%, with non-interest income jumping 17%.
This doesn't mean there aren't risks to be mindful of. Since banks in general are so exposed to the economy and credit cycle, a potential cause for concern is the chance of a recession happening. Even CEO Jamie Dimon isn't exactly the most optimistic. On the Q1 2025 earnings call, he agreed with JPMorgan's chief U.S. economist, putting the chance of a recession at 50-50.
As of March 31, JPMorgan Chase had a whopping $2.5 trillion in total assets on the balance sheet. What's more, it carries a massive market cap of $736 billion. And in the last 12 months, it raked in $181 billion in net revenue. This is a truly colossal organization.
This business is the clear leader in the financial services sector, with its hands in numerous different areas. Not only does JPMorgan have a significant presence in capital markets and investment banking activities, but it's also a strong player in asset and wealth management, as well as in consumer banking. This diversity presents a favorable setup. Weakness in one area can be more than offset by robustness in another.
Investors can rest assured knowing that this company won't be disrupted anytime soon, if ever. It has built up durable competitive advantages that support its staying power.
There are cost advantages that stem from the company's huge scale. It's able to leverage expenses and investments in many areas, such as technology and marketing efforts.
Then there are switching costs, both for corporate customers and individual consumers. Because JPMorgan Chase can essentially offer any financial product or service its customers need, the more ingrained it becomes, the harder it is for customers to leave.
It also helps to have industry veteran Jamie Dimon at the helm, who many agree is one of the best CEOs. He successfully navigated the Great Recession, making JPMorgan an even better bank.
The stock has done remarkably well in the past. And given the factors just mentioned, investors are probably wondering why they don't own JPMorgan Chase.
Despite a positive view of the company, I don't believe future returns will resemble the past. The main reason why comes down to valuation. Shares trade at a steep price-to-earnings ratio of 13, which is above the trailing five- and 10-year averages.
Investors familiar with the banking industry might be more inclined to look at the price-to-book ratio. As of this writing, this metric stands at 2.2, near the highest it has been in the past 20 years. Consequently, I wouldn't be surprised if this stock lags the broader market between now and 2030.
728 RM B 7/F GEE LOK IND BLDG NO 34 HUNG TO RD KWUN TONG KLN HONG KONG


White Label
Data API
Web Plug-ins
Poster Maker
Affiliate Program
The risk of loss in trading financial instruments such as stocks, FX, commodities, futures, bonds, ETFs and crypto can be substantial. You may sustain a total loss of the funds that you deposit with your broker. Therefore, you should carefully consider whether such trading is suitable for you in light of your circumstances and financial resources.
No decision to invest should be made without thoroughly conducting due diligence by yourself or consulting with your financial advisors. Our web content might not suit you since we don't know your financial conditions and investment needs. Our financial information might have latency or contain inaccuracy, so you should be fully responsible for any of your trading and investment decisions. The company will not be responsible for your capital loss.
Without getting permission from the website, you are not allowed to copy the website's graphics, texts, or trademarks. Intellectual property rights in the content or data incorporated into this website belong to its providers and exchange merchants.
Not Logged In
Log in to access more features

FastBull Membership
Not yet
Purchase


Log In
Sign Up


