• Trade
  • Markets
  • Copy
  • Contests
  • 24/7
  • Calendar
  • Q&A
  • Chats
Screeners
SYMBOL
LAST
BID
ASK
HIGH
LOW
NET CHG.
%CHG.
SPREAD
SOURCE
SPX
S&P 500 Index
7492.04
7492.04
7492.04
7499.46
7463.29
+46.31
+ 0.62%
--
--
DJI
Dow Jones Industrial Average
50722.67
50722.67
50722.67
50755.60
50434.65
+437.02
+ 0.87%
--
--
IXIC
NASDAQ Composite Index
26430.56
26430.56
26430.56
26504.55
26309.80
+137.48
+ 0.52%
--
--
USDX
US Dollar Index
99.170
99.170
99.250
99.340
99.080
+0.030
+ 0.03%
--
--
EURUSD
Euro / US Dollar
1.16099
1.16099
1.16107
1.16210
1.15880
-0.00068
-0.06%
--
--
GBPUSD
Pound Sterling / US Dollar
1.34434
1.34434
1.34443
1.34625
1.34129
+0.00149
+ 0.11%
--
--
XAUUSD
Gold / US Dollar
4514.03
4514.03
4514.44
4545.94
4491.55
-28.85
-0.64%
--
--
WTI
Light Sweet Crude Oil
96.078
96.078
96.108
98.439
94.591
-1.105
-1.14%
--
--

Community Accounts

Signal Accounts
--
Profit Accounts
--
Loss Accounts
--
View More

Become a signal provider

Sell trading signals to earn additional income

View More

Guide to Copy Trading

Get started with ease and confidence

View More

Signal Accounts for Members

All Signal Accounts

Best Return
  • Best Return
  • Best P/L
  • Best MDD
Past 1W
  • Past 1W
  • Past 1M
  • Past 1Y

All Contests

  • All
  • Recommend
  • Stocks
  • Cryptocurrencies
  • Central Banks
  • Trump Updates
  • Featured News
Top News Only
Share

Minister Wang Wentao Met With U.S. Deputy Trade Representative Switzer

Share

China And Australia Convened The 18th Ministerial Economic Joint Committee

Share

European Commission President Ursula Von Der Leyen: A Historic EU-Mexico Summit Is Underway. Europe And Mexico Can Offer Each Other Many Resources. But More Importantly, We Can Achieve Even More Together. A Stronger Partnership Begins Today

Share

U.S. Secretary Of State Rubio: I Participated In A Productive NATO Meeting And Am Leaving Sweden. Our Goal Is To Make NATO Stronger. The Stronger Our NATO Allies Are, The Stronger NATO Will Be

Share

U.S. Treasury Secretary Bessenter: Federal Reserve Chairman Warsh Should Act Responsibly On Inflation And Economic Growth

Share

U.S. Treasury Secretary Bessant: Federal Reserve Chairman Warsh Will Make The Right Decision On Interest Rate Cuts

Share

The Newly Appointed Federal Reserve Chair, Ben Bernanke, Has Completed His Swearing-in Ceremony And Concluded His Remarks

Share

Newly Appointed Federal Reserve Chairman Warsh Has Completed His Swearing-in Ceremony And Concluded His Remarks

Share

Federal Reserve Chair Kashkari: We Will Learn From Past Mistakes And Successes

Share

Fed Chair Waller: Will Lead A Reform-oriented Federal Reserve

Share

Federal Reserve Chairman Warsh: We Will Learn From Past Mistakes And Successes

Share

Federal Reserve Chairman Warsh: Inflation Can Decrease And The Economy Will Grow Strongly

Share

Federal Reserve Chair Kashkari: 'I Am Not Naive And Fully Understand The Challenges We Face.'

Share

Federal Reserve Chairman Warsh: The Next Few Years Will Bring Unparalleled Prosperity

Share

Federal Reserve Chairman Warsh: I Am Not Naive; I Am Well Aware Of The Challenges We Face

Share

Federal Reserve Chairman Walsh: He Will Fulfill This Responsibility With Abundant Energy And A Strong Sense Of Mission

Share

Waller Was Sworn In As The 17th Chair Of The Federal Reserve

Share

Federal Reserve Chair Powell: Thank You, President Trump. We Are At An Important Moment

Share

Federal Reserve Chairman Warsh: Thank You, President Trump. We Are At A Crucial Moment

Share

Trump Presided Over The Ceremony Marking Wash's Inauguration As Federal Reserve Chair

TIME
ACT
FCST
PREV
IMPACT
BOE Gov Bailey Speaks
Richmond Federal Reserve President Barkin delivered a speech.
U.S. 10-Year TIPS Auction Avg. Yield

A:--

F: --

P: --

XAUUSD
  • XAUUSD
  • XAGUSD
  • WTI
  • USDX
U.S. Weekly Treasuries Held by Foreign Central Banks

A:--

F: --

P: --

USDX
  • USDX
  • XAUUSD
  • XAGUSD
  • WTI
U.K. GfK Consumer Confidence Index (May)

A:--

F: --

P: --

GBPUSD
  • GBPUSD
  • XAUUSD
  • XAGUSD
  • WTI
Japan CPI MoM (Apr)

A:--

F: --

P: --

USDJPY
  • USDJPY
  • XAUUSD
  • XAGUSD
  • WTI
  • USDX
Japan National CPI MoM (Apr)

A:--

F: --

P: --

USDJPY
  • USDJPY
  • XAUUSD
  • XAGUSD
  • WTI
Japan National CPI YoY (Apr)

A:--

F: --

P: --

USDJPY
  • USDJPY
  • XAUUSD
  • XAGUSD
  • WTI
Japan National Core CPI YoY (Apr)

A:--

F: --

P: --

USDJPY
  • USDJPY
  • XAUUSD
  • XAGUSD
  • WTI
Japan National CPI MoM (Not SA) (Apr)

A:--

F: --

P: --

USDJPY
  • USDJPY
  • XAUUSD
  • XAGUSD
  • WTI
ECB Chief Economist Lane Speaks
U.K. Retail Sales MoM (SA) (Apr)

A:--

F: --

P: --

GBPUSD
  • GBPUSD
  • XAUUSD
  • XAGUSD
  • WTI
  • USDX
U.K. Retail Sales YoY (SA) (Apr)

A:--

F: --

P: --
GBPUSD
  • GBPUSD
  • XAUUSD
  • XAGUSD
  • WTI
  • USDX
Germany GfK Consumer Confidence Index (SA) (Jun)

A:--

F: --

P: --
EURUSD
  • EURUSD
  • XAUUSD
  • XAGUSD
  • WTI
  • USDX
U.K. Core Retail Sales YoY (SA) (Apr)

A:--

F: --

P: --
GBPUSD
  • GBPUSD
  • XAUUSD
  • XAGUSD
  • WTI
  • USDX
ECB Chief Economist Lane Speaks
Turkey Capacity Utilization (May)

A:--

F: --

P: --

XAUUSD
  • XAUUSD
  • XAGUSD
  • WTI
  • USDX
Turkey Trade Balance (Apr)

A:--

F: --

P: --

XAUUSD
  • XAUUSD
  • XAGUSD
  • WTI
  • USDX
Germany Ifo Current Business Situation Index (SA) (May)

A:--

F: --

P: --

EURUSD
  • EURUSD
  • XAUUSD
  • XAGUSD
  • WTI
  • USDX
Germany Ifo Business Expectations Index (SA) (May)

A:--

F: --

P: --
EURUSD
  • EURUSD
  • XAUUSD
  • XAGUSD
  • WTI
  • USDX
Germany IFO Business Climate Index (SA) (May)

A:--

F: --

P: --
EURUSD
  • EURUSD
  • XAUUSD
  • XAGUSD
  • WTI
  • USDX
Mexico Economic Activity Index YoY (Mar)

A:--

F: --

P: --

XAUUSD
  • XAUUSD
  • XAGUSD
  • WTI
  • USDX
Canada Industrial Product Price Index YoY (Apr)

A:--

F: --

P: --
USDCAD
  • USDCAD
  • XAUUSD
  • XAGUSD
  • WTI
  • USDX
Canada Retail Sales MoM (SA) (Mar)

A:--

F: --

P: --

USDCAD
  • USDCAD
  • XAUUSD
  • XAGUSD
  • WTI
  • USDX
Canada Industrial Product Price Index MoM (Apr)

A:--

F: --

P: --
USDCAD
  • USDCAD
  • XAUUSD
  • XAGUSD
  • WTI
  • USDX
Canada Core Retail Sales MoM (SA) (Mar)

A:--

F: --

P: --
USDCAD
  • USDCAD
  • XAUUSD
  • XAGUSD
  • WTI
  • USDX
U.S. Conference Board Leading Economic Index MoM (Apr)

A:--

F: --

P: --

USDX
  • USDX
  • XAUUSD
  • XAGUSD
  • WTI
U.S. Conference Board Leading Economic Index (Apr)

A:--

F: --

P: --

USDX
  • USDX
  • XAUUSD
  • XAGUSD
  • WTI
U.S. Conference Board Coincident Economic Index MoM (Apr)

A:--

F: --

P: --

USDX
  • USDX
  • XAUUSD
  • XAGUSD
  • WTI
U.S. Conference Board Lagging Economic Index MoM (Apr)

A:--

F: --

P: --

USDX
  • USDX
  • XAUUSD
  • XAGUSD
  • WTI
U.S. Weekly Total Rig Count

--

F: --

P: --

U.S. Weekly Total Oil Rig Count

--

F: --

P: --

Argentina Retail Sales YoY (Mar)

--

F: --

P: --

Turkey Economic Sentiment Indicator (May)

--

F: --

P: --

Brazil Current Account (Apr)

--

F: --

P: --

Canada National Economic Confidence Index

--

F: --

P: --

Mexico Trade Balance (Apr)

--

F: --

P: --

U.K. BRC Shop Price Index YoY (May)

--

F: --

P: --

U.K. CBI Retail Sales Expectations Index (May)

--

F: --

P: --

U.K. CBI Distributive Trades (May)

--

F: --

P: --

U.S. Chicago Fed National Activity Index (Apr)

--

F: --

P: --

U.S. S&P/CS 20-City Home Price Index YoY (Not SA) (Mar)

--

F: --

P: --

U.S. S&P/CS 20-City Home Price Index MoM (SA) (Mar)

--

F: --

P: --

U.S. FHFA House Price Index MoM (Mar)

--

F: --

P: --

U.S. FHFA House Price Index (Mar)

--

F: --

P: --

U.S. FHFA House Price Index YoY (Mar)

--

F: --

P: --

U.S. S&P/CS 10-City Home Price Index MoM (Not SA) (Mar)

--

F: --

P: --

U.S. S&P/CS 10-City Home Price Index YoY (Mar)

--

F: --

P: --

U.S. S&P/CS 20-City Home Price Index (Not SA) (Mar)

--

F: --

P: --

U.S. S&P/CS 20-City Home Price Index MoM (Not SA) (Mar)

--

F: --

P: --

U.S. Conference Board Consumer Expectations Index (May)

--

F: --

P: --

U.S. Conference Board Consumer Confidence Index (May)

--

F: --

P: --

U.S. Conference Board Present Situation Index (May)

--

F: --

P: --

U.S. Dallas Fed General Business Activity Index (May)

--

F: --

P: --

U.S. Dallas Fed New Orders Index (May)

--

F: --

P: --

U.S. 2-Year Note Auction Avg. Yield

--

F: --

P: --

Australia Westpac Leading Index MoM (Apr)

--

F: --

P: --
China, Mainland Industrial Profit YoY (YTD) (Apr)

--

F: --

P: --

Australia Construction Work Done YoY (Q1)

--

F: --

P: --

Australia Construction Work Done QoQ (SA) (Q1)

--

F: --

P: --

Q&A with Experts
    • All
    • Chatrooms
    • Groups
    • Friends
    Nawhdir Øt flag
    EuroTrader
    @Nawhdir ØtHow about the past three weeks results or the previous week results
    @EuroTraderLOST!
    3DX cheetah flag
    EuroTrader
    @3DX cheetahAnd only the risk managers have money to trade next week. Risk management is key
    @EuroTradertrue
    Nawhdir Øt flag
    john
    @Nawhdir Øt I am just surprised,,,because I have seen you trade and make profit in every market situation
    @johnbut finally, in this NY session 👇
    Nawhdir Øt flag
    3DX cheetah flag
    Nawhdir Øt
    @EuroTraderLOST!
    @Nawhdir Øtthis guy is doing well. there is another guy that does this scalping well here . he comes around Asian . only that my boss don't let him have peace
    3DX cheetah flag
    @EuroTraderoga I go like to see ur acc too
    Nawhdir Øt flag
    3DX cheetah
    @Nawhdir Øtthis guy is doing well. there is another guy that does this scalping well here . he comes around Asian . only that my boss don't let him have peace
    @3DX cheetahsi Mandarin itu, ya?
    3DX cheetah flag
    this time around show entry and exit . no need for acc statement
    john flag
    Nawhdir Øt
    @johnbut finally, in this NY session 👇
    @Nawhdir Øt Yeah this cool,,,my lesso this week from the market is "don't follow the noise"
    3DX cheetah flag
    Nawhdir Øt
    @3DX cheetahsi Mandarin itu, ya?
    @Nawhdir Øti don't kn his .name but both of them always fight
    EuroTrader flag
    3DX cheetah
    over trading this week will make brokers money including liquidation
    @3DX cheetahThe brokers only want the traders to keep trading so they can make the money
    3DX cheetah flag
    EuroTrader
    @3DX cheetahThe brokers only want the traders to keep trading so they can make the money
    @EuroTraderur right
    EuroTrader flag
    Nawhdir Øt
    @EuroTraderLOST!
    @Nawhdir ØtThat's not true 🤣🤣💬. You are the seasoned pro that has been making money consistently
    EuroTrader flag
    3DX cheetah
    @EuroTraderur right
    @3DX cheetahi have had brokers reach out to me to refer clients and I get profit split. 🤣🤣🤣
    EuroTrader flag
    3DX cheetah
    @EuroTraderur right
    @3DX cheetahYou see why brokers are not there to allow traders make money. They love losing traders so they get the bucks
    3DX cheetah flag
    EuroTrader
    @3DX cheetahYou see why brokers are not there to allow traders make money. They love losing traders so they get the bucks
    @EuroTraderwhy don't you take the offer
    3DX cheetah flag
    who no know go know
    Nawhdir Øt flag
    3DX cheetah
    this time around show entry and exit . no need for acc statement
    @3DX cheetahyou meant like this ? 👇
    Nawhdir Øt flag
    Nawhdir Øt flag
    just xample
    Type here...
    Add Symbol or Code

      No matching data

      All
      Recommend
      Stocks
      Cryptocurrencies
      Central Banks
      Trump Updates
      Featured News
      • All
      • Russia-Ukraine Conflict
      • Middle East Flashpoint
      • All
      • Russia-Ukraine Conflict
      • Middle East Flashpoint
      Search
      Products

      Charts Free Forever

      Chats Q&A with Experts
      Screeners Economic Calendar Data Tools
      Membership Features
      Data Warehouse Market Trends Institutional Data Policy Rates Macro

      Market Trends

      Market Sentiment Order Book Forex Correlations

      Top Indicators

      Charts Free Forever
      Markets

      News

      24/7 Analysis Education

      Latest Views

      Latest Update

      Signals

      Copy Rankings Latest Signals Become a signal provider AI Rating
      Contests
      Brokers

      Overview Brokers Assessment Rankings Regulators News Claims
      Broker listing Forex Brokers Comparison Tool Live Spread Comparison Scam
      Q&A Complaint Scam Alert Videos Tips to Detect Scam
      More

      Business
      Events
      Careers About Us Advertising Help Center

      White Label

      Broker API

      Data API

      Web Plug-ins

      Affiliate Program

      Awards Institution Evaluation IB Seminar Salon Event Exhibition
      Vietnam Thailand Singapore Dubai
      Fans Party Investment Sharing Session
      FastBull Summit BrokersView Expo
      Recent Searches
        Top Searches
          Markets
          Analysis
          User
          24/7
          Economic Calendar
          Education
          Data
          • Names
          • Latest
          • Prev

          View All

          No data

          Scan to Download

          Faster Charts, Chat Faster!

          Download App
          English
          • English
          • Español
          • العربية
          • Bahasa Indonesia
          • Bahasa Melayu
          • Tiếng Việt
          • ภาษาไทย
          • Français
          • Italiano
          • Türkçe
          • Русский язык
          • 简中
          • 繁中
          Open Account
          Search
          Products
          Charts Free Forever
          Markets
          News
          Signals

          Copy Rankings Latest Signals Become a signal provider AI Rating
          Contests
          Brokers

          Overview Brokers Assessment Rankings Regulators News Claims
          Broker listing Forex Brokers Comparison Tool Live Spread Comparison Scam
          Q&A Complaint Scam Alert Videos Tips to Detect Scam
          More

          Business
          Events
          Careers About Us Advertising Help Center

          White Label

          Broker API

          Data API

          Web Plug-ins

          Affiliate Program

          Awards Institution Evaluation IB Seminar Salon Event Exhibition
          Vietnam Thailand Singapore Dubai
          Fans Party Investment Sharing Session
          FastBull Summit BrokersView Expo

          What Are Order Blocks And Breaker Blocks In The Smart Money Concept?

          FXOpen

          Commodity

          Cryptocurrency

          Stocks

          Forex

          Economic

          Summary:

          Order blocks and breaker blocks are key price action concepts that reflect how institutional participants place and manage their trades.

          Order blocks and breaker blocks are key price action concepts that reflect how institutional participants place and manage their trades. While often overlooked by retail traders, these structures can offer valuable insights into market intent and potential turning points.This article explains what order blocks and breaker blocks are, how they differ, and how traders can use them in market analysis. With a practical approach and clear examples, you'll learn how to identify these patterns on the chart and integrate them into your trading strategy.

          What Is an Order Block in Trading?

          An order block, also known as a supply or demand zone, represents a significant area on the price chart where large market participants, such as banks or institutional traders, have placed substantial buy or sell orders. They’re crucial in understanding the flow and direction of an asset, as they often precede notable movements in price. Particularly in the realm of forex, where the magnitude of transactions can be immense, identifying these zones can provide traders with a strategic edge.

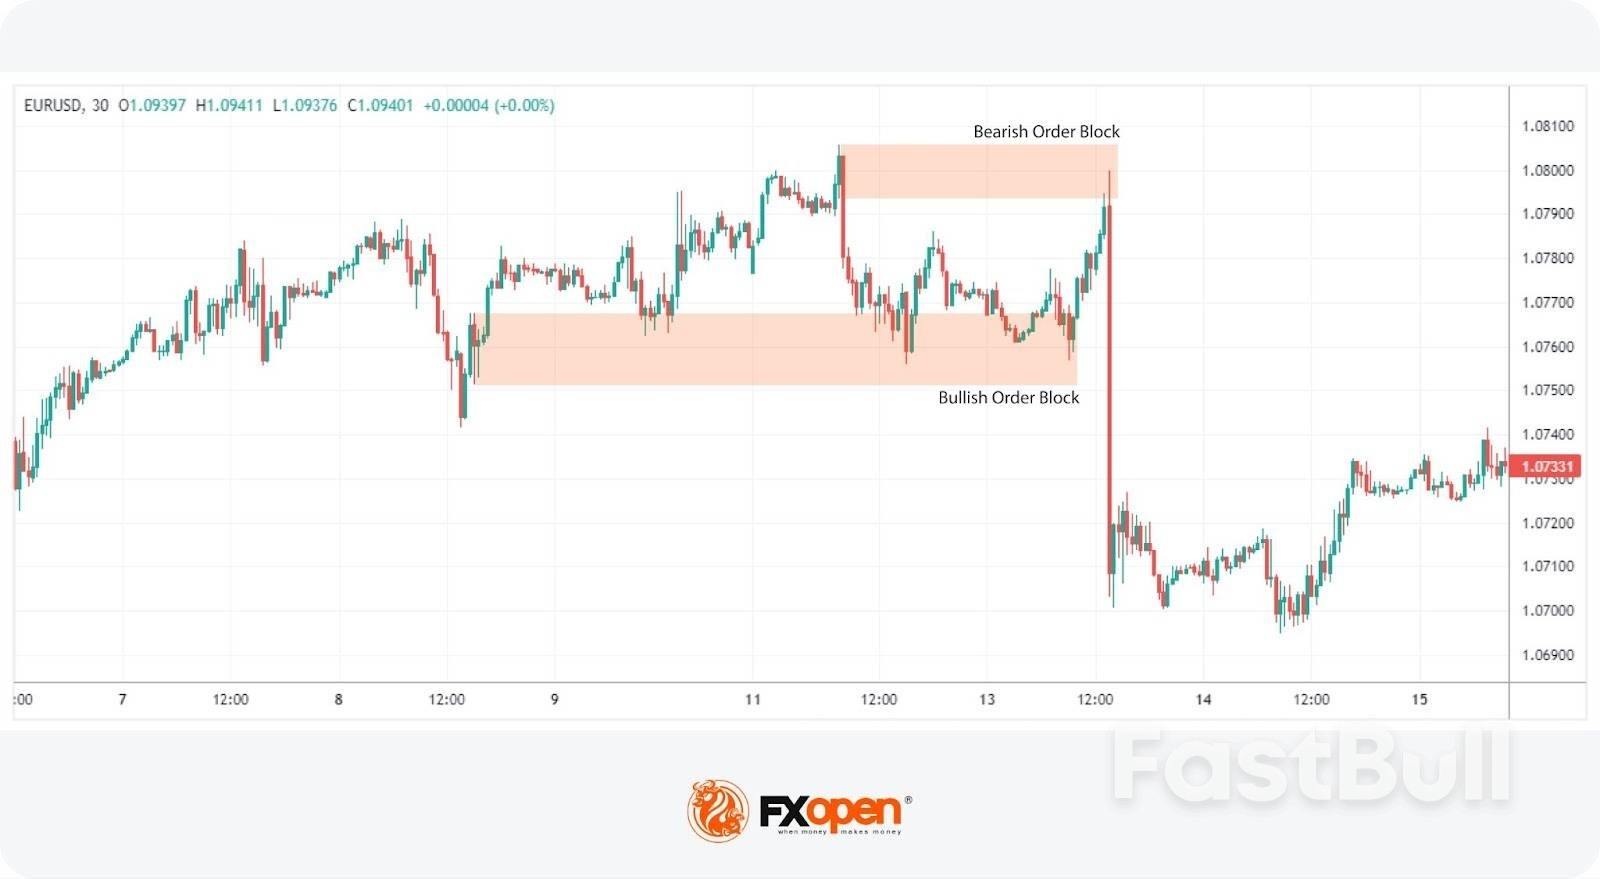
          A bullish order block, or demand zone, is identified during a downward price movement and is the area where the last bearish candle before a substantial upward price movement occurs. This indicates that institutional buyers are stepping in, absorbing sell orders, and preparing to push the price higher. Traders eyeing bullish order blocks anticipate these areas as potential points of interest where price may find support, thus offering a strategic entry point for long positions.

          Conversely, a bearish order block, or supply zone, is found during an upward price movement and is characterised by the area where the last bullish candle appears before a significant downward price shift. This suggests that institutional sellers are overwhelming buyers, likely leading to a decrease in price. Bearish order blocks signal potential resistance zones, presenting opportunities to enter short positions in anticipation of a downward price trajectory.

          In both instances, they typically create an impulse move that breaks a nearby high or low to continue or start a given trend. When the market returns to these areas, they often prompt a reversal of the short-term trend and a continuation of a higher timeframe trend.

          Order blocks in forex are particularly telling due to the high market liquidity and the sheer volume of trades. Recognising these areas allows traders to align their strategies with the likely actions of major institutional players, potentially leading to more informed and effective trade decisions.

          Why Order Blocks Work

          These blocks work because they tap into the underlying dynamics of supply and demand, reflecting the actions of large institutional players whose trades can significantly impact price direction. They’re essentially snapshots of where significant buying or selling pressure has accumulated, offering clues to future price movements.

          When a market approaches a supply or demand zone, the likelihood of a reaction—whether it's a continuation or reversal of the trend—increases because these levels are where institutional traders have previously shown interest, either by initiating large positions or placing take-profit orders.

          Finding and Using Order Blocks

          Now, let’s take a closer look at how to identify and use order blocks for trading.

          Identifying Order Blocks

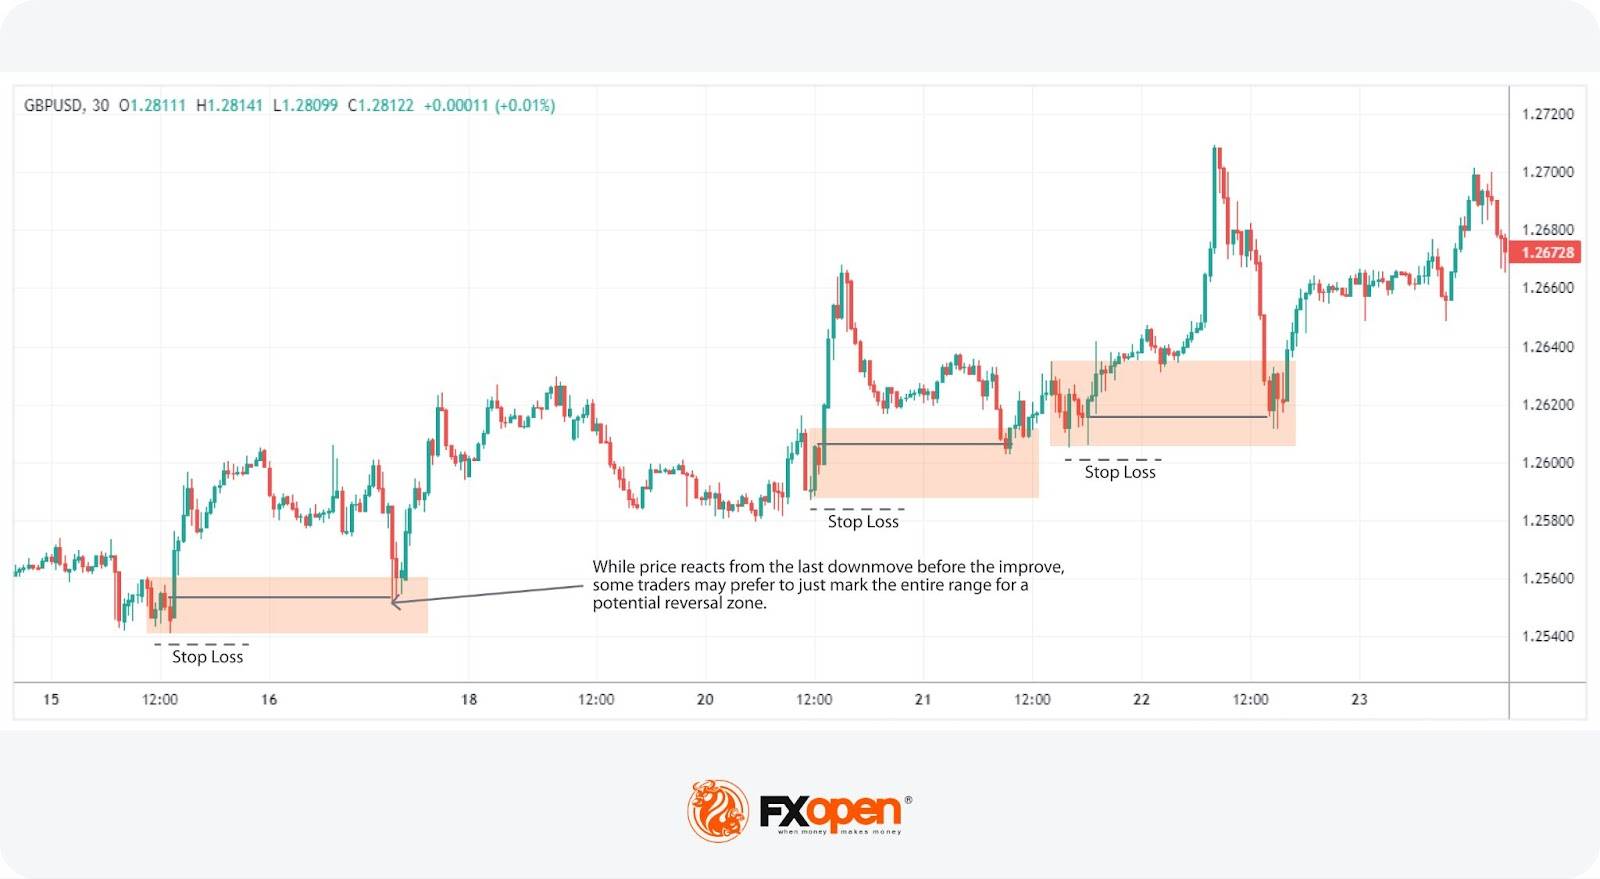
          Traders often start by analysing historical price charts to locate order blocks. Typically, these are found where there was significant trading activity, often in the form of a consolidation, followed by a strong directional price move.A bullish order block is where the last bearish candle in a downtrend occurred before a sharp rise. Conversely, in a bearish order block, traders identify the last bullish candle before a significant fall.Note that order block candles visible on a higher timeframe tend to be more probable. Similarly, a small high-low range on a lower timeframe would appear as a single candlestick on a higher timeframe, meaning that the entire range can be plotted as a supply or demand zone.

          Incorporating Order Blocks into a Trading Strategy

          Incorporating order blocks into a strategy involves observing how the price behaves as it approaches these marked areas. Traders typically watch for price reactions near these zones, using them as indicators of potential entry or exit points. For instance, a price bounce off a demand zone may signal a good opportunity to go long, anticipating upward momentum as institutional interest possibly resurfaces.

          Traders might also combine these areas with indicators and other analysis tools, such as moving averages or Fibonacci retracements, to validate their signals. This multi-faceted approach helps in fine-tuning entry and exit strategies, potentially increasing the likelihood of effective trades.

          Risk Management

          As with any strategy, it's crucial to practise sound risk management when trading with order blocks. Traders often set stop-losses just outside the zone with the assumption that institutional players won’t let the market trade beyond this point. However, when these zones fail, they become known as breaker blocks.

          Understanding Breaker Blocks in Forex

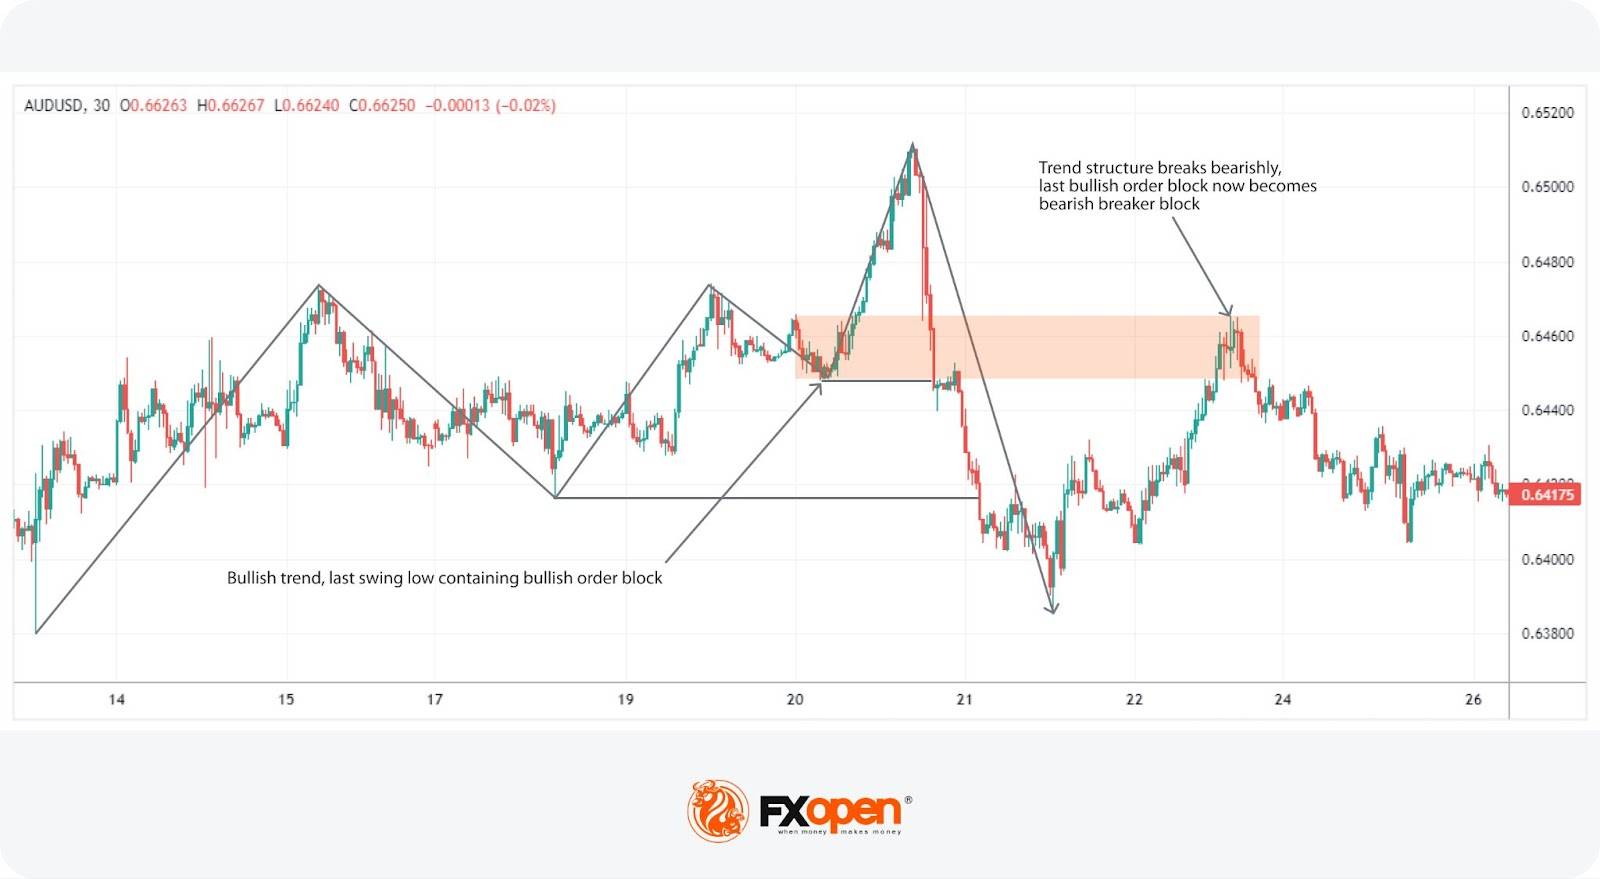
          In the realm of forex, understanding the concept of breaker blocks can be crucial when it comes to identifying potential reversals and continuations in trends. Breaker blocks emerge from the failure of order blocks. When these supply or demand zones do not hold, and the market structure shifts, breaker blocks are formed, marking significant levels to watch.A bearish breaker block occurs after a bullish order block fails. This typically happens when there's an upward trend, and a certain level that was expected to support the market's rise instead gives way, leading to a sharp decline. This decline indicates that sellers have overcome the buyers, absorbing liquidity and shifting the sentiment from bullish to bearish.

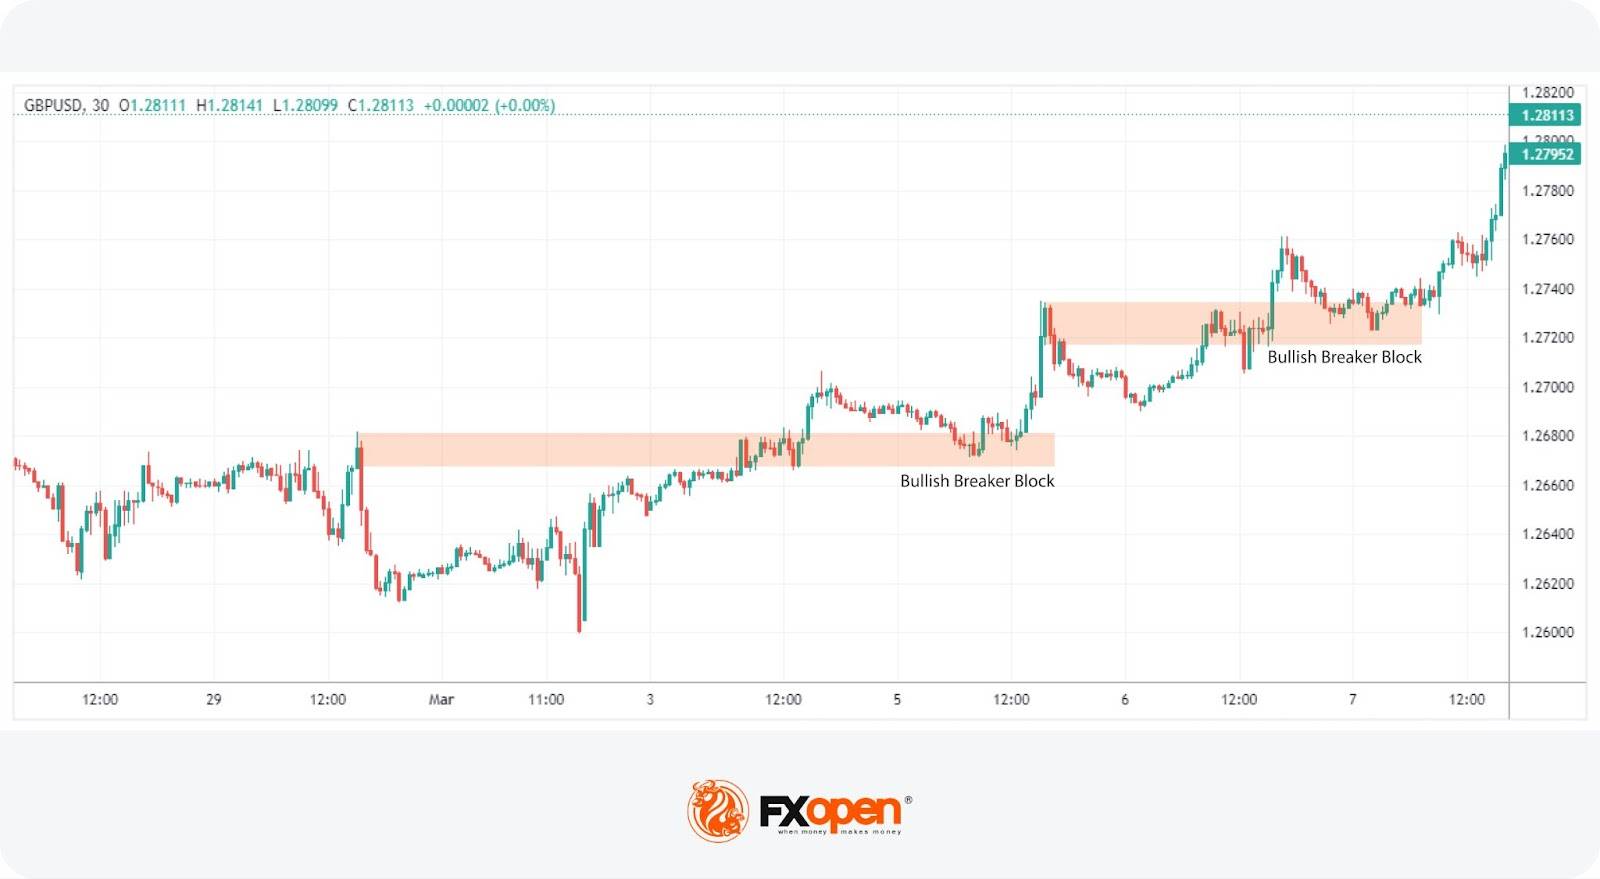
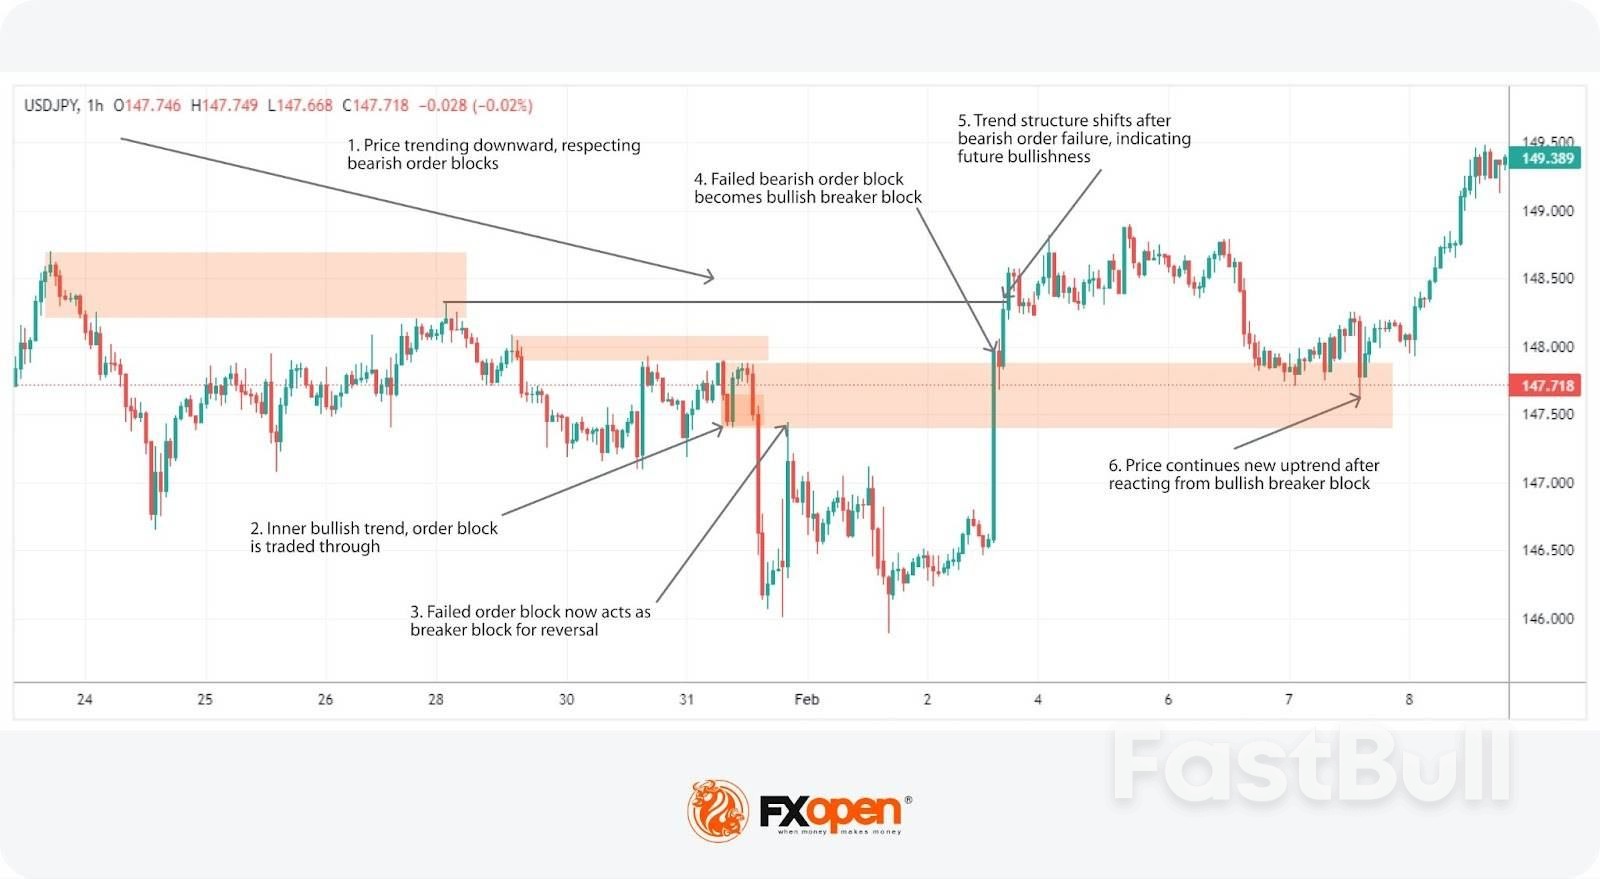
          Conversely, a bullish breaker block is formed from the failure of a bearish order block. In a downtrend, when a level that was expected to act as resistance is breached, and the price shoots up, it signifies that buyers have taken control, overpowering the sellers.In both scenarios, price often retraces to the failed zone before continuing the newly formed trend.

          Finding and Using Breaker Blocks

          To harness the power of breakers, traders adeptly identify these pivotal points and integrate them into a coherent strategy.

          Identifying Breaker Blocks

          The first step involves scrutinising price charts for significant reversals that follow the failure of established supply or demand zones. A bearish breaker block, for instance, would be marked by a sudden decline after a bullish trend fails to sustain, trading through a bullish order block, and vice versa.The most notable breaker blocks are often the order blocks that stand out visually or would need to stay intact if a given trend is to continue. When they fail, they can then be plotted as a valid horizontal level to look for a retracement before a potential move away.

          Strategic Application

          Once identified, these zones can be strategically employed as markers for potential trade entries. For a bearish breaker, traders might consider short positions, anticipating further declines as price retests and rejects the previously failed support level. Conversely, a bullish breaker suggests a potential long position as the market may continue to rise, having breached a significant resistance.

          Combining Order Blocks and Breakers

          Combining these two ideas offers a nuanced approach to forex, especially when integrating the concept of liquidity voids or fair value gaps. These gaps occur when the price makes an impulsive move away from an order block without retracing, potentially marking areas for future reversals. This strategy shines in trending assets, where the directional momentum aligns with the formation of these critical zones, offering potential entry and exit signals.

          Trending and Ranging Markets

          In a trending market, order blocks that prompt sharp price movements away can be key areas to mark for a trend reversal. These marked zones can indicate where significant buying or selling pressure originated, offering potential entry points. However, it's essential to recognise that in a ranging or consolidating market, they might not hold as expected.

          The Role of Breaker Blocks

          When institutional interests shift, leading to the failure of an order block to act as support or resistance, this is where breaker blocks come into play, becoming a critical level to watch. Particularly after a sudden move, if a supply or demand zone ripe for reversal is now too far away to see an immediate retracement, the breaker serves as a strategic entry point ahead of a trend continuation.

          Setting Market Direction with Breaker Blocks

          Breaker blocks not only signal potential entry points but also help set market direction. The breach of an order block by price action indicates a strong likelihood that the asset will continue in that direction, underscoring a shift in institutional interest. When price trades through an order block, showing no signs of halting, it suggests a path for the trend, offering traders insight into the prevailing momentum.

          Limitations of Order and Breaker Blocks

          While order and breaker blocks provide insightful strategies in navigating forex markets, they come with limitations that traders should be aware of:

          ● Market Volatility: High volatility can disrupt the reliability of these zones, leading to false signals.
          ● Institutional Disguise: Large market players may mask their activities, making it challenging to identify genuine order or breaker blocks.
          ● Lagging Indicators: These areas are based on past price behaviour, which might not always be effective when analysing future movements.
          ● Overreliance: Solely depending on these strategies without incorporating other analyses can lead to missed opportunities or misinterpretations.

          FAQs

          What Is an Order Block in Trading?

          An order block refers to a price area on the chart where significant buy or sell orders were previously placed by large institutional traders. These zones are key to identifying potential support or resistance levels, providing insights into future price movements.

          What Is a Breaker Block in Trading?

          A breaker block is a concept that emerges when an order block fails, leading to a change in market structure. It signifies a pivotal point where the market shifts direction, offering traders opportunities to enter trades based on anticipated trend continuation.

          How to Identify Order Blocks?

          Order blocks can be identified by analysing price charts for areas where there was significant trading activity, followed by a strong directional movement. Traders look for the last bullish candle before a downturn for a bearish block, or the last bearish candle before an uptrend for a bullish block, indicating potential zones of interest for traders.

          Source: FXOpen

          To stay updated on all economic events of today, please check out our Economic calendar
          Risk Warnings and Disclaimers
          You understand and acknowledge that there is a high degree of risk involved in trading. Following any strategies or investment methods may lead to potential losses. The content on the site is provided by our contributors and analysts for information purposes only. You are solely responsible for determining whether any trading assets, securities, strategy, or any other product is suitable for investing based on your own investment objectives and financial situation.
          Add to Favorites
          Share
          FastBull
          Copyright © 2026 FastBull Ltd

          728 RM B 7/F GEE LOK IND BLDG NO 34 HUNG TO RD KWUN TONG KLN HONG KONG

          TelegramInstagramTwitterfacebooklinkedin
          App Store Google Play Google Play
          Products
          Charts

          Chats

          Q&A with Experts
          Screeners
          Economic Calendar
          Data
          Tools
          Membership
          Features
          Function
          Markets
          Copy Trading
          Latest Signals
          Contests
          24/7
          Analysis
          Education
          Company
          Careers
          About Us
          Contact Us
          Advertising
          Help Center
          Feedback
          User Agreement
          Privacy Policy
          Personal Information Protection Statement
          Business

          White Label

          Broker API

          Data API

          Web Plug-ins

          Poster Maker

          Affiliate Program

          Risk Disclosure

          The risk of loss in trading financial instruments such as stocks, FX, commodities, futures, bonds, ETFs and crypto can be substantial. You may sustain a total loss of the funds that you deposit with your broker. Therefore, you should carefully consider whether such trading is suitable for you in light of your circumstances and financial resources.

          No decision to invest should be made without thoroughly conducting due diligence by yourself or consulting with your financial advisors. Our web content might not suit you since we don't know your financial conditions and investment needs. Our financial information might have latency or contain inaccuracy, so you should be fully responsible for any of your trading and investment decisions. The company will not be responsible for your capital loss.

          Without getting permission from the website, you are not allowed to copy the website's graphics, texts, or trademarks. Intellectual property rights in the content or data incorporated into this website belong to its providers and exchange merchants.

          Not Logged In

          Log in to access more features

          Connect Broker
          Become a signal provider
          Help Center
          Customer Service
          Dark Mode
          Price Up/Down Colors

          Log In

          Sign Up

          Position
          Layout
          Fullscreen
          Default to Chart
          The chart page opens by default when you visit fastbull.com