


- XAUUSD
- XAGUSD
- WTI
- USDX


Markets
Analysis
User
24/7
Economic Calendar
Education
Data
- Names
- Latest
- Prev


In trading, patterns are powerful tools, allowing traders to anticipate changes in trend direction. One such pattern is the inverted hammer, a formation often seen as a bullish signal following a downtrend.
In trading, patterns are powerful tools, allowing traders to anticipate changes in trend direction. One such pattern is the inverted hammer, a formation often seen as a bullish signal following a downtrend. Recognising this pattern and understanding its implications can be crucial for traders looking to spot reversal opportunities. In this article, we will explore the meaning of inverted hammer candlestick, how to identify it on a price chart, and how traders can incorporate it into their trading strategies.
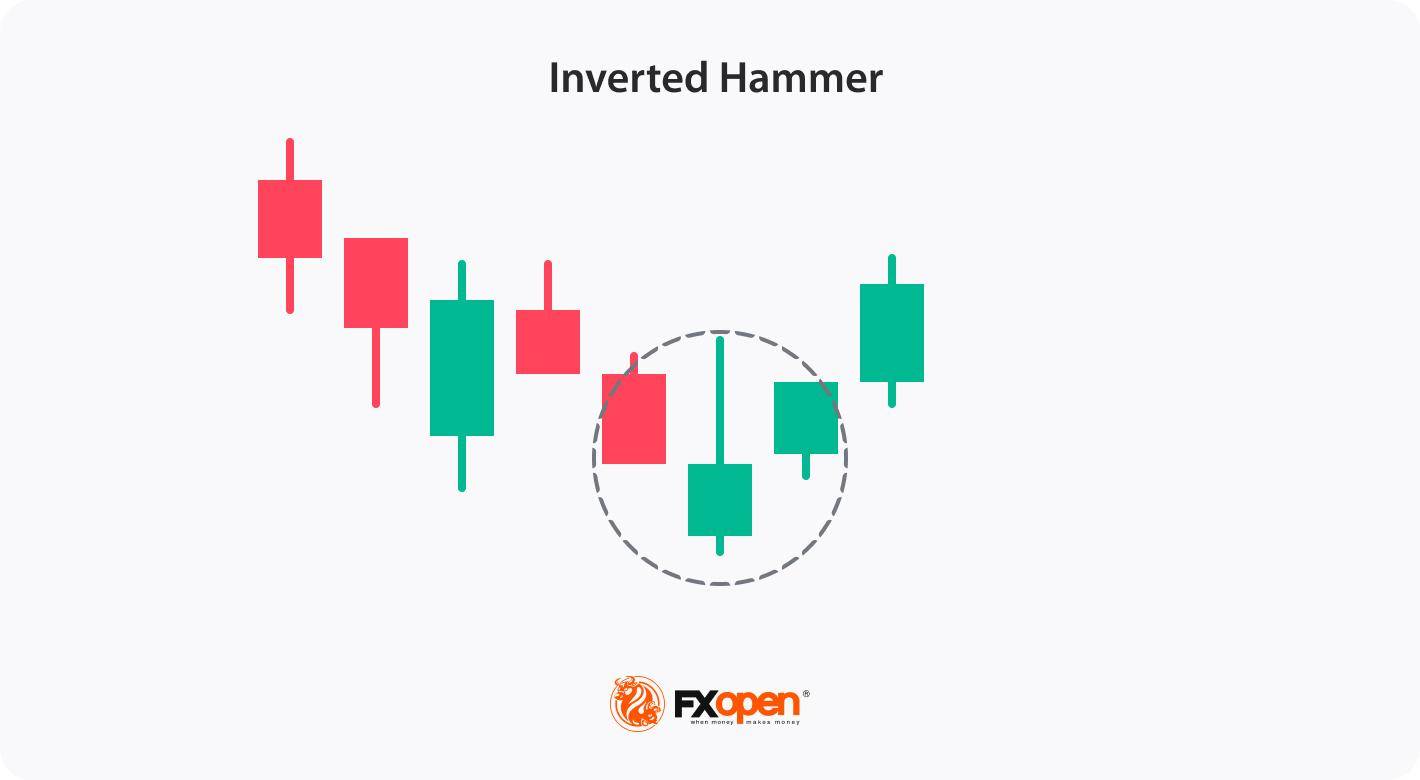
An inverted hammer is a candlestick pattern that appears at the end of a downtrend, typically signalling a potential bullish reversal. It has a distinct shape, with a small body at the lower end of the candle and a long upper wick that is at least twice the size of the body. This structure suggests that although sellers initially dominated, buyers stepped in, pushing prices higher before closing near the opening level. While the inverted hammer alone does not confirm a reversal, it’s often considered a sign of a possible trend change when followed by a bullish move on subsequent candles.
The pattern can have any colour so that you can find a red inverted hammer candlestick or upside down green hammer. Although both will signal a bullish reversal, an inverted green hammer candle is believed to provide a stronger signal, reflecting the strength of bulls.
One of the unique features of this pattern is that traders can apply it to various financial instruments, such as stocks, cryptocurrencies*, ETFs, indices, and forex, across different timeframes.
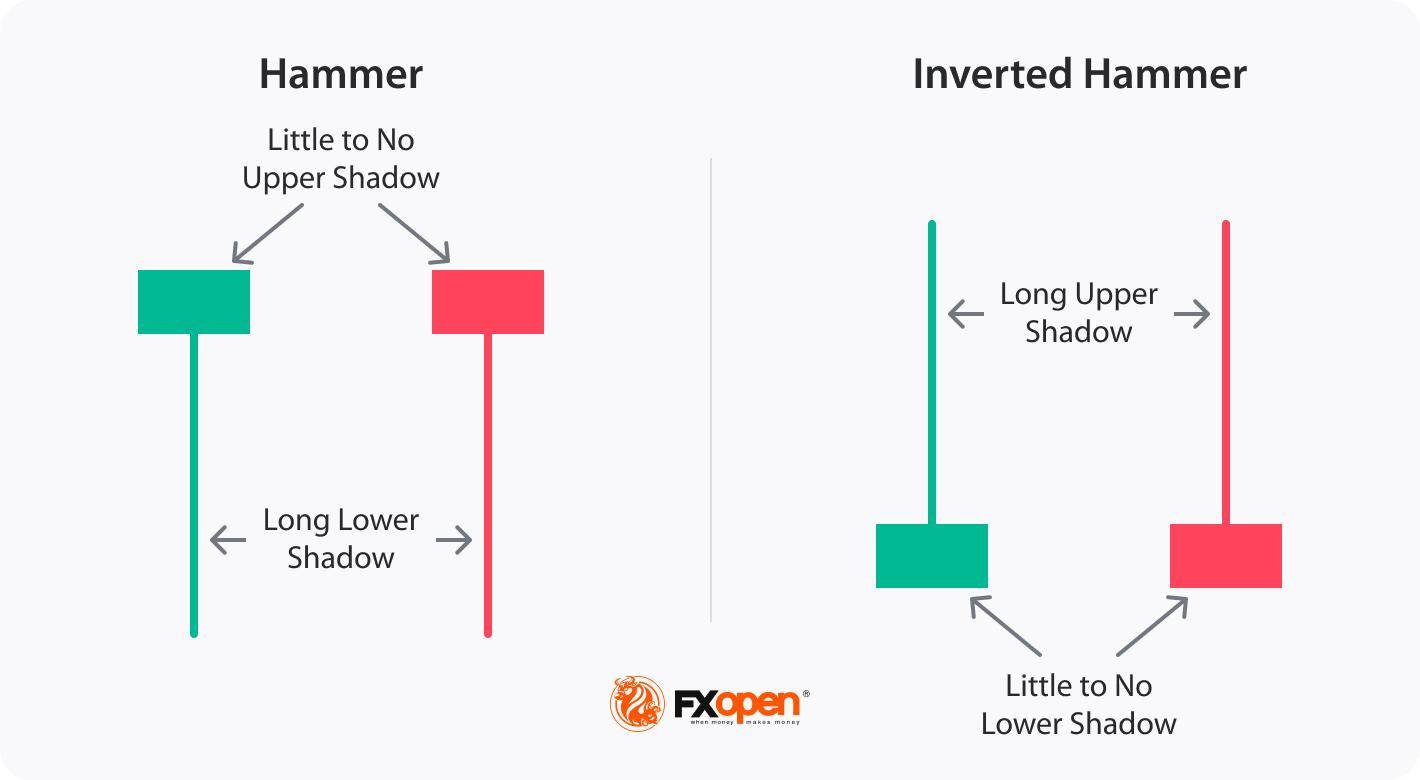
The hammer and inverted hammer are both single-candle patterns that appear in downtrends and signal potential bullish reversals, but they have distinct formations and implications:
Both patterns signal possible bullish sentiment, but while the green or red hammer candlestick focuses on buyer strength after selling, the inverted hammer suggests buyer interest in an overall bearish context, needing further confirmation for a trend shift.
Although the inverted hammer is easy to recognise, there are some rules traders follow to increase the reliability of the reversal signal it provides.
Step 1: Identify the Pattern in a Downtrend
Step 2: Choose Appropriate Timeframes
Step 3: Use Indicators to Strengthen Identification
Step 4: Look for Confirmation Signals
By following these steps and waiting for confirmation signals, traders can increase the reliability of the inverted hammer’s signals.
Trading the inverted hammer involves implementing a systematic approach to capitalise on potential bullish reversals. Here are some steps traders may consider when trading:
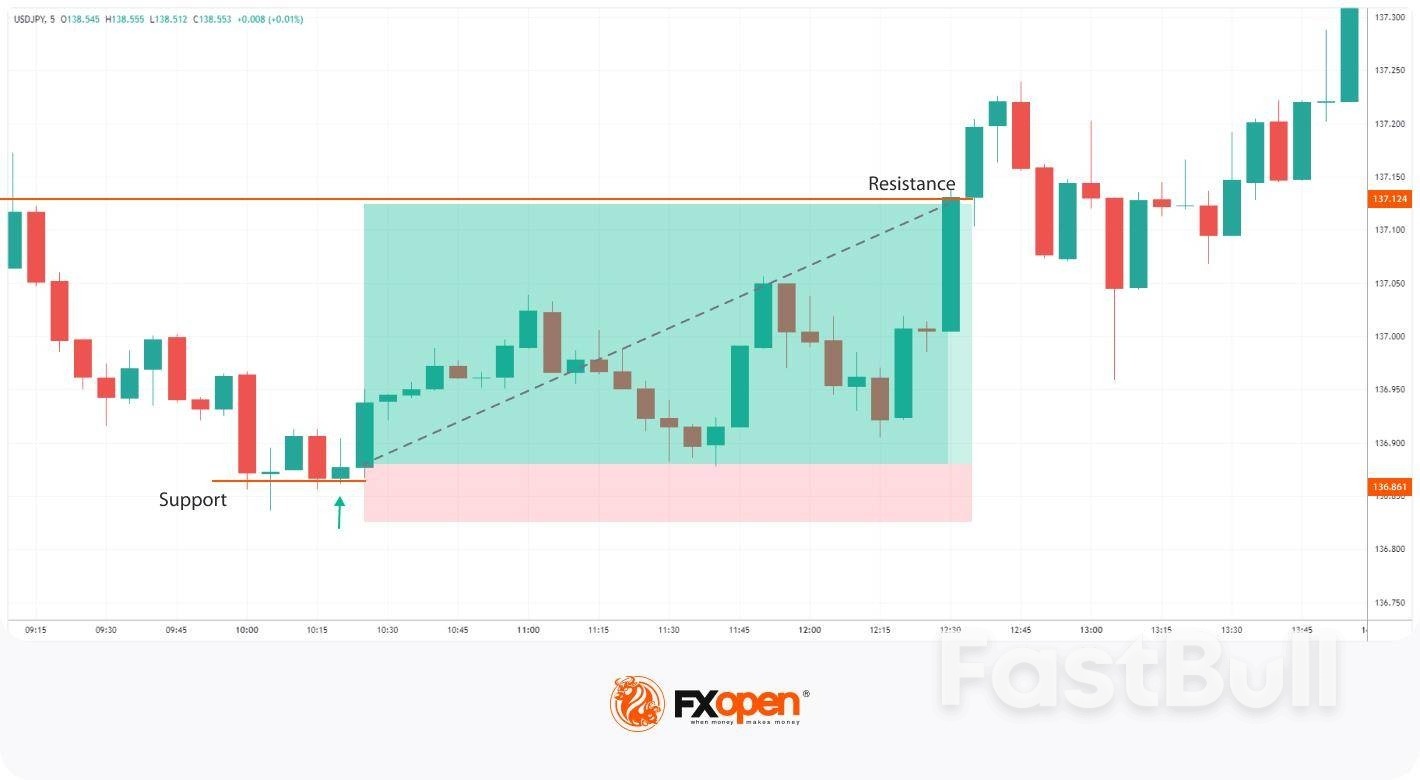
The trader looks for a bullish inverted hammer on the USDJPY chart. After a subsequent downtrend, the inverted hammer provides a buying opportunity that aligns with the support level. They enter the market at the close of the inverted hammer candle and place a stop loss below the support level. Their take-profit target is at the next resistance level.A trader could implement a more conservative approach and wait for at least a few candles to form in the uptrend direction. However, as the pattern was formed at the 5-minute chart, a trader could lose a trading opportunity or enter the market with a poor risk-reward ratio.
The inverted hammer has its strengths and limitations. Here’s a closer look:
Advantages
Limitations
While the inverted hammer can provide valuable insights into potential trend reversals, it should not be the sole basis for trading decisions. It is important to supplement analysis with other technical indicators and tools to strengthen the overall trading strategy. Furthermore, effective risk management strategies are crucial while trading the setup. Setting appropriate stop-loss orders to limit potential losses and implementing proper position sizing techniques can help potentially mitigate risks and protect trading capital.
FAQ
Is an Inverted Hammer Bullish?
Yes, it is considered a bullish reversal pattern. It indicates a potential shift from a downtrend to an uptrend in the market. While it may seem counterintuitive due to its name, the setup suggests that buying pressure has overcome selling pressure and that bulls are gaining strength.
How Do You Trade an Inverted Hammer?
To trade an inverted hammer, traders wait for confirmation in the next session, such as a gap-up or strong bullish candle. They usually enter a buy position with a stop-loss below the low of the pattern to potentially manage risk and a take-profit level at the closest resistance level.
Is the Inverted Hammer a Trend Reversal Signal?
It is generally considered a potential trend reversal signal. An inverted hammer in a downtrend suggests a shift in market sentiment from bearish to bullish. An inverted hammer in an uptrend does not signify anything.
What Happens After a Reverse Hammer Candlestick?
After a reverse (or inverted) hammer candle, there may be a potential bullish reversal if confirmed by a strong bullish candle in the next session. However, without confirmation, the pattern alone does not guarantee a trend change.
How Do You Trade an Inverted Hammer Candlestick in an Uptrend?
In an uptrend, an inverted hammer isn’t generally considered significant because it’s primarily a reversal signal in a downtrend.
Are Inverted Hammer and Shooting Star the Same?
No, the inverted hammer and shooting star look similar but occur in opposite trends; the former appears in a downtrend as a bullish reversal signal, while the latter appears in an uptrend as a bearish reversal signal.
What Is the Difference Between a Hanging Man and an Inverted Hammer?
The hanging man and inverted hammer differ in both appearance and context. The former appears at the end of an uptrend as a bearish signal and has a small body and a long lower shadow, while the latter appears at the end of a downtrend as a bullish signal and has a small body and a long upper shadow.
What Is the Difference Between a Red and Green Inverted Hammer?
A green (bullish) inverted hammer candlestick closes higher than its opening price, indicating a stronger bullish sentiment. A red (bearish) inverted hammer candlestick closes lower than its opening, which might indicate less buying strength, but both colours can signal a reversal if followed by confirmation.
728 RM B 7/F GEE LOK IND BLDG NO 34 HUNG TO RD KWUN TONG KLN HONG KONG


The risk of loss in trading financial instruments such as stocks, FX, commodities, futures, bonds, ETFs and crypto can be substantial. You may sustain a total loss of the funds that you deposit with your broker. Therefore, you should carefully consider whether such trading is suitable for you in light of your circumstances and financial resources.
No decision to invest should be made without thoroughly conducting due diligence by yourself or consulting with your financial advisors. Our web content might not suit you since we don't know your financial conditions and investment needs. Our financial information might have latency or contain inaccuracy, so you should be fully responsible for any of your trading and investment decisions. The company will not be responsible for your capital loss.
Without getting permission from the website, you are not allowed to copy the website's graphics, texts, or trademarks. Intellectual property rights in the content or data incorporated into this website belong to its providers and exchange merchants.
Not Logged In
Log in to access more features


Log In
Sign Up


