• Trade
  • Markets
  • Copy
  • Contests
  • News
  • 24/7
  • Calendar
  • Q&A
  • Chats
Trending
Screeners
SYMBOL
LAST
BID
ASK
HIGH
LOW
NET CHG.
%CHG.
SPREAD
SPX
S&P 500 Index
6857.13
6857.13
6857.13
6865.94
6827.13
+7.41
+ 0.11%
--
DJI
Dow Jones Industrial Average
47850.93
47850.93
47850.93
48049.72
47692.96
-31.96
-0.07%
--
IXIC
NASDAQ Composite Index
23505.13
23505.13
23505.13
23528.53
23372.33
+51.04
+ 0.22%
--
USDX
US Dollar Index
98.890
98.970
98.890
98.980
98.890
-0.090
-0.09%
--
EURUSD
Euro / US Dollar
1.16537
1.16544
1.16537
1.16555
1.16408
+0.00092
+ 0.08%
--
GBPUSD
Pound Sterling / US Dollar
1.33392
1.33403
1.33392
1.33396
1.33165
+0.00121
+ 0.09%
--
XAUUSD
Gold / US Dollar
4217.43
4217.82
4217.43
4218.25
4194.54
+10.26
+ 0.24%
--
WTI
Light Sweet Crude Oil
59.282
59.319
59.282
59.469
59.187
-0.101
-0.17%
--

Community Accounts

Signal Accounts
--
Profit Accounts
--
Loss Accounts
--
View More

Become a signal provider

Sell trading signals to earn additional income

View More

Guide to Copy Trading

Get started with ease and confidence

View More

Signal Accounts for Members

All Signal Accounts

Best Return
  • Best Return
  • Best P/L
  • Best MDD
Past 1W
  • Past 1W
  • Past 1M
  • Past 1Y

All Contests

  • All
  • Trump Updates
  • Recommend
  • Stocks
  • Cryptocurrencies
  • Central Banks
  • Featured News
Top News Only
Share

India's NIFTY IT Index Last Up 1.3%

Share

India's Nifty 50 Index Rises 0.35%

Share

Israel Sets 2026 Defence Budget At $34 Billion

Share

Russia Says Azov Sea's Port Of Temryuk Damaged In Ukrainian Attack

Share

Israel's Defense Budget For 2026 Will Be 112 Billion Israeli Shekels - Defense Minister Office

Share

One India Rate Panel Member Ram Singh Was Of View That Stance Should Be Changed To 'Accommodative' From 'Neutral' - Monetary Policy Committee Statement

Share

Reserve Bank Of India Chief: Will Continue To Meet Productive Needs Of Economy In Proactive Manner

Share

Reserve Bank Of India Chief: System Level Financial Parameters Of Nbfcs Sound

Share

Reserve Bank Of India Chief: Dollar Rupee Swap To Be For 3 Years, To Be Conducted This Month

Share

India's Nifty Realty Index Extend Gains, Last Up 1.4%

Share

India's Nifty Psu Bank Index Rises 1%

Share

Reserve Bank Of India Chief: Commited To Providing Sufficient Durable Liquidity

Share

Reserve Bank Of India Chief: Transmission Has Been Broad Based Across Sectors, Satisfactory

Share

Reserve Bank Of India Chief: As Of Nov 28, India's Forex Reserves Stood At $686 Billion

Share

Reserve Bank Of India Chief: Healthy Services Exports With Strong Remittances To Keep Cad Modest In This Year

Share

Reserve Bank Of India Chief: CPI Inflation Seen At 0.6% In Q3 Fy26

Share

Reserve Bank Of India Chief: Fy26 CPI Inflation Seen At 2% Versus 2.6% Previously

Share

India's Nifty Realty Index Up 1% After Reserve Bank Of India's Rate Cut

Share

India's Nifty Psu Bank Index Turns Positive, Up 0.43% After Reserve Bank Of India's Rate Cut

Share

Reserve Bank Of India Chief: Merchandise Exports Face Some Headwinds

TIME
ACT
FCST
PREV
Turkey Trade Balance

A:--

F: --

P: --

Germany Construction PMI (SA) (Nov)

A:--

F: --

P: --

Euro Zone IHS Markit Construction PMI (Nov)

A:--

F: --

P: --

Italy IHS Markit Construction PMI (Nov)

A:--

F: --

P: --

U.K. Markit/CIPS Construction PMI (Nov)

A:--

F: --

P: --

France 10-Year OAT Auction Avg. Yield

A:--

F: --

P: --

Euro Zone Retail Sales MoM (Oct)

A:--

F: --

P: --

Euro Zone Retail Sales YoY (Oct)

A:--

F: --

P: --

Brazil GDP YoY (Q3)

A:--

F: --

P: --

U.S. Challenger Job Cuts (Nov)

A:--

F: --

P: --

U.S. Challenger Job Cuts MoM (Nov)

A:--

F: --

P: --

U.S. Challenger Job Cuts YoY (Nov)

A:--

F: --

P: --

U.S. Initial Jobless Claims 4-Week Avg. (SA)

A:--

F: --

P: --

U.S. Weekly Initial Jobless Claims (SA)

A:--

F: --

P: --

U.S. Weekly Continued Jobless Claims (SA)

A:--

F: --

P: --

Canada Ivey PMI (SA) (Nov)

A:--

F: --

P: --

Canada Ivey PMI (Not SA) (Nov)

A:--

F: --

P: --

U.S. Non-Defense Capital Durable Goods Orders Revised MoM (Excl. Aircraft) (SA) (Sept)

A:--

F: --

P: --
U.S. Factory Orders MoM (Excl. Transport) (Sept)

A:--

F: --

P: --

U.S. Factory Orders MoM (Sept)

A:--

F: --

P: --

U.S. Factory Orders MoM (Excl. Defense) (Sept)

A:--

F: --

P: --

U.S. EIA Weekly Natural Gas Stocks Change

A:--

F: --

P: --

Saudi Arabia Crude Oil Production

A:--

F: --

P: --

U.S. Weekly Treasuries Held by Foreign Central Banks

A:--

F: --

P: --

Japan Foreign Exchange Reserves (Nov)

A:--

F: --

P: --

India Repo Rate

A:--

F: --

P: --

India Benchmark Interest Rate

A:--

F: --

P: --

India Reverse Repo Rate

A:--

F: --

P: --

India Cash Reserve Ratio

A:--

F: --

P: --

Japan Leading Indicators Prelim (Oct)

A:--

F: --

P: --

U.K. Halifax House Price Index YoY (SA) (Nov)

--

F: --

P: --

U.K. Halifax House Price Index MoM (SA) (Nov)

--

F: --

P: --

France Current Account (Not SA) (Oct)

--

F: --

P: --

France Trade Balance (SA) (Oct)

--

F: --

P: --

France Industrial Output MoM (SA) (Oct)

--

F: --

P: --

Italy Retail Sales MoM (SA) (Oct)

--

F: --

P: --

Euro Zone Employment YoY (SA) (Q3)

--

F: --

P: --

Euro Zone GDP Final YoY (Q3)

--

F: --

P: --

Euro Zone GDP Final QoQ (Q3)

--

F: --

P: --

Euro Zone Employment Final QoQ (SA) (Q3)

--

F: --

P: --

Euro Zone Employment Final (SA) (Q3)

--

F: --

P: --
Brazil PPI MoM (Oct)

--

F: --

P: --

Mexico Consumer Confidence Index (Nov)

--

F: --

P: --

Canada Unemployment Rate (SA) (Nov)

--

F: --

P: --

Canada Labor Force Participation Rate (SA) (Nov)

--

F: --

P: --

Canada Employment (SA) (Nov)

--

F: --

P: --

Canada Part-Time Employment (SA) (Nov)

--

F: --

P: --

Canada Full-time Employment (SA) (Nov)

--

F: --

P: --

U.S. Dallas Fed PCE Price Index YoY (Sept)

--

F: --

P: --

U.S. PCE Price Index YoY (SA) (Sept)

--

F: --

P: --

U.S. PCE Price Index MoM (Sept)

--

F: --

P: --

U.S. Personal Outlays MoM (SA) (Sept)

--

F: --

P: --

U.S. Core PCE Price Index MoM (Sept)

--

F: --

P: --

U.S. UMich 5-Year-Ahead Inflation Expectations Prelim YoY (Dec)

--

F: --

P: --

U.S. Core PCE Price Index YoY (Sept)

--

F: --

P: --

U.S. 5-10 Year-Ahead Inflation Expectations (Dec)

--

F: --

P: --

U.S. UMich Current Economic Conditions Index Prelim (Dec)

--

F: --

P: --

U.S. UMich Consumer Sentiment Index Prelim (Dec)

--

F: --

P: --

U.S. UMich 1-Year-Ahead Inflation Expectations Prelim (Dec)

--

F: --

P: --

U.S. UMich Consumer Expectations Index Prelim (Dec)

--

F: --

P: --

Q&A with Experts
    • All
    • Chatrooms
    • Groups
    • Friends
    Connecting
    .
    .
    .
    Type here...
    Add Symbol or Code

      No matching data

      All
      Trump Updates
      Recommend
      Stocks
      Cryptocurrencies
      Central Banks
      Featured News
      • All
      • Russia-Ukraine Conflict
      • Middle East Flashpoint
      • All
      • Russia-Ukraine Conflict
      • Middle East Flashpoint

      Search
      Products

      Charts Free Forever

      Chats Q&A with Experts
      Screeners Economic Calendar Data Tools
      Membership Features
      Data Warehouse Market Trends Institutional Data Policy Rates Macro

      Market Trends

      Market Sentiment Order Book Forex Correlations

      Top Indicators

      Charts Free Forever
      Markets

      News

      News Analysis 24/7 Columns Education
      From Institutions From Analysts
      Topics Columnists

      Latest Views

      Latest Views

      Trending Topics

      Top Columnists

      Latest Update

      Signals

      Copy Rankings Latest Signals Become a signal provider AI Rating
      Contests
      Brokers

      Overview Brokers Assessment Rankings Regulators News Claims
      Broker listing Forex Brokers Comparison Tool Live Spread Comparison Scam
      Q&A Complaint Scam Alert Videos Tips to Detect Scam
      More

      Business
      Events
      Careers About Us Advertising Help Center

      White Label

      Data API

      Web Plug-ins

      Affiliate Program

      Awards Institution Evaluation IB Seminar Salon Event Exhibition
      Vietnam Thailand Singapore Dubai
      Fans Party Investment Sharing Session
      FastBull Summit BrokersView Expo
      Recent Searches
        Top Searches
          Markets
          News
          Analysis
          User
          24/7
          Economic Calendar
          Education
          Data
          • Names
          • Latest
          • Prev

          View All

          No data

          Scan to Download

          Faster Charts, Chat Faster!

          Download App
          English
          • English
          • Español
          • العربية
          • Bahasa Indonesia
          • Bahasa Melayu
          • Tiếng Việt
          • ภาษาไทย
          • Français
          • Italiano
          • Türkçe
          • Русский язык
          • 简中
          • 繁中
          Open Account
          Search
          Products
          Charts Free Forever
          Markets
          News
          Signals

          Copy Rankings Latest Signals Become a signal provider AI Rating
          Contests
          Brokers

          Overview Brokers Assessment Rankings Regulators News Claims
          Broker listing Forex Brokers Comparison Tool Live Spread Comparison Scam
          Q&A Complaint Scam Alert Videos Tips to Detect Scam
          More

          Business
          Events
          Careers About Us Advertising Help Center

          White Label

          Data API

          Web Plug-ins

          Affiliate Program

          Awards Institution Evaluation IB Seminar Salon Event Exhibition
          Vietnam Thailand Singapore Dubai
          Fans Party Investment Sharing Session
          FastBull Summit BrokersView Expo

          AI Season Two: Clash Of The Giants

          Swissquote

          Stocks

          Economic

          Summary:

          There is some decent drama unfolding among the Big Tech bros this week — and Google and Nvidia are right in the middle of it.

          There is some decent drama unfolding among the Big Tech bros this week — and Google and Nvidia are right in the middle of it. The former victim in the AI race, Google, which only months ago looked like it could be eaten alive by OpenAI's next-gen AI chatbot, is suddenly storming back and, in a twist, pushing Nvidia dangerously close to the cliff as it takes the lead in a way few saw coming.

          To put things rapidly into context: the past two years haven't been rosy for Google. Gemini took time to lift off, hallucinated and became a punchline in its early days. The model quietly improved its way through end users until Gemini 3 hit hard last week. Google eventually got its AI model right and moved aggressively into 3D reasoning, agentic coding and "vibe coding" — the kinds of end-products that could mint billions in revenue.

          But that's not where the story ends.

          It's where it begins.

          As AI chatbots seep into everyday life, demand for inference is exploding. Inference is when AI takes your request and figures out an answer. And with it, the cost of inference — the cost of running a trained model every time someone queries it — is exploding too. For OpenAI, that bill for 2024 is projected to hit around $2.3 billion, roughly 15× its training costs.

          And here comes the plot twist: Meta and OpenAI are reportedly moving toward Google's TPUs — Google's homegrown chips — to run their own models because they are cheaper to operate while offering comparable performance. Both Meta and OpenAI are said to be seeking up to 4× better performance-per-dollar on inference workloads.

          And inference is the next big thing because it never stops: every time you chat with a bot, the cost accumulates. Inference costs are projected to make up almost three-quarters of total AI computing costs by 2030.

          So the world's biggest AI players could be shifting toward Google's TPUs — cheaper, more tailored to AI workloads — and potentially replacing Nvidia.Read that again.

          That's a real risk for Nvidia, whose client base is nearly half made up of these same Big Tech giants. This is why — on top of the accounting drama that hit the company last week — the stock shed another 2.60% yesterday, while Google rallied to a fresh ATH.

          In the meantime, Meta boosted its ad revenue thanks to AI, but its long-term business model is unclear. Meta is spending billions to transform its social media platforms into AI-content platform — a direction that risks disengaging users. Its Llama model is rarely mentioned in enterprise-grade discussions, and its oversized compute spending could backfire. Unlike Google, which can simply rent excess compute through its existing cloud offering, Meta must actually build that business from scratch.

          Outside the US, Alibaba's AI efforts may be paying off. The company announced a stronger-than-expected 34% growth in its cloud business, that helped counterweigh their spending on consumer subsidies and AI investments. But the numbers couldn't bring investors on board. The share price is struggling to a reverse October – November softness.

          In summary, Nvidia is being broadly questioned, Meta may be hitting its potential, while Amazon is the one Big Tech name that could benefit meaningfully from robotics when the time is right.

          But right now, Google suddenly seems to have it all: the data, the data centres, the chips, the AI model and the interface. It might well be the next $5 trillion beast. And if you think about it, Alibaba also has many of these assets. It's got the data, the data centres, its own chips, its AI model, its e-commerce empire, and incredible reach within China and beyond. So if you believe the future is "everything under one roof," Alibaba is – has always been – a strong candidate.

          What about Nvidia? Nvidia has been struggling since its latest earnings blew up in its hands as investors focused on swelling inventories and deferred payments. The company has been compared to Enron, booed because of the Google-TPU news, and are now defending themselves by saying "we're not Enron" and "we are happy for Google." Their main argument is that Google's TPUs are designed for one specific function, whereas Nvidia's GPUs are compatible with every AI model. But will that matter if companies simply want chips that do the job cheaply and efficiently?

          So, the moment has come ladies and gentlemen: competition for Nvidia is arriving from an unexpected direction. That could eat into its revenue potential and market share. Everyone is waiting to see how Nvidia will respond — by expanding customers beyond Big Tech, rolling out more inference-friendly GPUs, or pushing deeper into cost-competitive partnerships. We'll soon find out.

          Meanwhile, US consumer sentiment is waning. More than half of the strong US GDP this year came from massive AI investment. Yesterday's retail sales and PPI came in soft — softer than expected — although major retailers upgraded their annual forecasts and said the holiday season should look fine.

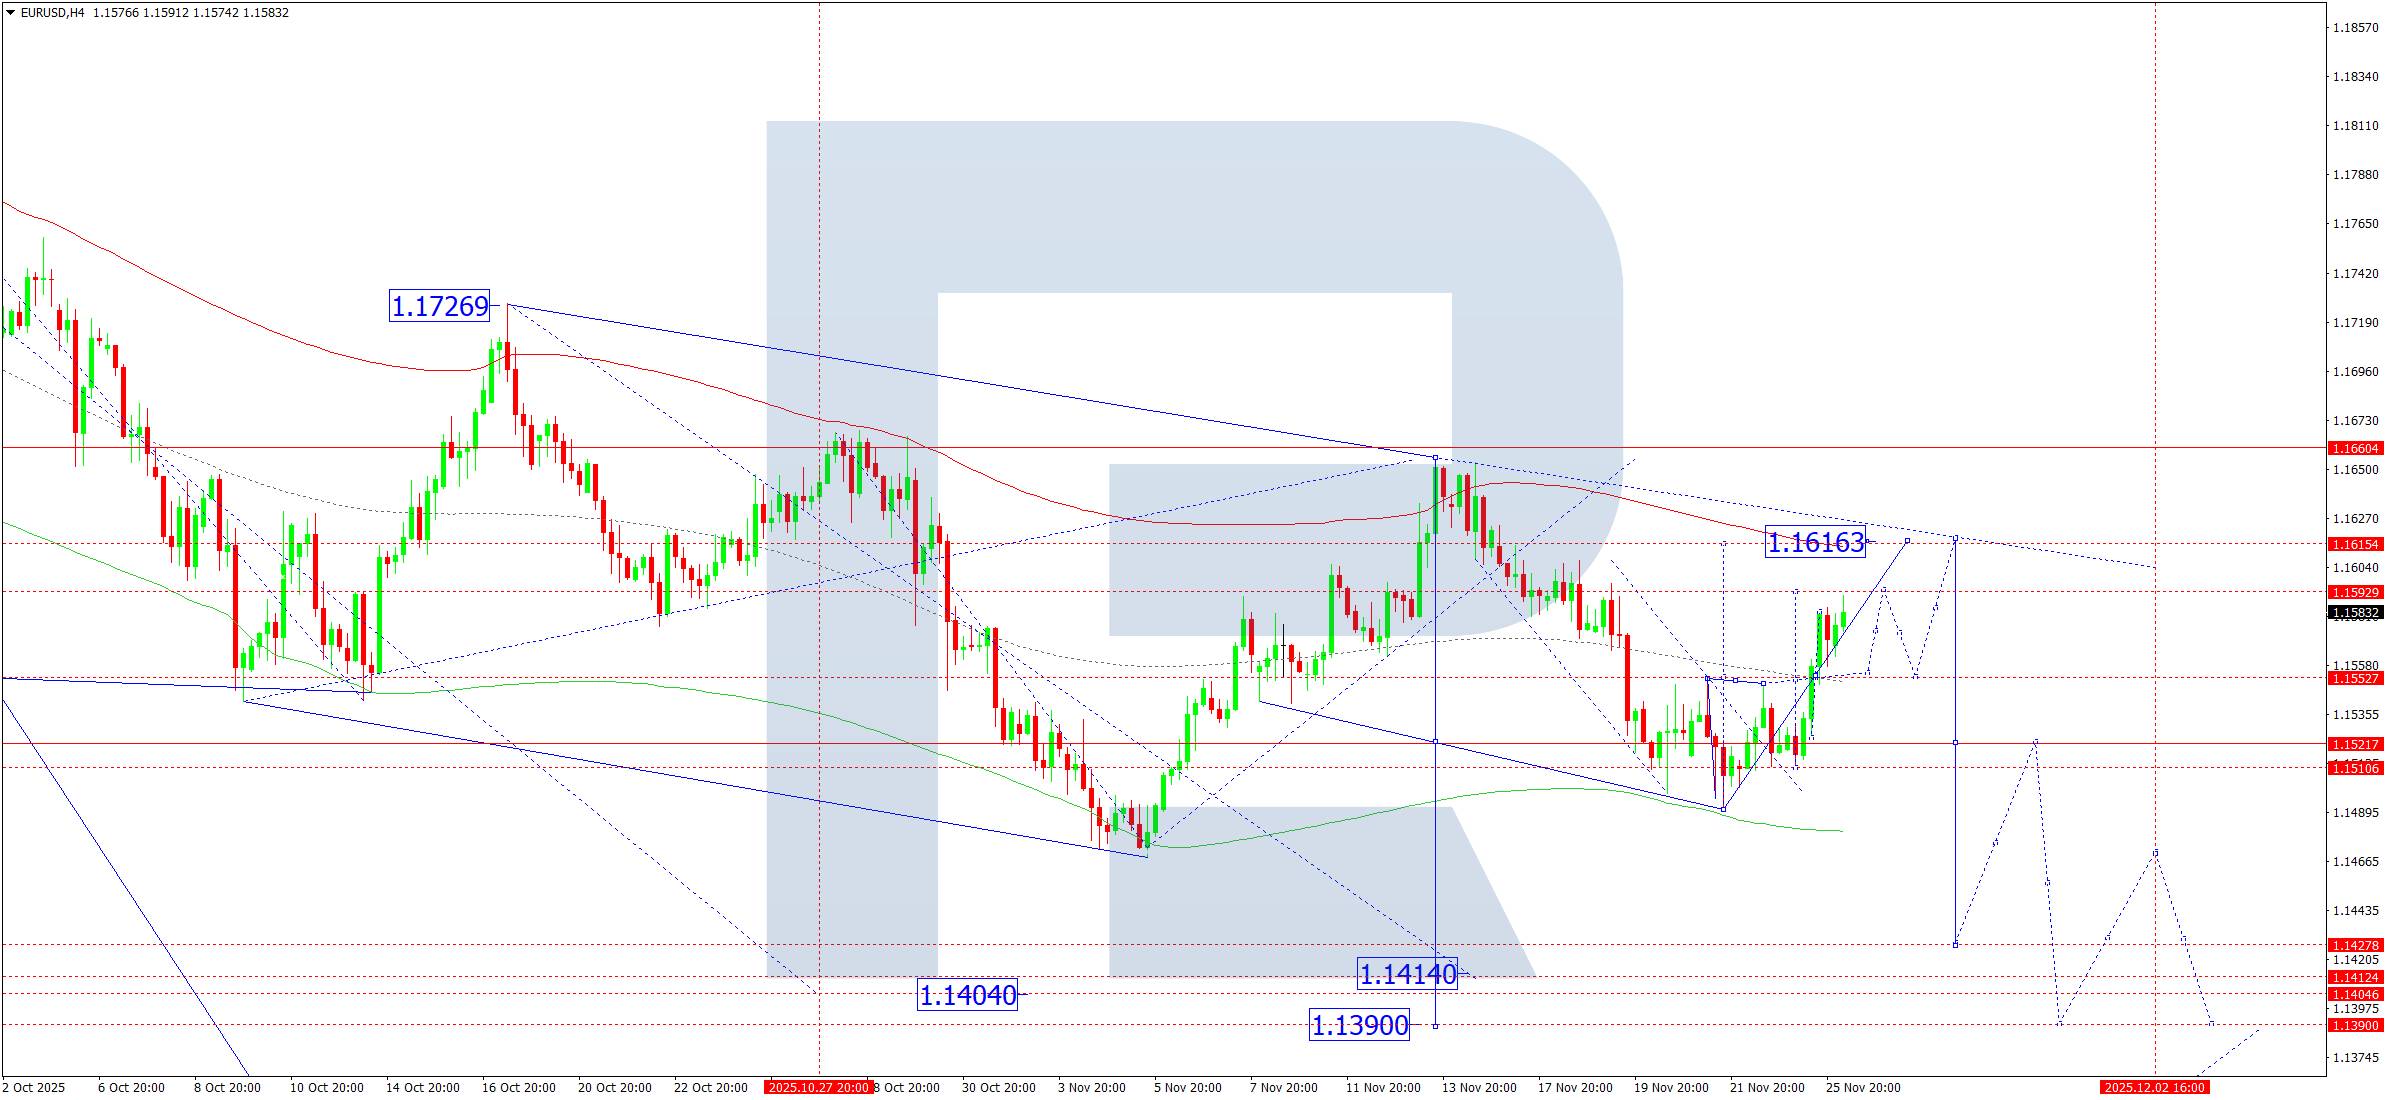
          And if not, the Fed will be there to save the day. The probability of a 25bp cut rose to around 85% after the latest data. The US dollar slipped below its 200-DMA, helping the EURUSD break above the September–November bearish consolidation trend.

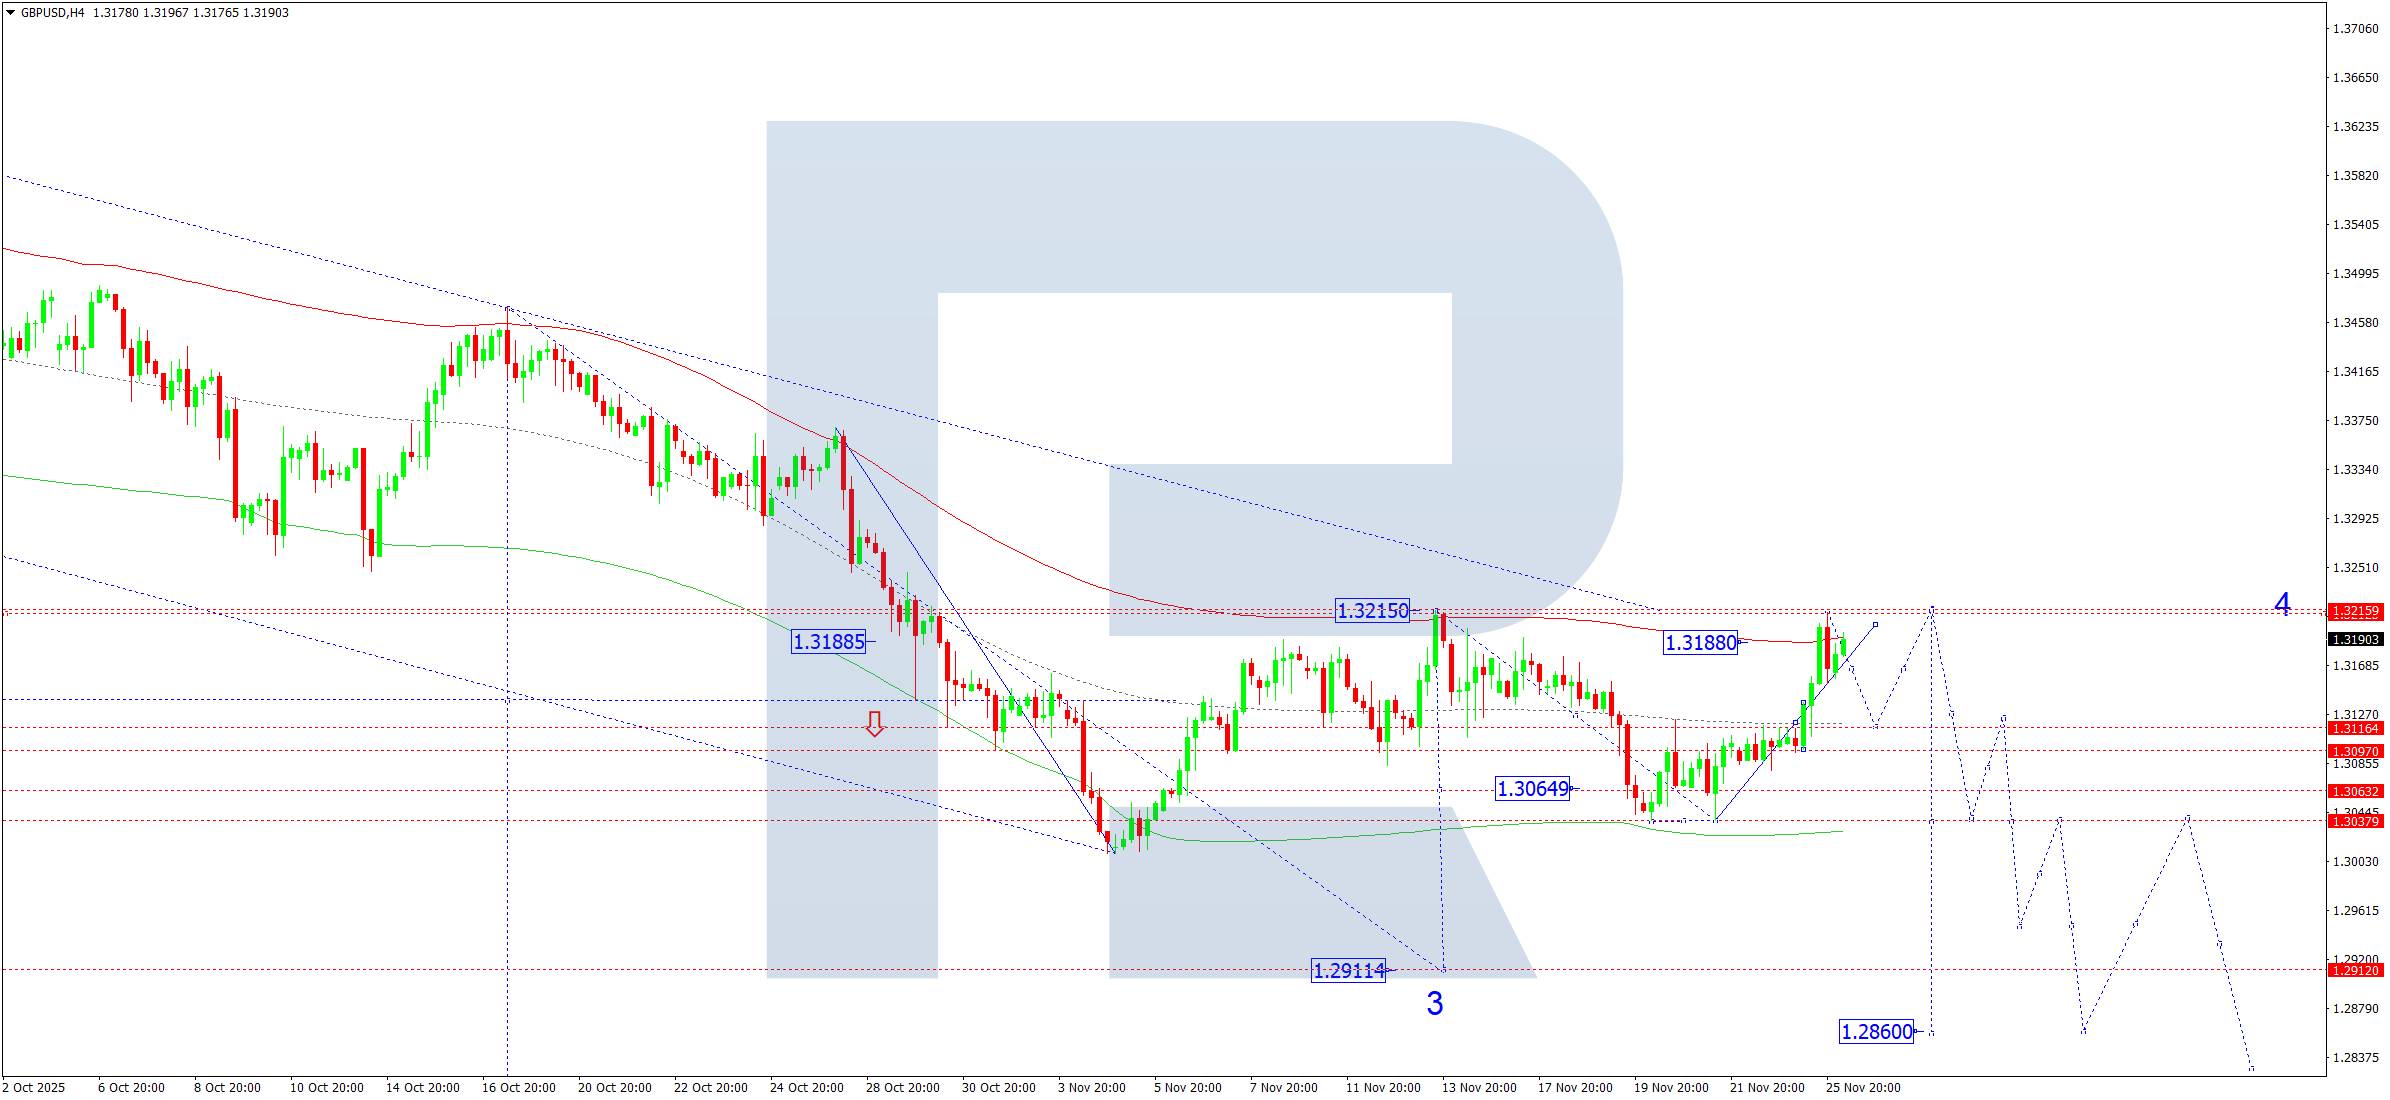
          Cable also extended gains into today's Budget announcement— an announcement that might bite. There have been plenty of leaks about where Rachel Reeves will squeeze out £30bn to get the numbers right and keep both markets and households happy. Ultimately, no one will be fully satisfied.

          The good news is that stress in gilt markets has been contained over the past few days. The bad news is that yields are near the levels reached during the Liz Truss mini-budget crisis three years ago, and Reeves has the smallest fiscal headroom on record — giving her zero margin for error. After today's Budget, we'll have a clearer view on whether the measures will be enough to keep gilt markets tidy and whether they are deflationary enough to convince the Bank of England to cut rates in December — which I think they will be. If so, current levels look appetizing for GBP sellers.

          Source: Swissquote Bank SA

          To stay updated on all economic events of today, please check out our Economic calendar
          Risk Warnings and Disclaimers
          You understand and acknowledge that there is a high degree of risk involved in trading. Following any strategies or investment methods may lead to potential losses. The content on the site is provided by our contributors and analysts for information purposes only. You are solely responsible for determining whether any trading assets, securities, strategy, or any other product is suitable for investing based on your own investment objectives and financial situation.
          Add to Favorites
          Share

          European Stocks Rise on Fed Cut Hopes as UK Budget Looms

          Gerik

          Economic

          Stocks

          Fed Sentiment Lifts Global Markets

          European equities followed the upbeat momentum from Wall Street and Asia-Pacific bourses, with optimism stoked by rising bets on an imminent U.S. rate cut. Market pricing now reflects an 85% probability that the Federal Reserve will lower rates by 0.25% at its next policy meeting on December 9–10, according to the CME FedWatch Tool.
          Supporting the dovish turn, New York Fed President John Williams hinted last week at “room to lower rates in the near term,” suggesting the Fed’s inflation fight may give way to growth support. Meanwhile, Treasury Secretary Scott Bessent added fuel to the rally by confirming that President Trump could name a new Fed Chair before Christmas. Among the contenders, Kevin Hassett current Director of the White House National Economic Council has emerged as the frontrunner. Hassett is known for his accommodative monetary stance, which has bolstered investor sentiment.

          Indices Point to a Positive Open

          According to IG data, major European indices looked poised to rise at the open:
          FTSE 100 expected +0.25%
          DAX (Germany) +0.70%
          CAC 40 (France) +0.67%
          FTSE MIB (Italy) +0.64%
          With no major corporate earnings or macroeconomic releases in Europe today, markets are riding the coattails of U.S. policy speculation and upcoming political headlines.

          UK Autumn Budget in Focus

          In the UK, investor attention is squarely on Chancellor Rachel Reeves, who will present her Autumn Budget at 12:30 p.m. London time. After weeks of speculation, the Labour-led government is expected to introduce a new set of tax increases to address a sizable fiscal shortfall while adhering to self-imposed debt and spending rules.
          Corporate leaders have urged Reeves to refrain from increasing taxes on businesses and instead focus on easing energy costs to help offset the UK’s ongoing cost-of-living crisis. However, with limited fiscal space and high inflation, Reeves faces pressure to balance social spending pledges with the need to restore fiscal credibility potentially through “stealth” tax hikes such as frozen thresholds and changes to property or capital gains regimes.
          While rate-cut optimism has brightened the global market outlook, European investor focus will quickly shift from Washington to Westminster. Whether Reeves’ fiscal measures support or stall UK growth could determine the direction of British equities in the weeks ahead. For now, easing Fed policy bets are enough to keep sentiment in positive territory.

          Source: CNBC

          To stay updated on all economic events of today, please check out our Economic calendar
          Risk Warnings and Disclaimers
          You understand and acknowledge that there is a high degree of risk involved in trading. Following any strategies or investment methods may lead to potential losses. The content on the site is provided by our contributors and analysts for information purposes only. You are solely responsible for determining whether any trading assets, securities, strategy, or any other product is suitable for investing based on your own investment objectives and financial situation.
          Add to Favorites
          Share

          Eco Numbers Put Extra Burden On Dollar

          Winkelmann

          Forex

          Political

          Economic

          Markets

          There was action on all fronts yesterday. Let's start with geopolitics. Ukrainian President Zelensky said that negotiations on a truce remained ongoing after headlines that Ukraine agreed to the US-brokered peace deal. Markets nevertheless reacted positively (equity, EUR, CE FX up; gas/oil down), embracing the progress made since high-level Geneva talks over the weekend. The past two days, the US was also involved with Russian officials in Abu Dhabi, working to a meeting between US chief negotiator Witkoff and his team and Russian President Putin in Moscow likely next week.

          The Ukraine-Russia situation was one of the topics touched on during a phone call between US President Trump and his Chinese counterpart Xi Jinping who seem back on speaking terms after extending the trade truce by a year at the end of October. Next came (US) eco data with delayed September retail sales and producer prices and up-to-date November Richmond Fed manufacturing index (-15 from -4 vs -5 expected) and consumer confidence. Data disappointed apart from in line with consensus US PPI. Headline retail sales growth slowed from a strong 0.6% M/M in August to 0.2% (vs 0.4% consensus) with all core categories weaker than expected as well.

          Despite the lower September numbers, real consumer spending was robust over Q3, expected at 3.2% annualized (vs +2.5% Q/Qa in Q2). November consumer confidence crashed from 95.5 to 88.7, the lowest outcome since the Covid-pandemic with the exception of April of this year (Liberation Day). There was an obvious setback in the present situation gauge given the US government shutdown, but the expectations comments fell even further back. The eco numbers put an extra burden on the dollar intraday while pushing US yields lower a first time.

          A third topic added to those moves: headlines that Kevin Hassett was seen as frontrunner to replace Fed Chair Powell next year. From the remaining shortlist of 5 candidates (Waller, Bowman, Warsh and Rieder), Hassett has the most dovish profile. He advocates aggressive rate cuts, prioritizing growth of inflation control.

          The bar to reverting to QE under his watch is probably lowest as he closely aligns with Trump's agenda. Hassett nevertheless stresses the importance of a fully independent central bank. US yields eventually closed around 3 bps lower across the curve with EUR/USD rising from 1.1521 to 1.1570. The short term faith of the US stock market was the final talking point. Key indices tested the October low/100d mavg recently.

          Dip buyers showed up last Friday and gained strength on Monday and also yesterday despite a negative open (-1% and more for Nasdaq). Main indices eventually ended +0.67% (Nasdaq) to 1.4% (Dow) higher. The S&P 500 tested last week's high. Taking that out would put fears to bed of a sell-on-ticks pattern being established.

          Today's eco calendar is less exciting. Keep in mind that US markets are closed tomorrow for Thanksgiving and that traded volumes are traditionally lower on (Black) Friday. Attention will shift to the UK with the long-awaited 2026 Autumn Budget. UK assets are extremely sensitive to the topic. From a risk point of view, a lot can go wrong/be considered as insufficient to address the public finances situation.

          News & Views

          The Reserve Bank of New Zealand cut its policy rate by another 25 bps to 2.25% in a 5-1 vote. (one vote for unchanged). In explaining its current and future actions/intentions, the RBNZ admits that CPI inflation has increased to the top of the 1%-3% target range in Q3, but given spare capacity in the economy it is expected to return to 2% by mid-2026. Economic activity was weak in mid-2025, but the RBNZ sees it picking up.

          Lower interest rates are supporting household spending and the labour market is stabilizing. A weaker exchange rate is supporting exporters' income. The RBNZ now sees risks to the inflation outlook as broadly balanced. In its updated forecast, the central bank now expects the policy rate at 2.2% in the first three quarters of next year. The bar for further easing looks very high. The 2-y NZ government bond yield rises by 7.5 bps this morning (2.66%). The kiwi dollar jumps sharply from the 0.5625 area to currently 0.5695.

          Australian October CPI rose from 3.6% Y/Y to 3.8% Y/Y. The largest contributor to annual inflation was housing (5.9%), followed by food and non-alcohol beverages and recreation and culture, both rising 3.2%. Underlying inflation accelerated from 3.2% Y/Y to 3.3% Y/Y. Annual services inflation was 3.9%, up from 3.5%. Inflation rising further above the 2-3% RBA target range leaves the central bank no room to cut the policy rate any further. Markets now even ponder the chances of a rate hike end 2026. The 3-y Australia government bond yield jumps 14 bps (3.88%). The Aussie dollar jumps from the AUD/USD 0.647 area to currently trade near 0.6505.

          Source: ACTIONFOREX

          To stay updated on all economic events of today, please check out our Economic calendar
          Risk Warnings and Disclaimers
          You understand and acknowledge that there is a high degree of risk involved in trading. Following any strategies or investment methods may lead to potential losses. The content on the site is provided by our contributors and analysts for information purposes only. You are solely responsible for determining whether any trading assets, securities, strategy, or any other product is suitable for investing based on your own investment objectives and financial situation.
          Add to Favorites
          Share

          China ‘firmly Opposes’ Negative Copper Treatment Charges

          Samantha Luan

          Forex

          Commodity

          China "firmly opposes" zero or negative processing fees for copper smelters and is urging the global industry to confront a "structural contradiction" that has upended the market for the industrial metal.

          Treatment and refining charges — the fees earned by smelters for processing ore into metal — have plunged to record lows this year due to a scarcity of raw materials. Rapid growth in China's smelting capacity, by far the world's largest, has collided with a series of mine outages around the world.

          A negative TC/RC effectively means that a smelter is paying to process copper concentrate — a highly unusual situation that has called into question the long-standing industry pricing benchmark. Spot charges have fallen as low as minus US$60 per tonne this year.

          "Such practices severely undermine the interests of the global copper smelting industry, including China," Chen Xuesen, vice-president of the China Nonferrous Metals Industry Association, said in a presentation to an industry conference in Shanghai on Wednesday.

          "CNIA firmly opposes any zero or negative TC/RCs in processing of copper concentrate," he said. "We urge the global copper industry to confront this unsustainable structural contradiction and foster collaboration among relevant nations and stakeholders."

          The low fees have impacted copper smelters worldwide. Japan's JX Advanced Metals Co this year announced an output cut running into the tens of thousands of tonnes, while Glencore Plc received a government bailout to keep its Mount Isa smelter and refinery in Australia running for another three years.

          Chinese smelters also suffer from low TC/RCs — but they benefit from their ownership of some mines, as well as the surging price of refined copper and sulfuric acid, a byproduct. Copper prices rose to a record high above US$11,200 in late October.

          China is taking steps to manage its copper smelting capacity, drawing on its similar experiences with aluminum, Chen said. The country has already curbed over-expansion by halting some two million tonnes of illegal capacity that was either under construction or in planning, he said.

          In the coming years, China will also favour new smelting capacity that would run on scrap rather than imported copper concentrate. "We will be able to see the effects from the copper supply-side reform in two to three years," Chen said.

          Source: Theedgemarkets

          Risk Warnings and Disclaimers
          You understand and acknowledge that there is a high degree of risk involved in trading. Following any strategies or investment methods may lead to potential losses. The content on the site is provided by our contributors and analysts for information purposes only. You are solely responsible for determining whether any trading assets, securities, strategy, or any other product is suitable for investing based on your own investment objectives and financial situation.
          Add to Favorites
          Share

          Daily Technical Analysis And Forecast For 26 November 2025

          Justin

          Forex

          Commodity

          Here is a detailed daily technical analysis and forecast for EURUSD, USDJPY, GBPUSD, AUDUSD, USDCAD, XAUUSD and Brent for 26 November 2025.

          EURUSD forecast

          On the H4 chart of EURUSD, the market found support at 1.1515 and formed an upward wave towards 1.1553. A compact consolidation range has formed around this level and, after breaking upwards, the market continues to build the third wave in the correction, with the target at 1.1593. On 26 November 2025, after the price reaches this target, the market may form a downward leg towards 1.1553 (testing from above). Afterwards, the next corrective wave towards 1.1616 becomes possible, marking the final corrective move. Once the correction ends, the downtrend will resume, with the next downside target at 1.1430 at a minimum.

          The Elliott wave structure and the downward wave matrix with a pivot point at 1.1660 confirm this scenario and remain the key elements of the EURUSD wave structure. At the moment, the market forms an upward wave towards the upper boundary of the Price Envelope at 1.1616. Today's relevant scenario includes the end of this corrective wave and the start of a decline towards its central line at 1.1553 at a minimum. A continuation towards its lower boundary at 1.1430 remains possible.

          Technical indicators for today's EURUSD forecast suggest the correction may end at 1.1616.

          USDJPY forecast

          On the H4 chart of USDJPY, the market broke below 156.36 and continues to develop a correction towards 155.55. On 26 November 2025, after reaching this target, the market may begin a rise towards 156.36 (testing from below). Afterwards, another downward wave towards 154.82 becomes possible. This movement will complete the correction. Once the correction ends, a new upward wave towards 158.47 at a minimum will become relevant.

          The Elliott wave structure and the upward wave matrix with a pivot point at 153.90 confirm this scenario and act as the key framework in this wave structure. At the moment, the market forms a corrective wave towards the lower boundary of the Price Envelope at 154.82. Afterwards, a rise towards its central line at 156.36 remains possible.

          Technical indicators for today's USDJPY forecast suggest a correction towards 154.82.

          GBPUSD forecast

          On the H4 chart of GBPUSD, the market formed a consolidation range around 1.3116 and, after breaking upwards, reached the local correction target at 1.3213. On 26 November 2025, the pair is expected to decline to 1.3116 before rising to 1.3215. This movement will complete the correction. After the correction ends, the downtrend will continue, with the next target at 1.3030 and the potential to extend the wave towards 1.2911 at a minimum.

          The Elliott wave structure and the downward wave matrix with a pivot point at 1.3188 confirm this scenario and remain the key elements in this wave structure. Today, the corrective wave could continue towards the upper boundary of the Price Envelope at 1.3215. After this wave completes, a decline towards its lower boundary at 1.3030 may begin.

          Technical indicators for today's GBPUSD forecast suggest a continued rise towards 1.3215 and the start of a downward wave towards 1.3030.

          AUDUSD forecast

          On the H4 chart of AUDUSD, the market formed an upward wave towards 0.6500. On 26 November 2025, a downward move towards 0.6464 (testing from above) is expected. Afterwards, the market may continue the correction towards 0.6515. Once the correction completes, a new downward wave towards 0.6420 may follow, with the downtrend possibly extending towards 0.6343.

          The Elliott wave structure and the downward wave matrix in AUDUSD with a pivot point at 0.6505 confirm this scenario and form the key elements of this wave structure. At the moment, the market is undergoing a correction towards the upper boundary of the Price Envelope at 0.6515. Today's expectation includes the completion of this correction and the start of a downward wave towards its lower boundary at 0.6420.

          Technical indicators for today's AUDUSD forecast suggest a correction towards 0.6515, followed by a decline towards 0.6420.

          USDCAD forecast

          On the H4 chart of USDCAD, the market continues a correction towards 1.4066. On 26 November 2025, after this correction completes, the market may start a new upward wave towards 1.4160 as a local target.

          The Elliott wave structure and the upward wave matrix with a pivot point at 1.3939 confirm this scenario and remain the key elements for USDCAD in this wave structure. At the moment, the market is undergoing a correction towards the central line of the Price Envelope at 1.4066. After the correction completes, a new upward wave towards its upper boundary at 1.4160 becomes possible.

          Technical indicators for today's USDCAD forecast suggest a correction towards 1.4066, followed by continued upward movement towards 1.4160.

          XAUUSD forecast

          On the H4 chart of XAUUSD, the market is forming a consolidation range around 4,141. On 26 November 2025, an upward breakout from this range becomes possible with a target at 4,260. Afterwards, a correction towards 4,141 (testing from above) may form, followed by a rise towards 4,285.

          The Elliott wave structure and the upward wave matrix with a pivot point at 4,088 confirm this scenario and remain the key elements in this wave structure. At the moment, the market continues to develop the fifth upward wave towards the upper boundary of the Price Envelope at 4,260. Once this level is reached, the market may begin a correction towards its central line at 4,141.

          Technical indicators for today's XAUUSD forecast suggest a possible rise towards 4,260.

          Brent forecast

          On the H4 chart of Brent crude, the market is forming a consolidation range around 61.86. On 26 November 2025, if prices break upwards from this range, the market may continue the upward wave towards 66.00, with the potential to extend the move towards 71.71. Conversely, a downward breakout could trigger another corrective wave towards 60.90. After this correction completes, a rise towards 65.00 may follow.

          The Elliott wave structure and the upward wave matrix with a pivot point at 64.00 confirm this scenario and act as the key elements in this wave structure. At the moment, the market is consolidating within a range above the lower boundary of the Price Envelope around 61.86. If prices break downwards, the wave may stretch towards its lower boundary at 60.90. An upward breakout would open the door to an upward wave towards its upper boundary at 65.00.

          Technical indicators for today's Brent forecast suggest a rise towards 63.00 and 65.00.

          Source: RoboForex

          Risk Warnings and Disclaimers
          You understand and acknowledge that there is a high degree of risk involved in trading. Following any strategies or investment methods may lead to potential losses. The content on the site is provided by our contributors and analysts for information purposes only. You are solely responsible for determining whether any trading assets, securities, strategy, or any other product is suitable for investing based on your own investment objectives and financial situation.
          Add to Favorites
          Share

          Budget Echoes: Rachel Reeves Faces the Long Shadows of 1981, 1988, and 1997

          Gerik

          Economic

          The Weight of Political Legacy

          Budgets are rarely remembered except when they reshape economic history or create lasting damage. Rachel Reeves, delivering her second Budget as Chancellor of the Exchequer, is in a rare position. Her first, in October 2024, imposed a dramatic £25 billion tax hike on businesses via increased national insurance contributions, contributing to a spike in unemployment. Now, as she prepares to unveil her latest fiscal agenda, she risks joining a small group of finance ministers whose Budgets are etched in public memory not always for the right reasons.
          Geoffrey Howe’s 1981 Budget, a product of an economy crippled by stagflation (15% inflation, soaring debt, and mass unemployment), became a textbook case of painful but ultimately stabilizing austerity. Despite 364 economists among them future BoE governor Mervyn King condemning it as destabilizing, the Budget eventually tamed inflation and repositioned the UK for growth through the 1980s. Howe used frozen thresholds and sin taxes, measures Reeves is now revisiting. But his experience reminds us that controversial Budgets can either burn or build legacies.

          The 1988 Overheat: Lawson’s Fiscal Flameout

          Nigel Lawson’s 1988 Budget slashed income tax rates and helped inflame a housing bubble by warning of impending changes to mortgage tax relief. Paired with loose monetary policy, it directly contributed to the early-1990s recession and housing crash. The political fallout offers Reeves a cautionary tale about stoking demand in a fragile housing market, especially when interest rate paths remain uncertain.
          Gordon Brown’s 1997 Budget is remembered less for its windfall tax on utilities and more for a controversial change to pension taxation. By scrapping dividend tax credits for pension funds, Brown inadvertently weakened the UK’s defined benefit pension system, shifting retirement risk onto workers and slashing institutional holdings in UK equities from 50% to just 4% over two decades. This serves as a stark warning to Reeves: long-term structural shifts from seemingly technical reforms can have immense social and investment consequences.

          Will Reeves Rewrite or Repeat History?

          As Rachel Reeves unveils her Autumn 2025 Budget, the comparison to these historical turning points is inevitable. From potential threshold freezes and wage hikes to broader tax strategies, she treads a narrow path between politically popular short-term moves and the need for long-term fiscal sustainability. While her first Budget is still debated for its impact on businesses and jobs, the second could cement her legacy for better or worse. Few expect her to deliver a third Budget, which makes today’s choices all the more defining.
          In an era where few Budgets stick in public memory, Reeves may find herself remembered not for innovation, but for unintended consequences. The challenge is not just to craft a headline-worthy speech, but a Budget that avoids the ghosts of 1981, 1988, and 1997 while forging a future that doesn't haunt the UK economy.

          Source: CNBC

          To stay updated on all economic events of today, please check out our Economic calendar
          Risk Warnings and Disclaimers
          You understand and acknowledge that there is a high degree of risk involved in trading. Following any strategies or investment methods may lead to potential losses. The content on the site is provided by our contributors and analysts for information purposes only. You are solely responsible for determining whether any trading assets, securities, strategy, or any other product is suitable for investing based on your own investment objectives and financial situation.
          Add to Favorites
          Share

          Foreign Investors Reignite Interest in China’s AI Sector Amid U.S. Valuation Fears

          Gerik

          Economic

          China’s Affordable AI Valuations Attract Global Capital

          After years of regulatory clampdowns and tech sector volatility, China’s AI landscape is regaining investor confidence not through hype but through cost-efficiency and subdued valuations. While U.S. AI and robotics startups raised over $160 billion in 2025, China’s comparable figure was just over $10 billion. Yet this disparity is turning into an opportunity. With U.S. valuations triggering bubble concerns, China's leaner startups offer more value per dollar, coupled with strong R&D capabilities and increasing global relevance.
          Take AI2 Robotics, a Shenzhen-based unicorn that hit $1 billion valuation this year despite raising a fraction of what its U.S. peer Figure secured. Founder Eric Guo’s “do more with less” approach including training robotics models using only a tenth of Alphabet’s RT-2 parameters reflects how Chinese startups are innovating efficiently. This efficiency extends beyond tech; investors like Vincent Lu from Australia’s Boman Group highlight that Chinese AI firms operate with significantly lower R&D costs and valuations a quarter of U.S. counterparts, yet with similar technological ambition.

          Investor Confidence Rebuilds Despite Structural Risks

          Foreign investors, once deterred by Beijing’s crackdown and Washington’s scrutiny, are now cautiously returning. This month alone saw three China-focused AI funds raise U.S. dollar-denominated capital from overseas sources. Notable examples include Source Code Capital’s $600 million raise and Blue Pool Capital (linked to Alibaba’s Joe Tsai) aiming for $750 million. Monolith Capital, which invested in Moonshot AI, capped its round at $488 million despite higher investor interest signaling revived optimism.
          Johnny Zhu of Primavera Venture Partners described this as a “clear recovery” in sentiment, aided by more visible exit routes, especially via Hong Kong listings. The city’s exchange has become the world’s largest listing destination in 2025, helping foreign capital envision feasible returns. While Chinese IPOs in the U.S. remain stalled, this regional pivot is easing capital concerns.

          Valuation Gaps Underscore Diverging Market Temperament

          Despite recovering interest, Chinese public equities still reflect investor caution. The Hang Seng Index, home to AI giants like Tencent and Alibaba, trades at a price-to-earnings (P/E) ratio of 13.61 far below Nasdaq’s 33.8 even though it has surged nearly 30% this year. This gap suggests persistent skepticism over China’s regulatory landscape and geopolitical risks, but also signals upside potential for those willing to embrace long-term exposure.
          Meanwhile, U.S. market exuberance is drawing concern. Noted investor Michael Burry recently warned of a bubble in AI stocks, while figures like Warren Buffett’s rare tech bets and Alphabet’s new model have only fueled further speculation.
          Although U.S. startups dominate in scale and funding, China’s AI sector is emerging as the value play for global investors seeking innovation without sky-high valuations. The gradual thaw in investor sentiment, bolstered by efficient R&D models, accessible Hong Kong listings, and newly launched funds, signals a new chapter one where China's AI might finally command a sustainable share of global capital flows.

          Source: CNBC

          To stay updated on all economic events of today, please check out our Economic calendar
          Risk Warnings and Disclaimers
          You understand and acknowledge that there is a high degree of risk involved in trading. Following any strategies or investment methods may lead to potential losses. The content on the site is provided by our contributors and analysts for information purposes only. You are solely responsible for determining whether any trading assets, securities, strategy, or any other product is suitable for investing based on your own investment objectives and financial situation.
          Add to Favorites
          Share
          FastBull
          Copyright © 2025 FastBull Ltd

          728 RM B 7/F GEE LOK IND BLDG NO 34 HUNG TO RD KWUN TONG KLN HONG KONG

          TelegramInstagramTwitterfacebooklinkedin
          App Store Google Play Google Play
          Products
          Charts

          Chats

          Q&A with Experts
          Screeners
          Economic Calendar
          Data
          Tools
          Membership
          Features
          Function
          Markets
          Copy Trading
          Latest Signals
          Contests
          News
          Analysis
          24/7
          Columns
          Education
          Company
          Careers
          About Us
          Contact Us
          Advertising
          Help Center
          Feedback
          User Agreement
          Privacy Policy
          Business

          White Label

          Data API

          Web Plug-ins

          Poster Maker

          Affiliate Program

          Risk Disclosure

          The risk of loss in trading financial instruments such as stocks, FX, commodities, futures, bonds, ETFs and crypto can be substantial. You may sustain a total loss of the funds that you deposit with your broker. Therefore, you should carefully consider whether such trading is suitable for you in light of your circumstances and financial resources.

          No decision to invest should be made without thoroughly conducting due diligence by yourself or consulting with your financial advisors. Our web content might not suit you since we don't know your financial conditions and investment needs. Our financial information might have latency or contain inaccuracy, so you should be fully responsible for any of your trading and investment decisions. The company will not be responsible for your capital loss.

          Without getting permission from the website, you are not allowed to copy the website's graphics, texts, or trademarks. Intellectual property rights in the content or data incorporated into this website belong to its providers and exchange merchants.

          Not Logged In

          Log in to access more features

          FastBull Membership

          Not yet

          Purchase

          Become a signal provider
          Help Center
          Customer Service
          Dark Mode
          Price Up/Down Colors

          Log In

          Sign Up

          Position
          Layout
          Fullscreen
          Default to Chart
          The chart page opens by default when you visit fastbull.com