


Markets
News
Analysis
User
24/7
Economic Calendar
Education
Data
- Names
- Latest
- Prev


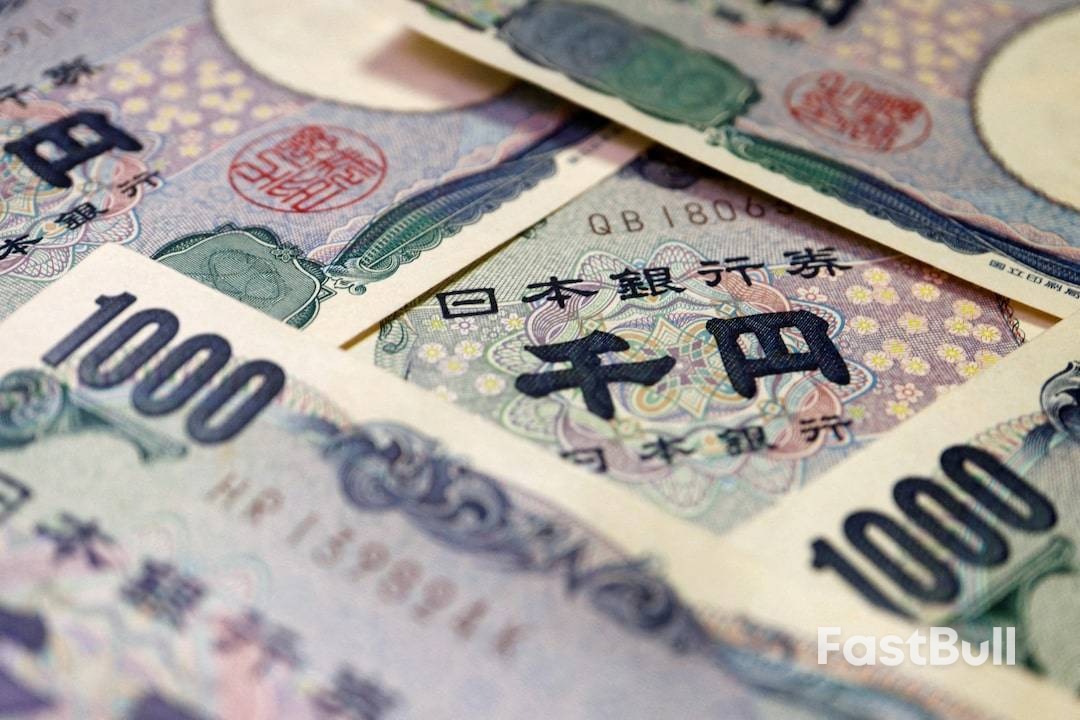
The yen stayed under pressure after the Bank of Japan held rates steady on Friday, as expected, while the U.S. dollar headed for its steepest weekly drop since June as geopolitical tensions and abrupt policy shifts around Greenland unsettled investors.
The yen stayed under pressure after the Bank of Japan held rates steady on Friday, as expected, while the U.S. dollar headed for its steepest weekly drop since June as geopolitical tensions and abrupt policy shifts around Greenland unsettled investors.
The yen was slightly weaker at 158.54 following the BOJ's rate decision and after it raised its economic and inflation forecasts, highlighting the central bank's readiness to continue hiking still-low borrowing costs.
Last month, the BOJ raised its policy interest rate to a 30-year high but that has not helped the frail yen. Traders are concerned that a break beyond 160 per dollar could prompt Tokyo to step into the currency market to support the yen.
Moh Siong Sim, FX strategist at OCBC, said the market was hoping the yen's weakness might trigger a more forceful BOJ response but the central bank maintained the same rhetoric - an outcome that was pretty neutral for markets.
"After all, yen indirectly fits into the economic projections if the weakness is sustained," he said.
The spotlight will now be on comments from Governor Kazuo Ueda to gauge when the next hike will come and whether there is any hawkish tilt to support the yen. Ueda will hold a news conference to explain the decision at 0630 GMT.
"Governor Ueda in his remarks will likely lean into a more hawkish direction, which may keep the next meetings 'live' for a further policy rate hike," said Fred Neumann, chief Asia economist at HSBC.
"The Board appears to be leaning more hawkish as well, with one dissenter at today's meeting indicating that further policy rate hikes are on the table."
The yen has been under relentless pressure since Sanae Takaichi took over as Japan's prime minister in October, dropping more than 4% on fiscal concerns and hovering near levels that have spurred verbal warnings and intervention fears.
A bond market rout this week underscored investor nerves about Japan's fiscal position as Takaichi called a snap election for February and promised tax cuts, sending Japanese government bond yields to record highs. They have recovered somewhat since then but investors remain skittish.
Carol Lye, portfolio manager at Brandywine Global, said the authorities have to come up with a more concrete plan to calm the markets. "If there's no action, then it's just words. It's not going to anchor the market down."
"And until they do, I think there's still room for the JGBs across the entire curve to continue being volatile. The rate hikes are also not coming in quickly enough."
The shifting geopolitical landscape has weighed on sentiment this week as Trump said he had secured U.S. access to Greenland in a deal with NATO that came as he backed off tariff threats against Europe and ruled out taking the autonomous territory of Denmark by force.
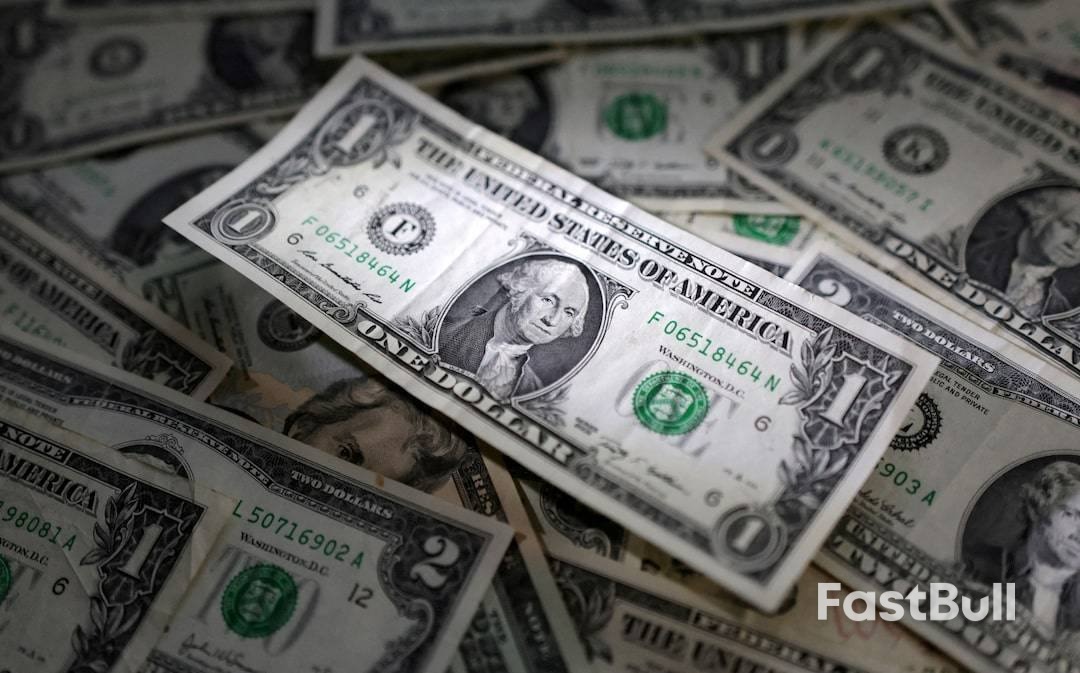
The dollar has borne the brunt of investor angst in the currency markets as U.S. assets were pummelled at the start of the week amid the intensifying geopolitical tensions.
The dollar index , which measures the U.S. currency against six units, was at 98.366 after dropping 0.58% in the previous session, on course for a 1% slide, its worst weekly performance since June 2025.
The euro was steady at $1.1746, hovering near the three-week high it touched earlier this week, while sterling fetched $1.3496, near a two-week high hit in the previous session.
The Australian dollar was steady at $0.6841, while the New Zealand dollar was 0.3% weaker at $0.59105.
Thierry Wizman, global FX & rates strategist at Macquarie Group, said while a Greenland deal solves the immediate problem of tariffs and invasion, it doesn't solve the core issue of the seeming alienation of allies from one another.
"And that's not a good place to be if you want to preserve the USD's reserve-currency status."
728 RM B 7/F GEE LOK IND BLDG NO 34 HUNG TO RD KWUN TONG KLN HONG KONG


The risk of loss in trading financial instruments such as stocks, FX, commodities, futures, bonds, ETFs and crypto can be substantial. You may sustain a total loss of the funds that you deposit with your broker. Therefore, you should carefully consider whether such trading is suitable for you in light of your circumstances and financial resources.
No decision to invest should be made without thoroughly conducting due diligence by yourself or consulting with your financial advisors. Our web content might not suit you since we don't know your financial conditions and investment needs. Our financial information might have latency or contain inaccuracy, so you should be fully responsible for any of your trading and investment decisions. The company will not be responsible for your capital loss.
Without getting permission from the website, you are not allowed to copy the website's graphics, texts, or trademarks. Intellectual property rights in the content or data incorporated into this website belong to its providers and exchange merchants.
Not Logged In
Log in to access more features


Log In
Sign Up


