


Markets
News
Analysis
User
24/7
Economic Calendar
Education
Data
- Names
- Latest
- Prev


Institutional inflows, favorable social sentiment trends, and rising Fed cut expectations strengthen XRP’s path toward $2.35 while highlighting key technical risks.

XRP hit key resistance at $2.2 on Wednesday, December 3, as spot ETF net inflows approached $1 billion. US economic indicators eased stagflation risks while boosting bets on a December Fed rate cut, setting up a perfect storm for risk assets such as XRP.
The ADP reported a 32k drop in employment in November after a 47k rise in October, supporting a more dovish Fed rate path. Meanwhile, the all-important ISM Services PMI unexpectedly rose from 52.4 in October to 52.6 in November.
Services sector activity is key to the US economy, given that it accounts for around 80% of GDP. Crucially, the Prices Index dropped from 70 to 65.4, suggesting a softer inflation outlook, abating stagflation jitters.
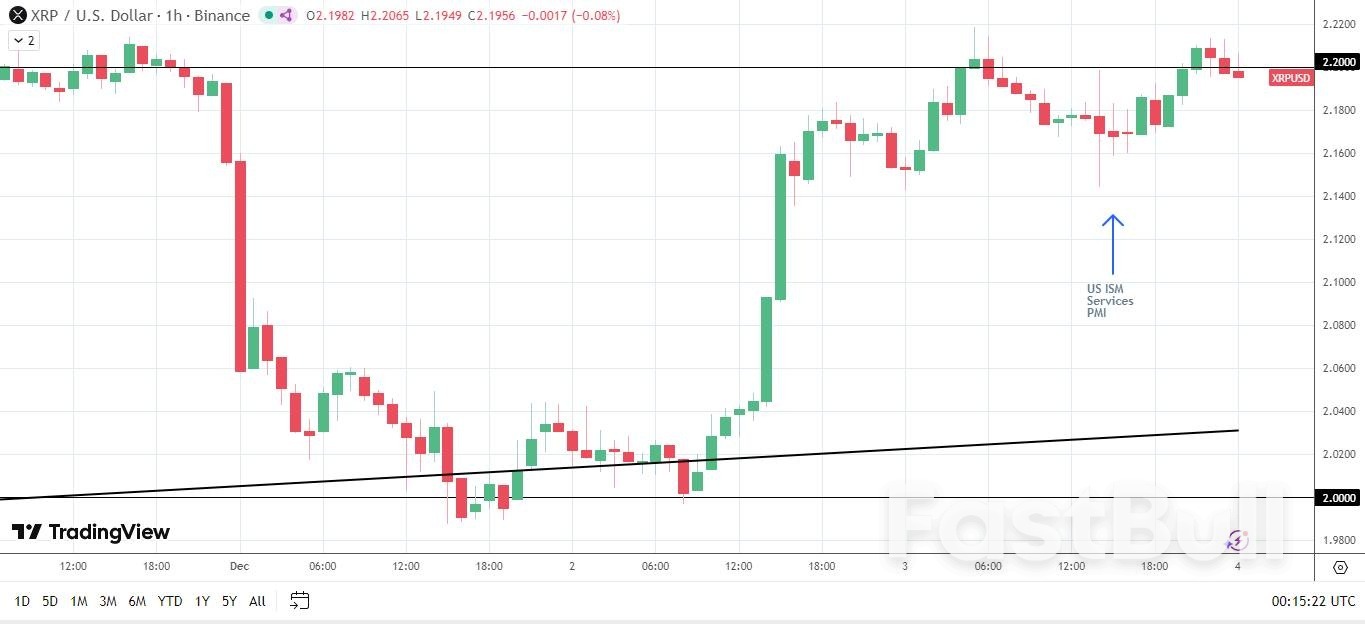 XRPUSD – Hourly Chart – 041225
Easing fears of US stagflation, rising bets on a December Fed rate cut, and robust demand for XRP-spot ETFs support a more bullish short- to medium-term outlook.
Below, I will explore the key drivers behind the breakout, the medium-term (4-8 week) outlook, and the key technical levels traders should watch.
On Tuesday, December 2, XRP-spot ETFs reported $67.74 million in net inflows, down from $89.65 million the previous session. Nevertheless, the XRP-spot ETF market extended its inflow streak to 12 consecutive sessions, underscoring robust institutional demand.
Grayscale XRP ETF (GXRP) led the way on December 2, with net inflows of $21.17 million. Meanwhile, Canary XRP ETF (XRPC) led the inflow table since launch, with net inflows of $355.21 million, benefiting from a first-to-market advantage. There is a delay in the release of spot ETF flow data, with numbers for Wednesday, December 3, expected later today.
Crucially, the resilient demand for spot ETFs tilts the supply-demand balance in XRP's favor, supporting a bullish short- to medium-term price outlook.
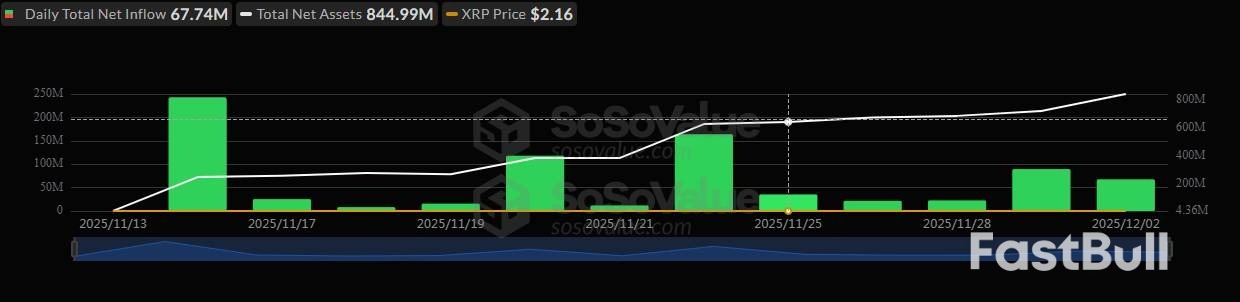 SoSoValue – XRP Price and ETF Flow Trends
For context, Bitcoin (BTC) soared 169% to an October 6, 2025, all-time high of $125,761, driven by net inflows of $63.7 billion into BTC-spot ETFs from launch through October 6. Since October 7, 2025, ETF issuers reported net outflows of $3.5 billion, leaving BTC down 26% from its all-time high. BTC-spot ETF market flow trends underscored the significance of institutional demand on price action.
Spot ETF inflows and social media indicators align with the bullish short- to medium-term price outlook.
Market Intelligence platform Santiment gave insights into current investor sentiment on crypto across social media platforms overnight, stating:
"According to social media data across X, Reddit, Telegram, 4Chan, BitcoinTalk, & Farcaster, the enormous swings from greed to fear have perfectly told the story for Bitcoin's price."
Santiment shared a chart showing BTC price trends on positive and negative sentiment ratios on social media, explaining that:
"Red circles indicate days where there are abnormally higher BULLISH comments compared to BEARISH comments, about $BTC (Greed Zone). Green circles indicate days where there are abnormally higher BEARISH comments compared to BULLISH comments, about $BTC (Fear Zone)."
Social media sentiment has proven a leading BTC price indicator, crucial for the broader market, given performance correlations with Bitcoin. Santiment described the inverse relationship between sentiment ratios and BTC price action, stating:
"Since we know markets move the opposite direction of the crowd's predictions, the days where comments dip into the Fear Zone have perfectly predicted upcoming bounces. And alternatively, the days where comments dip into the Greed Zone have perfectly predicted upcoming dips. This latest rise has made retail greedy once again, but it may calm down quickly if the rally comes to a quick halt."
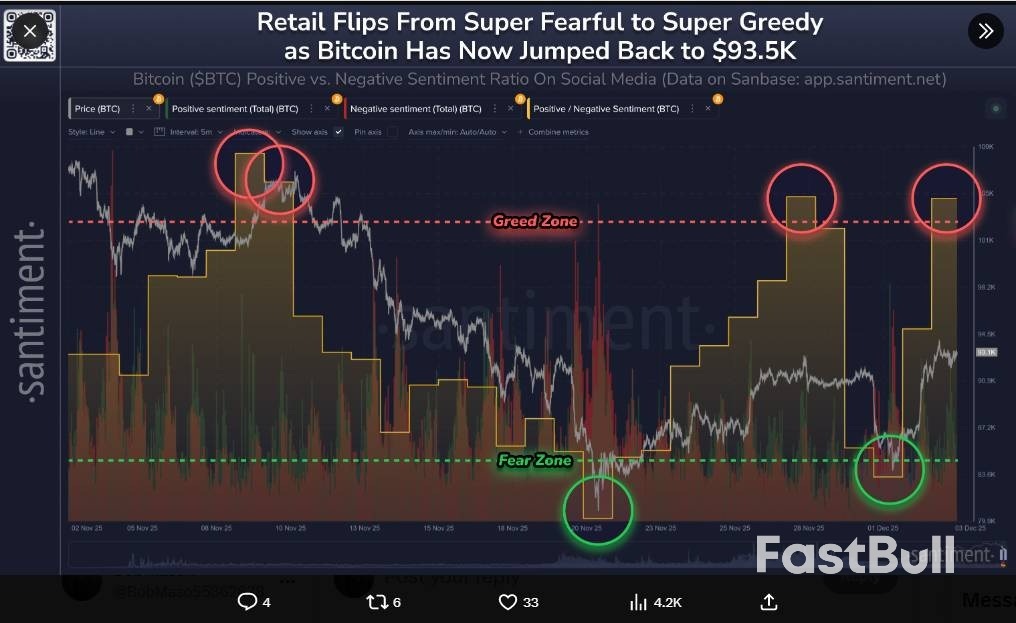 Santiment – Retail Sentiment on Social Media and BTC Price Trends
The Bitcoin Fear & Greed Index currently sits in the Fear Zone at 26, down from 28 the previous day, supporting further price gains.
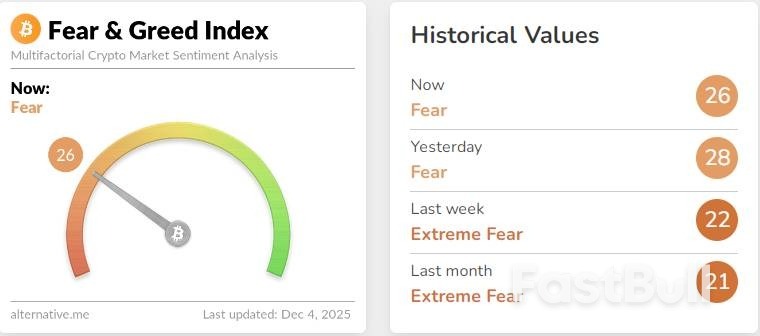 BTC Fear & Greed Index – 041225
XRP consolidated its December 2 rally on December 3, reinforcing the bullish medium-term price outlook. Several key price catalysts are likely to boost demand for XRP, including:
According to the CME FedWatch Tool, the chances of a December Fed rate cut rose from 88.0% on December 2 to 89.0% on December 3. Meanwhile, the probability of a March 2026 Fed rate cut stands at 52.9%, up from 45.6% on December 2.
In my opinion, these price catalysts support a near-term (1-4 weeks) move to $2.35 and a medium-term (4-8 weeks) climb to $3.
Despite the positive outlook, several potential events could derail a Santa Rally. These include:
These events could push XRP below $2 and expose the November low of $1.82 before a sustained move toward $3.
In summary, the short-term outlook is cautiously bullish, while the medium- to longer-term outlook is constructive.
Technical Outlook: EMAs Signal Caution
XRP gained 2.03% on Wednesday, December 3, following the previous day's 6.04% rally, closing at $2.1973. The token underperformed the broader market, which advanced 2.92%.
Despite Wednesday's gains, XRP continued to trade below the 50-day and 200-day Exponential Moving Averages (EMAs), reaffirming a bearish bias. However, fundamentals have shifted from the technical trend, supporting a bullish outlook.
Key technical levels to watch include:
Holding above the $2.2 support level would open the door to testing the 50-day EMA. A sustained move through the 50-day EMA would bring the $2.35 resistance level into play. Crucially, a breakout from the 50-day EMA would signal a near-term bullish trend reversal, supporting a move to $2.35.
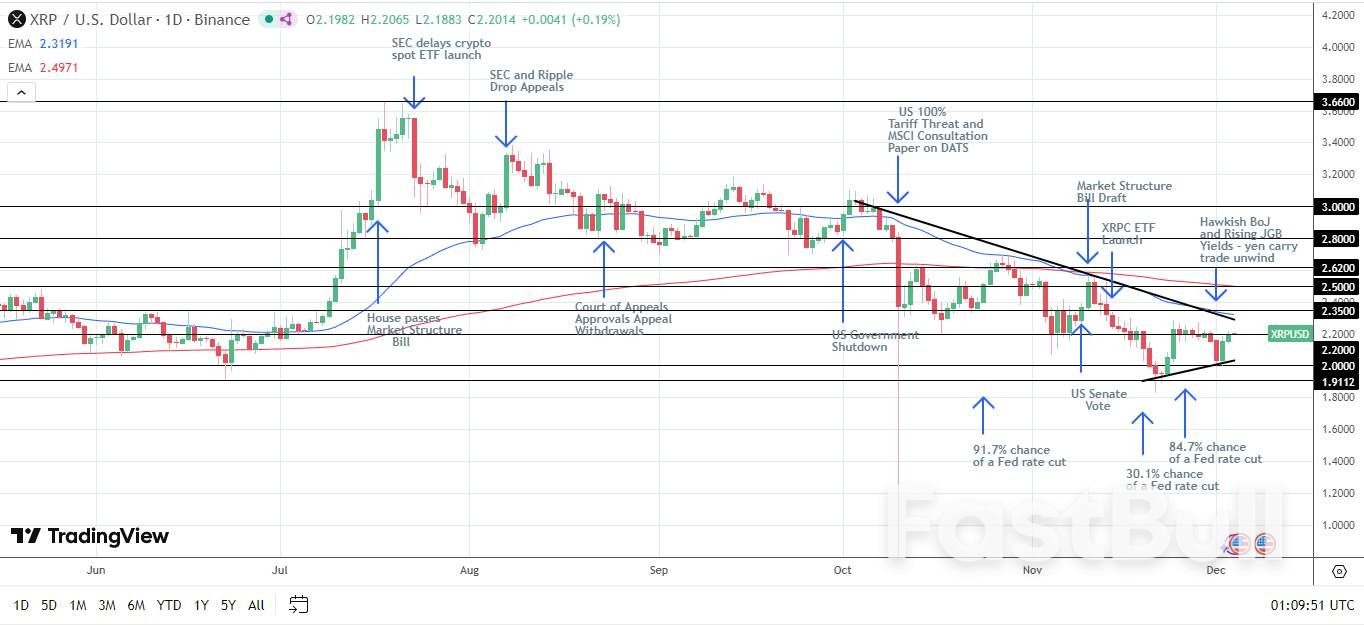 XRPUSD – Daily Chart – 041225
Near-term price drivers include:
Positive market sentiment and a hold above $2.2 would support a move to the upper trendline. Breaking resistance at the upper trendline would align with the medium-term $3 price target.
However, a move below $1.8239 would invalidate the medium-term bullish structure.
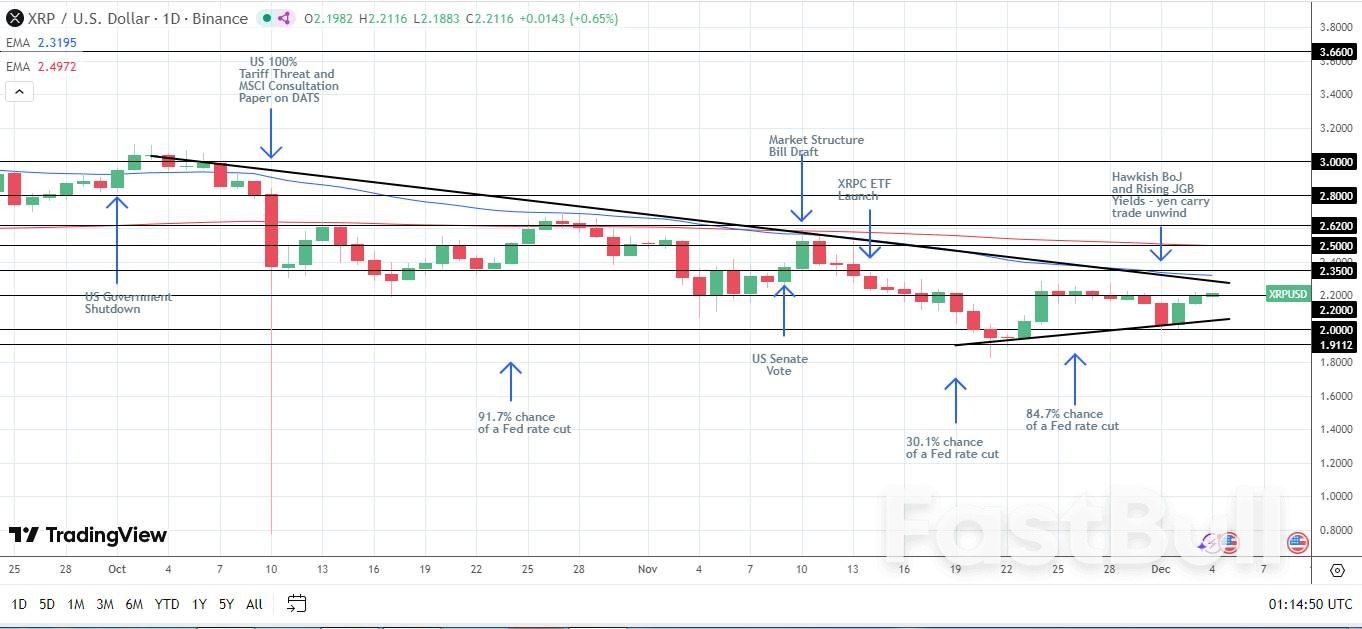 XRPUSD – Daily Chart – 041225 – Bullish
XRP will come under increased scrutiny on Thursday, December 4. Robust inflows into XRP-spot ETFs and rising bets on multiple Fed rate cuts would support the current recovery toward $2.35.
However, traders should closely monitor the progress of the Market Structure Bill, US economic indicators, the BoJ, and the Fed, which will also influence risk sentiment.
728 RM B 7/F GEE LOK IND BLDG NO 34 HUNG TO RD KWUN TONG KLN HONG KONG


The risk of loss in trading financial instruments such as stocks, FX, commodities, futures, bonds, ETFs and crypto can be substantial. You may sustain a total loss of the funds that you deposit with your broker. Therefore, you should carefully consider whether such trading is suitable for you in light of your circumstances and financial resources.
No decision to invest should be made without thoroughly conducting due diligence by yourself or consulting with your financial advisors. Our web content might not suit you since we don't know your financial conditions and investment needs. Our financial information might have latency or contain inaccuracy, so you should be fully responsible for any of your trading and investment decisions. The company will not be responsible for your capital loss.
Without getting permission from the website, you are not allowed to copy the website's graphics, texts, or trademarks. Intellectual property rights in the content or data incorporated into this website belong to its providers and exchange merchants.
Not Logged In
Log in to access more features

FastBull Membership
Not yet
Purchase


Log In
Sign Up


