• Trade
  • Markets
  • Copy
  • Contests
  • News
  • 24/7
  • Calendar
  • Q&A
  • Chats
Trending
Screeners
SYMBOL
LAST
BID
ASK
HIGH
LOW
NET CHG.
%CHG.
SPREAD
SPX
S&P 500 Index
6857.13
6857.13
6857.13
6865.94
6827.13
+7.41
+ 0.11%
--
DJI
Dow Jones Industrial Average
47850.93
47850.93
47850.93
48049.72
47692.96
-31.96
-0.07%
--
IXIC
NASDAQ Composite Index
23505.13
23505.13
23505.13
23528.53
23372.33
+51.04
+ 0.22%
--
USDX
US Dollar Index
98.760
98.840
98.760
98.980
98.750
-0.220
-0.22%
--
EURUSD
Euro / US Dollar
1.16683
1.16692
1.16683
1.16692
1.16408
+0.00238
+ 0.20%
--
GBPUSD
Pound Sterling / US Dollar
1.33590
1.33599
1.33590
1.33601
1.33165
+0.00319
+ 0.24%
--
XAUUSD
Gold / US Dollar
4225.91
4226.25
4225.91
4230.62
4194.54
+18.74
+ 0.45%
--
WTI
Light Sweet Crude Oil
59.390
59.427
59.390
59.469
59.187
+0.007
+ 0.01%
--

Community Accounts

Signal Accounts
--
Profit Accounts
--
Loss Accounts
--
View More

Become a signal provider

Sell trading signals to earn additional income

View More

Guide to Copy Trading

Get started with ease and confidence

View More

Signal Accounts for Members

All Signal Accounts

Best Return
  • Best Return
  • Best P/L
  • Best MDD
Past 1W
  • Past 1W
  • Past 1M
  • Past 1Y

All Contests

  • All
  • Trump Updates
  • Recommend
  • Stocks
  • Cryptocurrencies
  • Central Banks
  • Featured News
Top News Only
Share

Equinor: Preliminary Estimates Indicate Reservoirs May Contain Between 5 -18 Million Standard Cubic Meters Of Recoverable Oil Equivalents

Share

Japan Chief Cabinet Secretary Kihara: Government To Take Appropriate Steps On Excessive And Disorderly Moves In Foreign Exchange Market, If Necessary

Share

[Report: Amazon Pays €180 Million To Italy To End Tax And Labor Investigations] Amazon Has Paid A Settlement And Dismantled Its Monitoring System For Delivery Drivers In Italy, Ending An Investigation Into Alleged Tax Fraud And Illegal Labor Practices. In July 2024, The Group's Logistics Services Division Was Accused Of Circumventing Labor And Tax Laws By Relying On Cooperatives Or Limited Liability Companies To Supply Workers, Evading VAT, And Reducing Social Security Payments. Sources Say The Group Has Now Paid Approximately €180 Million To Italian Tax Authorities As Part Of A €1 Billion Settlement Involving 33 Companies

Share

Airbus - Booked 797 Gross Aircraft Orders In January-November

Share

[Market Update] Spot Gold Broke Through $4,230 Per Ounce, Up 0.51% On The Day

Share

Reserve Bank Of India Chief Malhotra: There Will Be Ample Liquidity As Long As We Are In An Easing Cycle

Share

Reserve Bank Of India Chief Malhotra: Quantum Of System Liquidity Will Be Managed To Ensure Monetary Transmission Is Happening

Share

China's Foreign Ministry: World Bank, IMF, WTO Top Officials To Join

Share

China's Foreign Ministry: China To Hold 1+1 Dialogue With International Economic Orgs On Dec 9

Share

Reserve Bank Of India Chief Malhotra: 5% Of Inr Depreciation Leads To 35 Bps Of Inflation

Share

Eurostoxx 50 Futures Up 0.14%, DAX Futures Up 0.12%, CAC 40 Futures Up 0.26%, FTSE Futures Up 0.03%

Share

Getlink - Over 1 Million Trucks Crossed Channel Since January 2025

Share

Malaysia International Reserves At $124.1 Billion On November 28 Versus$124.1 Billion On November 14 - Central Bank

Share

Reserve Bank Of India Chief Malhotra: Conscious Effort On Diversifying Gold Reserves

Share

Russian President Putin Thanks Indian Prime Minister Modi For Attention To Ukraine Peace Efforts

Share

Russian President Putin: India-Russia Relations Should Grow And Touch New Heights

Share

Russian President Putin: India Is Not Neutral, India Is On The Side Of Peace

Share

Russian President Putin: We Support Every Effort Towards Peace

Share

Russian President Putin: The World Should Return To Peace

Share

India Prime Minister Modi: We Should All Pursue Peace Together

TIME
ACT
FCST
PREV
Euro Zone IHS Markit Construction PMI (Nov)

A:--

F: --

P: --

Italy IHS Markit Construction PMI (Nov)

A:--

F: --

P: --

U.K. Markit/CIPS Construction PMI (Nov)

A:--

F: --

P: --

France 10-Year OAT Auction Avg. Yield

A:--

F: --

P: --

Euro Zone Retail Sales MoM (Oct)

A:--

F: --

P: --

Euro Zone Retail Sales YoY (Oct)

A:--

F: --

P: --

Brazil GDP YoY (Q3)

A:--

F: --

P: --

U.S. Challenger Job Cuts (Nov)

A:--

F: --

P: --

U.S. Challenger Job Cuts MoM (Nov)

A:--

F: --

P: --

U.S. Challenger Job Cuts YoY (Nov)

A:--

F: --

P: --

U.S. Initial Jobless Claims 4-Week Avg. (SA)

A:--

F: --

P: --

U.S. Weekly Initial Jobless Claims (SA)

A:--

F: --

P: --

U.S. Weekly Continued Jobless Claims (SA)

A:--

F: --

P: --

Canada Ivey PMI (SA) (Nov)

A:--

F: --

P: --

Canada Ivey PMI (Not SA) (Nov)

A:--

F: --

P: --

U.S. Non-Defense Capital Durable Goods Orders Revised MoM (Excl. Aircraft) (SA) (Sept)

A:--

F: --

P: --
U.S. Factory Orders MoM (Excl. Transport) (Sept)

A:--

F: --

P: --

U.S. Factory Orders MoM (Sept)

A:--

F: --

P: --

U.S. Factory Orders MoM (Excl. Defense) (Sept)

A:--

F: --

P: --

U.S. EIA Weekly Natural Gas Stocks Change

A:--

F: --

P: --

Saudi Arabia Crude Oil Production

A:--

F: --

P: --

U.S. Weekly Treasuries Held by Foreign Central Banks

A:--

F: --

P: --

Japan Foreign Exchange Reserves (Nov)

A:--

F: --

P: --

India Repo Rate

A:--

F: --

P: --

India Benchmark Interest Rate

A:--

F: --

P: --

India Reverse Repo Rate

A:--

F: --

P: --

India Cash Reserve Ratio

A:--

F: --

P: --

Japan Leading Indicators Prelim (Oct)

A:--

F: --

P: --

U.K. Halifax House Price Index YoY (SA) (Nov)

A:--

F: --

P: --

U.K. Halifax House Price Index MoM (SA) (Nov)

A:--

F: --

P: --

France Current Account (Not SA) (Oct)

--

F: --

P: --

France Trade Balance (SA) (Oct)

--

F: --

P: --

France Industrial Output MoM (SA) (Oct)

--

F: --

P: --

Italy Retail Sales MoM (SA) (Oct)

--

F: --

P: --

Euro Zone Employment YoY (SA) (Q3)

--

F: --

P: --

Euro Zone GDP Final YoY (Q3)

--

F: --

P: --

Euro Zone GDP Final QoQ (Q3)

--

F: --

P: --

Euro Zone Employment Final QoQ (SA) (Q3)

--

F: --

P: --

Euro Zone Employment Final (SA) (Q3)

--

F: --

P: --
Brazil PPI MoM (Oct)

--

F: --

P: --

Mexico Consumer Confidence Index (Nov)

--

F: --

P: --

Canada Unemployment Rate (SA) (Nov)

--

F: --

P: --

Canada Labor Force Participation Rate (SA) (Nov)

--

F: --

P: --

Canada Employment (SA) (Nov)

--

F: --

P: --

Canada Part-Time Employment (SA) (Nov)

--

F: --

P: --

Canada Full-time Employment (SA) (Nov)

--

F: --

P: --

U.S. Personal Income MoM (Sept)

--

F: --

P: --

U.S. Dallas Fed PCE Price Index YoY (Sept)

--

F: --

P: --

U.S. PCE Price Index YoY (SA) (Sept)

--

F: --

P: --

U.S. PCE Price Index MoM (Sept)

--

F: --

P: --

U.S. Personal Outlays MoM (SA) (Sept)

--

F: --

P: --

U.S. Core PCE Price Index MoM (Sept)

--

F: --

P: --

U.S. UMich 5-Year-Ahead Inflation Expectations Prelim YoY (Dec)

--

F: --

P: --

U.S. Core PCE Price Index YoY (Sept)

--

F: --

P: --

U.S. Real Personal Consumption Expenditures MoM (Sept)

--

F: --

P: --

U.S. 5-10 Year-Ahead Inflation Expectations (Dec)

--

F: --

P: --

U.S. UMich Current Economic Conditions Index Prelim (Dec)

--

F: --

P: --

U.S. UMich Consumer Sentiment Index Prelim (Dec)

--

F: --

P: --

U.S. UMich 1-Year-Ahead Inflation Expectations Prelim (Dec)

--

F: --

P: --

U.S. UMich Consumer Expectations Index Prelim (Dec)

--

F: --

P: --

Q&A with Experts
    • All
    • Chatrooms
    • Groups
    • Friends
    Connecting
    .
    .
    .
    Type here...
    Add Symbol or Code

      No matching data

      All
      Trump Updates
      Recommend
      Stocks
      Cryptocurrencies
      Central Banks
      Featured News
      • All
      • Russia-Ukraine Conflict
      • Middle East Flashpoint
      • All
      • Russia-Ukraine Conflict
      • Middle East Flashpoint
      Search
      Products

      Charts Free Forever

      Chats Q&A with Experts
      Screeners Economic Calendar Data Tools
      Membership Features
      Data Warehouse Market Trends Institutional Data Policy Rates Macro

      Market Trends

      Market Sentiment Order Book Forex Correlations

      Top Indicators

      Charts Free Forever
      Markets

      News

      News Analysis 24/7 Columns Education
      From Institutions From Analysts
      Topics Columnists

      Latest Views

      Latest Views

      Trending Topics

      Top Columnists

      Latest Update

      Signals

      Copy Rankings Latest Signals Become a signal provider AI Rating
      Contests
      Brokers

      Overview Brokers Assessment Rankings Regulators News Claims
      Broker listing Forex Brokers Comparison Tool Live Spread Comparison Scam
      Q&A Complaint Scam Alert Videos Tips to Detect Scam
      More

      Business
      Events
      Careers About Us Advertising Help Center

      White Label

      Data API

      Web Plug-ins

      Affiliate Program

      Awards Institution Evaluation IB Seminar Salon Event Exhibition
      Vietnam Thailand Singapore Dubai
      Fans Party Investment Sharing Session
      FastBull Summit BrokersView Expo
      Recent Searches
        Top Searches
          Markets
          News
          Analysis
          User
          24/7
          Economic Calendar
          Education
          Data
          • Names
          • Latest
          • Prev

          View All

          No data

          Scan to Download

          Faster Charts, Chat Faster!

          Download App
          English
          • English
          • Español
          • العربية
          • Bahasa Indonesia
          • Bahasa Melayu
          • Tiếng Việt
          • ภาษาไทย
          • Français
          • Italiano
          • Türkçe
          • Русский язык
          • 简中
          • 繁中
          Open Account
          Search
          Products
          Charts Free Forever
          Markets
          News
          Signals

          Copy Rankings Latest Signals Become a signal provider AI Rating
          Contests
          Brokers

          Overview Brokers Assessment Rankings Regulators News Claims
          Broker listing Forex Brokers Comparison Tool Live Spread Comparison Scam
          Q&A Complaint Scam Alert Videos Tips to Detect Scam
          More

          Business
          Events
          Careers About Us Advertising Help Center

          White Label

          Data API

          Web Plug-ins

          Affiliate Program

          Awards Institution Evaluation IB Seminar Salon Event Exhibition
          Vietnam Thailand Singapore Dubai
          Fans Party Investment Sharing Session
          FastBull Summit BrokersView Expo

          Why Crypto Is Selling Off - And What It Means For Risk Assets

          SAXO

          Cryptocurrency

          Forex

          Summary:

          Crypto's sharp pullback isn't just about digital assets - it's signalling a wider shift in global risk appetite. Here's what the move really tells us about markets today.

          Why crypto is selling off – and what it means for risk assets

          In a matter of weeks, crypto has swung from new highs and headlines about institutional adoption to renewed talk of a "crypto winter". Bitcoin has given back a meaningful part of its recent rally, with ethereum falling even further in percentage terms. The entire crypto market has dropped sharply, and many listed crypto-related equities have followed.

          For investors, the key question is no longer just why crypto is down, but what this move reveals about risk appetite. Crypto is increasingly behaving less like a niche asset and more like a high-beta gauge of global liquidity and market mood.

          From crypto story to risk signal

          A useful way to view today's market is to treat crypto as a liquidity canary.

          Crypto trades around the clock, reacts faster than most asset classes, and attracts both retail and institutional capital. That makes it highly sensitive to shifts in financial conditions. When liquidity is plentiful, capital flows in quickly. When it tightens, crypto is often the first place where it shows.

          Over recent years, bitcoin's correlation with high-growth tech stocks has strengthened. At the same time, crypto typically struggles when the US dollar strengthens or when real yields rise – two classic risk-off signals in global markets. In practice, moves in bitcoin now say as much about macro conditions as they do about crypto itself.

          For multi-asset investors, watching crypto levels has therefore become a way to gauge broader risk appetite in real time, rather than treating it as an isolated market.

          A look at the relationship: bitcoin vs tech

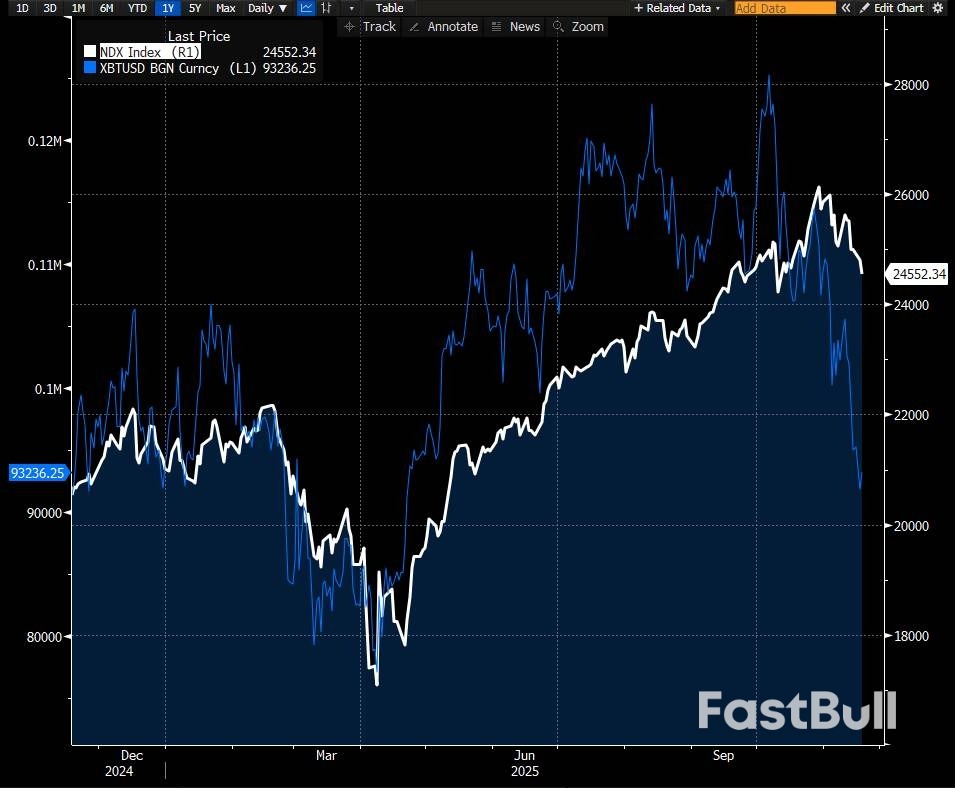
          Bitcoin and the Nasdaq 100 have moved broadly in step over the past year, with crypto amplifying equity swings. Source: Bloomberg, Saxo.

          Macro, liquidity and positioning

          The current sell-off is closely tied to a shift in the macro backdrop.

          Markets have dialled back expectations for rapid interest-rate cuts, and real yields – nominal yields adjusted for inflation – have moved higher. For assets with no cash flows, such as bitcoin and ethereum, a higher real cost of capital is a clear headwind.

          At the same time, high-growth technology and AI-linked stocks have also pulled back, and overall positioning in risk assets has become more cautious. Crypto, sitting at the high-beta end of that spectrum, naturally reacts more sharply.

          Market structure amplifies the move. Crypto markets remain heavily influenced by leverage. When widely watched price levels break, forced liquidations can accelerate selling, especially when liquidity is thin. Earlier inflows into crypto vehicles have also softened, removing one of the tailwinds that supported prices earlier in the year.

          Volatility: what derivatives markets are telling us

          Price is only part of the story. Volatility is offering its own signal.

          Implied volatility on bitcoin and ethereum has risen meaningfully as the sell-off unfolded. Typically, this comes with two features:

          · higher overall implied volatility, reflecting greater uncertainty
          · more expensive downside protection, as demand for put options increases

          Even for investors who never trade derivatives, these shifts are informative. Rising crypto volatility alongside rising equity or credit volatility often points to a broader risk-off environment. When volatility rises sharply in crypto but remains contained elsewhere, stress may be more localised.

          The message is simple: volatility has become an asset class of its own, and it can reveal changes in sentiment earlier than price alone.

          How this fits into previous crypto cycles

          Viewed over a longer horizon, the current pullback fits a familiar pattern.

          Previous crypto cycles have tended to feature strong rallies followed by sharp interim corrections – sometimes 20–40% – before either resuming the uptrend or shifting into a deeper downturn once liquidity fades. Large swings are a structural feature of the asset class.

          The current cycle has new characteristics: regulated investment products, greater institutional participation and a more developed derivatives market. The macro backdrop is also different, with higher inflation and higher real yields than in earlier cycles.

          Yet two themes remain constant:

          · large moves in crypto are normal
          · turning points are only obvious in hindsight

          Ethereum often experiences larger percentage swings than bitcoin, highlighting the higher risk profile of non-bitcoin exposures.

          What this means for investors

          This article does not attempt to forecast where bitcoin or ethereum will trade next. The more helpful question is simpler:Is this a moment for panic or euphoria?And the honest answer: neither.

          Instead, the latest move offers a clearer framework for thinking:

          · Don't overreact to big moves.Crypto's swings are dramatic by nature. A sharp drop does not automatically signal crisis, just as a fast rally does not guarantee a new cycle.
          · Let indicators steer your thinking, not emotions.Rising real yields, a stronger dollar and higher volatility explain why crypto behaves this way. Understanding the backdrop helps avoid emotional decisions.
          · Use crypto as a signal, not a trigger.Because crypto reacts fast, it can move before equities or credit. That makes it useful to watch – but not a reason to panic or celebrate.
          · Check your true exposure to risk.Investors holding both high-growth tech and crypto may have more concentrated risk than they realise, even if the allocation to crypto is small.
          · Stay rational, not reactive.Market swings create noise, but long-term drivers rarely change overnight. Decisions should reflect the environment, not the emotion of the moment.

          In short: this is not a moment to panic or to celebrate.It's a moment to think, stay aware of the backdrop, and keep crypto in context – as one piece of a much larger risk picture.

          Source: SAXO

          Risk Warnings and Disclaimers
          You understand and acknowledge that there is a high degree of risk involved in trading. Following any strategies or investment methods may lead to potential losses. The content on the site is provided by our contributors and analysts for information purposes only. You are solely responsible for determining whether any trading assets, securities, strategy, or any other product is suitable for investing based on your own investment objectives and financial situation.
          Add to Favorites
          Share

          Gold (XAU/USD) Price Technical Outlook: $4000/oz Holds Firm As FOMC Minutes And Labor Data Releases Lie Ahead

          MarketPulse by OANDA Group

          Commodity

          Forex

          Gold prices have had a topsy turvy start to the week but the $4000/oz handle has held firm. Bulls have returned and price has bounced off the confluence area at $4000 but needs acceptance above the $4100/oz handle for the rally to gather steam.

          The question on the minds of market participants is whether or not Gold bulls will remain in control after the Fed minutes release and Labor data on Thursday?

          Technical Outlook – Gold (XAU/USD)

          Looking at the four-hour chart below, the technical picture is interesting.

          Having bounced off the ascending trendline which lined up with the $4000/oz handle, Gold broke above the 100-day MA and is now testing the descending trendline drawn from the November 13 high around $4245/oz.

          A break of the descending trendline and the 50-day MA around the $4096/oz handle could open up a potential rally toward the previous descending trendline touch at $4212/oz.

          Of course there is a resistance area around the $4150/oz handle which could prove to be a stumbling block but bulls may be emboldened or if not will be eyeing US labor data and the Fed minutes as a potential catalyst.

          To keep the bullish momentum going, the 100-day MA at 4041 is now a crucial near-term support area. If this area holds, it should bode well for bullish momentum.

          Gold (XAU/USD) Four-Hour Chart, November 18, 2025

          Gold (XAU/USD) Price Technical Outlook: $4000/oz Holds Firm As FOMC Minutes And Labor Data Releases Lie Ahead_1

          Source: TradingView (click to enlarge)

          Market Dynamics and Data Releases

          The price of Gold (XAU/USD) has appeared relatively unaffected by the moves in the US Dollar Index of late. However, this does not mean that correlation is no longer something to keep an eye on.

          This week's Fed minutes and Labor data releases will play a major role in rate cut expectations which will impact market sentiment and the US Dollar Index. This in turn will play a major role in the movement of Gold prices moving forward.

          The aggressive repricing of rate cut probabilities for the Feds December meeting (93.7% probability a month ago vs 51.1% probability at present) has kept Gold gains in check.

          Gold (XAU/USD) Price Technical Outlook: $4000/oz Holds Firm As FOMC Minutes And Labor Data Releases Lie Ahead_2

          Source: CME FedWatch Tool

          However, a weak print on the labor data front could see rate cut expectations spike and thus propel Gold higher once more.

          Markets already know broadly what to expect from the Fed minutes release as it was Fed Chair Powell's tone and the 10-2 vote split at the Fed's October meeting that kickstarted the hawkish repricing of rate cut expectations.

          Thus the event could be sidelined by market participants in favor of Thursday's labor data release.

          Gold (XAU/USD) Price Technical Outlook: $4000/oz Holds Firm As FOMC Minutes And Labor Data Releases Lie Ahead_3

          For all market-moving economic releases and events, see the MarketPulse Economic Calendar.

          Source: MarketPulse by OANDA Group

          Risk Warnings and Disclaimers
          You understand and acknowledge that there is a high degree of risk involved in trading. Following any strategies or investment methods may lead to potential losses. The content on the site is provided by our contributors and analysts for information purposes only. You are solely responsible for determining whether any trading assets, securities, strategy, or any other product is suitable for investing based on your own investment objectives and financial situation.
          Add to Favorites
          Share

          Trump Tariff Exemption On Agri Products To Boost Indian Exports

          Winkelmann

          Forex

          Political

          Economic

          With U.S. President Donald Trump rolling back reciprocal tariffs on certain agriculture products, there are expected benefits for Indian farm exports to the U.S., currently worth $1 billion annually, including products such as tea, coffee and spices.

          Other items exempted from the sweeping tariffs through an executive order signed by Trump last week include tropical fruits and fruit juices, cocoa, bananas, oranges, and tomatoes, beef, and some fertilizers.

          India sees relief on these products as a boost for its agriculture exports to the U.S. On Monday, its ministry of commerce and industry said that while the move applies to all trading partners, it "creates [a] level-playing field for Indian exporters."

          "As far as India is concerned, India was facing a duty of 50% on these products -- all that becomes zero now," one of the ministry's officials said.

          India's overall agriculture exports to the U.S., excluding shrimp, is worth about $2.5 billion each year; and its farmers are expected to benefit from the latest tariff exemptions.

          However, Ajay Srivastava, founder of the New Delhi-based Global Trade Research Initiative think tank, said that Trump's tariff roll-back on certain agricultural products "could marginally strengthen India's competitive position in spices and niche horticulture, but the broader gains will accrue mainly to major Latin American, African, and ASEAN farm exporters unless India expands scale."

          He added that India has "almost no presence" in several of the largest exempted lines -- tomatoes, citrus fruits, melons, bananas, most fresh fruits, and fruit juices.

          India's goods exports to the U.S. in October expanded about 15% from the previous month, marking the first month-on-month rise since May, which comes after a 20% drop recorded in September.

          "Despite the October rebound, India's shipments to the U.S. have dropped nearly 28.4% between May and October, erasing more than $2.5 billion in monthly export value," Srivastava said in a note he shared with Nikkei Asia.

          Trump Tariff Exemption On Agri Products To Boost Indian Exports_1

          India and the U.S. started negotiating a bilateral trade agreement (BTA) after Indian Prime Minister Narendra Modi visited Washington in February and resolved with Trump to deepen ties and expand bilateral trade to $500 billion by 2030 from around $200 billion now. The two sides had also announced plans to negotiate phase one of the BTA by this fall.

          However, in August, the U.S. slapped 50% tariffs on goods from India, including a 25% penalty for New Delhi's purchase of Russian oil -- the steepest among the U.S. trading partners.

          On Sunday, Trump said that "any country that does business with Russia will be very severely sanctioned" as he extended support for a "very tough" legislation which is being pushed ahead by Republican lawmakers seeking to impose up to 500% tariffs on nations that purchase oil and gas from Moscow.

          On Monday, India's Petroleum Minister Hardeep Singh Puri announced that Indian state-run oil companies had concluded a one-year deal for the import of around 2.2 million metric tonnes of U.S. liquefied petroleum gas -- about 10% of the country's annual imports. Calling the move "a historic first!" Puri posted on X: "One of the largest and the world's fastest growing LPG market opens up to the United States."

          This has been "in works for long [and] is not something new," a senior official at the ministry of commerce and industry said separately. "India has been contemplating purchase of LPG from the U.S. The opportunity was not there [earlier and has now] come to the fore... This is in the overall context of keeping trade with the U.S. in the right mix. It's not part of any [trade] negotiation package per se, but definitely as [a] part of our endeavor [for] balanced trade [between the two countries]."

          On the BTA, the official said that India and the U.S. were negotiating a package to address reciprocal tariffs. This package "is more or less near closure [but] I can't put a deadline to it," the official added.

          "The BTA will have multiple packages, multiple tranches, [and] this will be the first tranche which will address the reciprocal tariffs."

          Source: Asia_Nikkei

          To stay updated on all economic events of today, please check out our Economic calendar
          Risk Warnings and Disclaimers
          You understand and acknowledge that there is a high degree of risk involved in trading. Following any strategies or investment methods may lead to potential losses. The content on the site is provided by our contributors and analysts for information purposes only. You are solely responsible for determining whether any trading assets, securities, strategy, or any other product is suitable for investing based on your own investment objectives and financial situation.
          Add to Favorites
          Share

          Here’s Why A Divided Fed Is Still Likely To Cut Rates In December

          Bethany Sullivan

          The Federal Reserve remains divided ahead of its December meeting, but this is unlikely to force the central bank to hit the brakes on another rate cut, Standard Chartered says, warning that expected softening in the labor market will continue to steer monetary policy.

          "We hold to our view that the FOMC will cut in December, largely because we see a good chance that employment data for September to November will be very soft," Steve Englander, Head, Global G10 FX Research and North America Macro Strategy said in recent note. "This should be enough to push the Fed centrists to the cutting side," he added.

          "November labor release will be weak, in our view," he added, noting that "seasonal hiring is likely to be very weak, layoffs unseasonably high," setting a bearish tone on the labor market heading into the meeting.

          Dissents against the Fed December policy decision is likely whether the Fed cuts or holds rates amid strong views on either scenario among Fed members in recent commentary.

          "If the FOMC cuts in December, there could easily be four dissents. If it stays on hold, there are likely to be three (possibly more) dissents," Englander added.

          The deep divide at the Fed is made of those "who want to cut probably want to cut more than 25 basis points, and those who want to hold want to hold for more than one meeting," Standard Chartered said.

          The root cause of the divide is not differing economic readings, which are "likely to be resolved by incoming data," Englander said, but rather "different assessments of how policy should respond to above-target inflation and below-target labour outcomes."

          The strongest hawkish voices include Jeffrey R. Schmid, President of the Federal Reserve Bank of Kansas City; Susan M. Collins, President of the Federal Reserve Bank of Boston; and Alberto G. Musalem, President of the Federal Reserve Bank of St. Louis. Their desire to "avoid front-loading cuts that might be hard to reverse contrasts with the dovish stance of Governor Stephen Miran, who believes that equilibrium interest rates are lower than commonly believed and disinflationary pressures are stronger, especially from rents," Englander added.

          At the December meeting, Standard Chartered believes the Fed doves are likely to prevail as consensus will lean toward delivering "labour-market insurance with another cut," rather than turning attention to inflation, which is far less threatening as unit labour costs - a key source of domestic inflation - are clearly trending downward.

          Source: Yahoo Finance

          Risk Warnings and Disclaimers
          You understand and acknowledge that there is a high degree of risk involved in trading. Following any strategies or investment methods may lead to potential losses. The content on the site is provided by our contributors and analysts for information purposes only. You are solely responsible for determining whether any trading assets, securities, strategy, or any other product is suitable for investing based on your own investment objectives and financial situation.
          Add to Favorites
          Share

          China’s New Bond Repurchase Channel Sees Rising Trading Volume

          Samantha Luan

          Bond

          Economic

          Forex

          Overseas investors are gradually increasing their use of a new bond repurchase facility for their purchases of Chinese bonds after the nation gave them greater access to the onshore repo market in September.

          Offshore investors conducted 13.1 billion yuan ($1.84 billion) of bond repurchases via the Bond Connect channel from Hong Kong in October, up from 810 million yuan the previous month, according to data from China Central Depository & Clearing Co.

          Trading using the channel began Sept. 26, when China broadened overseas investors' access to the onshore market by allowing bond repurchase transactions via the Bond Connect channel from Hong Kong. The initiative was part of Beijing's effort to enhance foreign investors' interest in yuan-denominated assets by enabling them to use a key liquidity function for bond trading.

          The policy has so far had little impact in stemming foreign outflows from Chinese bonds. Overseas holdings of the nation's debt in the interbank market fell to 3.73 trillion yuan in October, the lowest level since December 2023, central bank data show. One reason is the fact that Chinese bond yields remain well below those on US Treasuries.

          The low yield appeal of Chinese bonds could deter demand for using repurchases to leverage up positions, said Stephen Chiu, head of Asia foreign exchange and rates at Bloomberg Intelligence in Hong Kong.

          Foreign use of the repo trade channel under the Hong Kong Connect program still represents only a small fraction of overall trading levels of domestic and overseas investors. CCDC data show it settled a total of 103.8 trillion yuan of bond repurchases last month.

          Source: Bloomberg Europe

          To stay updated on all economic events of today, please check out our Economic calendar
          Risk Warnings and Disclaimers
          You understand and acknowledge that there is a high degree of risk involved in trading. Following any strategies or investment methods may lead to potential losses. The content on the site is provided by our contributors and analysts for information purposes only. You are solely responsible for determining whether any trading assets, securities, strategy, or any other product is suitable for investing based on your own investment objectives and financial situation.
          Add to Favorites
          Share

          Australia To Mandate 3 Hours Of Free Electricity Amid Renewables Glut

          Winkelmann

          Political

          Economic

          The Australian government plans to start requiring power companies to provide at least three hours of free daytime electricity to customers in a bid to narrow the mismatch between renewable energy supply and demand.

          The Solar Sharer program is to go into effect in July and will begin in the states of New South Wales, South Australia and Queensland before being expanded. The government is soliciting public feedback regarding the proposed rule, according to a notice released Nov. 4.

          All households equipped with wireless smart meters will be eligible to receive free electricity. This will include homes without solar panels installed. People who rent their home are also eligible.

          Renewable energy is a growing source of electricity in Australia, accounting for 36% of the total last year.

          Rooftop solar panels are driving this growth. Over 4 million households out of a population of roughly 27 million people have solar panels installed.

          Solar panels now account for 12% of Australia's electricity generation, and the proportion is expected to rise further.

          Solar power is generated during the day, but household electricity demand jumps in the evening, when many people return home. Electricity supply exceeds demand during the day.

          If power supply is out of step with demand, outages may occur. To maintain the correct balance, renewable energy need to be shut down.

          There is also "negative" pricing, where electricity producers essentially pay consumers or power retailers to take the surplus off their hands.

          Imbalances between supply and demand have become a widespread concern in Australia. Between 9 a.m. and 2 p.m., over 30% of wholesale electricity is traded for less than zero Australian dollars.

          Other countries have faced similar mismatches. French electricity prices went negative on the market for a total of 205 hours during the first half of the year. That exceeded the 128 hours logged in 2023.

          During the first half, Germany's had 224 negative pricing hours, triple as many as a year earlier. Spain recorded its first negative pricing hour in April.

          In the U.S., California accounted for a quarter of the negative price hours. In Japan, power producers have been curtailing excess output.

          Several companies in Australia have already started to offer free electricity voluntarily. In July, AGL rolled out a plan in South Australia, a renewable energy rich state, to provide power free of charge from 10 a.m. to 1 p.m.

          In 2020, Red Energy began offering electric vehicle owners two hours of free electricity on weekends.

          "On average, these customers used almost double the electricity during the free period compared to the average customer," said a Red Energy spokesperson.

          But such plans often charge higher rates outside of free hours. The Australian government says it is working with regulators to develop measures to prevent power companies from raising rates during non-free periods of the day.

          If companies are directed not to meaningfully increase prices during non-peak hours, it "will depress retailer profits," said Bruce Mountain, professor at Australia's Victoria University.

          The Australian Energy Council, an industry group, has been critical of the free electricity plan.

          Granting consumers universal access to free power "places material risks on retailers that in some instances might only be mitigated by them exiting a market," Louisa Kinnear, the Australian Energy Council's CEO, said in a statement.

          Source: Asia_Nikkei

          To stay updated on all economic events of today, please check out our Economic calendar
          Risk Warnings and Disclaimers
          You understand and acknowledge that there is a high degree of risk involved in trading. Following any strategies or investment methods may lead to potential losses. The content on the site is provided by our contributors and analysts for information purposes only. You are solely responsible for determining whether any trading assets, securities, strategy, or any other product is suitable for investing based on your own investment objectives and financial situation.
          Add to Favorites
          Share

          ADP Reports Stabilizing Layoffs, Modest Jobs Growth

          George Anderson

          U.S. businesses averaged approximately 2,500 weekly layoffs for the four weeks ending November 1, 2025, reported by the ADP Research Institute, reflecting ongoing labor market adjustments.

          While this layoff trend shows moderation compared to prior months, its impact on risk sentiment across financial and cryptocurrency markets remains under review.

          According to the ADP Research Institute, U.S. businesses averaged 2,500 weekly layoffs for October's final week. This marked a stabilization in the labor market, contrasting previously higher figures and indicating an easing in labor market challenges. ADP Research Institute noted, "For the four weeks ending November 1, 2025, U.S. businesses averaged approximately 2,500 weekly layoffs." ADP Research

          Dr. Nela Richardson, ADP's Chief Economist, explained job growth resumed modestly in October, marking the first increase since July. Despite the modest gains, pay growth remained flat, underscoring balanced shifts in supply and demand. Dr. Richardson reflected, "Private employers added jobs in October for the first time since July, but hiring was modest relative to what we reported earlier this year. Meanwhile, pay growth has been largely flat for more than a year, indicating that shifts in supply and demand are balanced." ADP Research

          This labor market trend impacts sectors differently, with gains in education and healthcare, while professional services see declines. Layoffs persist in certain industries, signaling ongoing adjustments in the market landscape.

          Financial implications suggest no direct funding shifts linked to labor trends. However, these indicators may influence risk sentiment among investors broadly, with indirect effects on market confidence reported.

          Broader macroeconomic conditions continue to shape employment patterns, with technology and demographic factors playing pivotal roles. ADP's data reflect ongoing adjustments without direct ties to cryptocurrency markets.

          Historical patterns reveal a recent downturn in August-September, followed by recovery. These fluctuations underscore how technological advancements and demographic changes impact labor trends, guiding future predictions.

          Source: CryptoSlate

          Risk Warnings and Disclaimers
          You understand and acknowledge that there is a high degree of risk involved in trading. Following any strategies or investment methods may lead to potential losses. The content on the site is provided by our contributors and analysts for information purposes only. You are solely responsible for determining whether any trading assets, securities, strategy, or any other product is suitable for investing based on your own investment objectives and financial situation.
          Add to Favorites
          Share
          FastBull
          Copyright © 2025 FastBull Ltd

          728 RM B 7/F GEE LOK IND BLDG NO 34 HUNG TO RD KWUN TONG KLN HONG KONG

          TelegramInstagramTwitterfacebooklinkedin
          App Store Google Play Google Play
          Products
          Charts

          Chats

          Q&A with Experts
          Screeners
          Economic Calendar
          Data
          Tools
          Membership
          Features
          Function
          Markets
          Copy Trading
          Latest Signals
          Contests
          News
          Analysis
          24/7
          Columns
          Education
          Company
          Careers
          About Us
          Contact Us
          Advertising
          Help Center
          Feedback
          User Agreement
          Privacy Policy
          Business

          White Label

          Data API

          Web Plug-ins

          Poster Maker

          Affiliate Program

          Risk Disclosure

          The risk of loss in trading financial instruments such as stocks, FX, commodities, futures, bonds, ETFs and crypto can be substantial. You may sustain a total loss of the funds that you deposit with your broker. Therefore, you should carefully consider whether such trading is suitable for you in light of your circumstances and financial resources.

          No decision to invest should be made without thoroughly conducting due diligence by yourself or consulting with your financial advisors. Our web content might not suit you since we don't know your financial conditions and investment needs. Our financial information might have latency or contain inaccuracy, so you should be fully responsible for any of your trading and investment decisions. The company will not be responsible for your capital loss.

          Without getting permission from the website, you are not allowed to copy the website's graphics, texts, or trademarks. Intellectual property rights in the content or data incorporated into this website belong to its providers and exchange merchants.

          Not Logged In

          Log in to access more features

          FastBull Membership

          Not yet

          Purchase

          Become a signal provider
          Help Center
          Customer Service
          Dark Mode
          Price Up/Down Colors

          Log In

          Sign Up

          Position
          Layout
          Fullscreen
          Default to Chart
          The chart page opens by default when you visit fastbull.com