


Markets
News
Analysis
User
24/7
Economic Calendar
Education
Data
- Names
- Latest
- Prev


U.S. producer prices unexpectedly fell in August amid a compression in trade services margins and mild increase in the cost of goods, suggesting that domestic businesses were probably absorbing some of the tariffs on imports.
U.S. producer prices unexpectedly fell in August amid a compression in trade services margins and mild increase in the cost of goods, suggesting that domestic businesses were probably absorbing some of the tariffs on imports.
The lack of strong producer price pressures, despite import duties, could also be signaling softening domestic demand against the backdrop of a struggling labor market. The Federal Reserve is expected to cut interest rates next Wednesday, with a quarter-percentage-point reduction fully priced in, after pausing its easing cycle in January because of uncertainty over the impact of President Donald Trump's sweeping tariffs."Inflation barely has a heartbeat at the producer level which shows the tariff effect is not boosting across-the-board price pressures yet," said Christopher Rupkey, chief economist at FWDBONDS. "As time goes on one has to wonder if there are slow-growth reasons and weak economic demand that is keeping inflation in check. There is almost nothing to stop an interest rate cut from coming now."
The Producer Price Index for final demand dipped 0.1% last month after a downwardly revised 0.7% jump in July, the Labor Department's Bureau of Labor Statistics said on Wednesday. Economists polled by Reuters had forecast the PPI would advance 0.3% after a previously reported 0.9% surge in July.A 0.2% drop in the prices of services accounted for the fall in the PPI. That followed a 0.7% rebound in July. Services were last month held down by a 1.7% decline in margins for trade services, reflecting a 3.9% decrease in margins for machinery and vehicle wholesaling.
But the cost of services less trade, transportation and warehousing increased 0.3% while prices for transportation and warehousing services shot up 0.9%.
Portfolio management fees increased 2.0%. Airline fares rose 1.0% while the cost of hotel and motel rooms increased 0.9%. Prices for dental services accelerated 0.6%.
Goods prices edged up 0.1% after increasing 0.6% in the prior month. Food prices gained 0.1%, with declines in the costs of eggs and fresh fruits partially offsetting more expensive beef and coffee because of tariffs. Wholesale beef prices surged 6.0% while those for coffee vaulted 6.9%.
Energy prices fell 0.4%. Excluding the volatile food and energy components, producer goods prices rose 0.3% after climbing 0.4% in July, indicating some pass through from tariffs. In the 12 months through August, the PPI increased 2.6% after climbing 3.1% in July.
Economists are expecting price pressures from tariffs to lift consumer inflation in August.
U.S. stocks opened higher. The dollar eased against a basket of currencies. U.S. Treasury yields fell.
Labor market weakness has raised concerns that the economy was stagnating. The government estimated on Tuesday that the economy likely created 911,000 fewer jobs in the 12 months through March than previously estimated.
That data followed the release last Friday of the monthly employment report, which showed job growth almost stalled in August and the economy shed jobs in June for the first time in four and a half years.
728 RM B 7/F GEE LOK IND BLDG NO 34 HUNG TO RD KWUN TONG KLN HONG KONG


The risk of loss in trading financial instruments such as stocks, FX, commodities, futures, bonds, ETFs and crypto can be substantial. You may sustain a total loss of the funds that you deposit with your broker. Therefore, you should carefully consider whether such trading is suitable for you in light of your circumstances and financial resources.
No decision to invest should be made without thoroughly conducting due diligence by yourself or consulting with your financial advisors. Our web content might not suit you since we don't know your financial conditions and investment needs. Our financial information might have latency or contain inaccuracy, so you should be fully responsible for any of your trading and investment decisions. The company will not be responsible for your capital loss.
Without getting permission from the website, you are not allowed to copy the website's graphics, texts, or trademarks. Intellectual property rights in the content or data incorporated into this website belong to its providers and exchange merchants.
Not Logged In
Log in to access more features

FastBull Membership
Not yet
Purchase


Log In
Sign Up


 Source:
 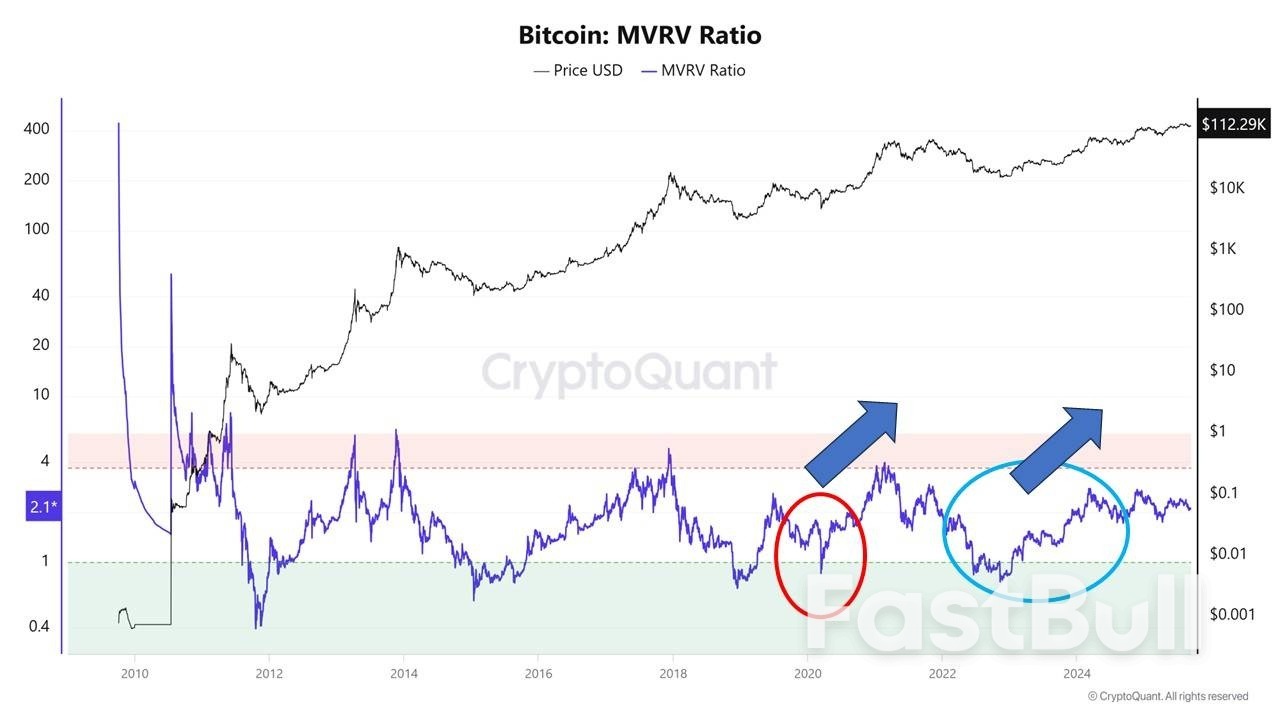 Source: CryptoQuant
 Daily E-mini S&P 500 Index
 Daily Oracle Corporation