• Trade
  • Markets
  • Copy
  • Contests
  • News
  • 24/7
  • Calendar
  • Q&A
  • Chats
Trending
Screeners
SYMBOL
LAST
BID
ASK
HIGH
LOW
NET CHG.
%CHG.
SPREAD
SPX
S&P 500 Index
6870.39
6870.39
6870.39
6895.79
6858.28
+13.27
+ 0.19%
--
DJI
Dow Jones Industrial Average
47954.98
47954.98
47954.98
48133.54
47871.51
+104.05
+ 0.22%
--
IXIC
NASDAQ Composite Index
23578.12
23578.12
23578.12
23680.03
23506.00
+72.99
+ 0.31%
--
USDX
US Dollar Index
98.890
98.970
98.890
98.960
98.730
-0.060
-0.06%
--
EURUSD
Euro / US Dollar
1.16505
1.16512
1.16505
1.16717
1.16341
+0.00079
+ 0.07%
--
GBPUSD
Pound Sterling / US Dollar
1.33233
1.33243
1.33233
1.33462
1.33136
-0.00079
-0.06%
--
XAUUSD
Gold / US Dollar
4206.51
4206.92
4206.51
4218.85
4190.61
+8.60
+ 0.20%
--
WTI
Light Sweet Crude Oil
59.325
59.355
59.325
60.084
59.247
-0.484
-0.81%
--

Community Accounts

Signal Accounts
--
Profit Accounts
--
Loss Accounts
--
View More

Become a signal provider

Sell trading signals to earn additional income

View More

Guide to Copy Trading

Get started with ease and confidence

View More

Signal Accounts for Members

All Signal Accounts

Best Return
  • Best Return
  • Best P/L
  • Best MDD
Past 1W
  • Past 1W
  • Past 1M
  • Past 1Y

All Contests

  • All
  • Trump Updates
  • Recommend
  • Stocks
  • Cryptocurrencies
  • Central Banks
  • Featured News
Top News Only
Share

Sudan's Paramilitary RSF Say They Controlled Oil-Rich Area Of Heglig In Kordofan

Share

German Government Spokesperson: We See Russia As A Threat To Our Security

Share

Thai Army Chief Of Staff: Thailand Seeking To Cripple Cambodia's Military Capability

Share

German Government Spokesperson: We Reject Criticism Of Europe In New US National Security Strategy

Share

Ivory Coast 2025/26 Cocoa Arrivals Reached 803000 T By December 7 Versus 820000 T A Year Ago - Exporters' Estimate

Share

EU To Delay Proposals For Automotive Sector, Including Co2 Emissions, To Dec 16, Draft EU Commission Document Shows

Share

Kremlin: India Buys Energy Where It Is Profitable To And As Far As We Understand They Will Continue To Do That

Share

Turkey's Main Banking Index Up 2.5%

Share

Turkey's Main BIST-100 Index Up 1.9%

Share

Hungary's Preliminary November Budget Balance Huf -403 Billion

Share

Indian Rupee Down 0.1% At 90.07 Per USA Dollar As Of 3:30 P.M. Ist, Previous Close 89.98

Share

India's Nifty 50 Index Provisionally Ends 0.96% Lower

Share

[JPMorgan: US Stock Rally May Stagnate Following Fed Rate Cut] JPMorgan Strategists Say The Recent Rally In US Stocks May Stall As Investors Take Profits Following The Anticipated Fed Rate Cut. The Market Currently Predicts A 92% Probability Of The Fed Lowering Borrowing Costs On Wednesday. Expectations Of A Rate Cut Have Continued To Rise, Fueled By Positive Signals From Policymakers In Recent Weeks. "Investors May Be More Inclined To Lock In Gains At The End Of The Year Rather Than Increase Directional Exposure," Mislav Matejka's Team Wrote In A Report

Share

Russian Defence Ministry: Russian Forces Take Control Of Novodanylivka In Ukraine's Zaporizhzhia Region

Share

Russian Defence Ministry: Russian Forces Take Control Of Chervone In Ukraine's Donetsk Region

Share

French Finance Ministry: Government Started Process To Block Temporarily Shein Platform

Share

Finance Minister: Indonesia To Impose Coal Export Tax Of Up To 5% Next Year

Share

[Trump Considering Fired Homeland Security Secretary Noem? White House Denies] According To Reports From US Media Outlets Such As The Daily Beast And The UK's Independent, The White House Has Denied Reports That US President Trump Is Considering Firing Homeland Security Secretary Noem. White House Spokesperson Abigail Jackson Posted On Social Media On The 7th Local Time, Calling The Claims "fake News" And Stating That "Secretary Noem Has Done An Excellent Job Implementing The President's Agenda And 'making America Safe Again'."

Share

HKEX: Standard Chartered Bought Back 571604 Total Shares On Other Exchanges For Gbp9.5 Million On Dec 5

Share

Morgan Stanley Reiterates Bullish Outlook On US Stocks Due To Fed Rate Cut Expectations. Morgan Stanley Strategists Believe That The US Stock Market Faces A "bullish Outlook" Given Improved Earnings Expectations And Anticipated Fed Rate Cuts. They Expect Strong Corporate Earnings By 2026, And Anticipate The Fed Will Cut Rates Based On Lagging Or Mildly Weak Labor Markets. They Expect The US Consumer Discretionary Sector And Small-cap Stocks To Continue To Outperform

TIME
ACT
FCST
PREV
France Industrial Output MoM (SA) (Oct)

A:--

F: --

P: --
France Trade Balance (SA) (Oct)

A:--

F: --

P: --
Euro Zone Employment YoY (SA) (Q3)

A:--

F: --

P: --
Canada Part-Time Employment (SA) (Nov)

A:--

F: --

P: --

Canada Unemployment Rate (SA) (Nov)

A:--

F: --

P: --

Canada Full-time Employment (SA) (Nov)

A:--

F: --

P: --

Canada Labor Force Participation Rate (SA) (Nov)

A:--

F: --

P: --

Canada Employment (SA) (Nov)

A:--

F: --

P: --

U.S. PCE Price Index MoM (Sept)

A:--

F: --

P: --

U.S. Personal Income MoM (Sept)

A:--

F: --

P: --

U.S. Core PCE Price Index MoM (Sept)

A:--

F: --

P: --

U.S. PCE Price Index YoY (SA) (Sept)

A:--

F: --

P: --

U.S. Core PCE Price Index YoY (Sept)

A:--

F: --

P: --

U.S. Personal Outlays MoM (SA) (Sept)

A:--

F: --

P: --
U.S. 5-10 Year-Ahead Inflation Expectations (Dec)

A:--

F: --

P: --

U.S. Real Personal Consumption Expenditures MoM (Sept)

A:--

F: --

P: --
U.S. Weekly Total Rig Count

A:--

F: --

P: --

U.S. Weekly Total Oil Rig Count

A:--

F: --

P: --

U.S. Consumer Credit (SA) (Oct)

A:--

F: --

P: --
China, Mainland Foreign Exchange Reserves (Nov)

A:--

F: --

P: --

Japan Trade Balance (Oct)

A:--

F: --

P: --

Japan Nominal GDP Revised QoQ (Q3)

A:--

F: --

P: --

China, Mainland Imports YoY (CNH) (Nov)

A:--

F: --

P: --

China, Mainland Exports (Nov)

A:--

F: --

P: --

China, Mainland Imports (CNH) (Nov)

A:--

F: --

P: --

China, Mainland Trade Balance (CNH) (Nov)

A:--

F: --

P: --

China, Mainland Exports YoY (USD) (Nov)

A:--

F: --

P: --

China, Mainland Imports YoY (USD) (Nov)

A:--

F: --

P: --

Germany Industrial Output MoM (SA) (Oct)

A:--

F: --

P: --
Euro Zone Sentix Investor Confidence Index (Dec)

A:--

F: --

P: --

Canada National Economic Confidence Index

--

F: --

P: --

U.K. BRC Like-For-Like Retail Sales YoY (Nov)

--

F: --

P: --

U.K. BRC Overall Retail Sales YoY (Nov)

--

F: --

P: --

Australia Overnight (Borrowing) Key Rate

--

F: --

P: --

RBA Rate Statement
RBA Press Conference
Germany Exports MoM (SA) (Oct)

--

F: --

P: --

U.S. NFIB Small Business Optimism Index (SA) (Nov)

--

F: --

P: --

Mexico 12-Month Inflation (CPI) (Nov)

--

F: --

P: --

Mexico Core CPI YoY (Nov)

--

F: --

P: --

Mexico PPI YoY (Nov)

--

F: --

P: --

U.S. Weekly Redbook Index YoY

--

F: --

P: --

U.S. JOLTS Job Openings (SA) (Oct)

--

F: --

P: --

China, Mainland M1 Money Supply YoY (Nov)

--

F: --

P: --

China, Mainland M0 Money Supply YoY (Nov)

--

F: --

P: --

China, Mainland M2 Money Supply YoY (Nov)

--

F: --

P: --

U.S. EIA Short-Term Crude Production Forecast For The Year (Dec)

--

F: --

P: --

U.S. EIA Natural Gas Production Forecast For The Next Year (Dec)

--

F: --

P: --

U.S. EIA Short-Term Crude Production Forecast For The Next Year (Dec)

--

F: --

P: --

EIA Monthly Short-Term Energy Outlook
U.S. API Weekly Gasoline Stocks

--

F: --

P: --

U.S. API Weekly Cushing Crude Oil Stocks

--

F: --

P: --

U.S. API Weekly Crude Oil Stocks

--

F: --

P: --

U.S. API Weekly Refined Oil Stocks

--

F: --

P: --

South Korea Unemployment Rate (SA) (Nov)

--

F: --

P: --

Japan Reuters Tankan Non-Manufacturers Index (Dec)

--

F: --

P: --

Japan Reuters Tankan Manufacturers Index (Dec)

--

F: --

P: --

Japan Domestic Enterprise Commodity Price Index MoM (Nov)

--

F: --

P: --

Japan Domestic Enterprise Commodity Price Index YoY (Nov)

--

F: --

P: --

China, Mainland PPI YoY (Nov)

--

F: --

P: --

Q&A with Experts
    • All
    • Chatrooms
    • Groups
    • Friends
    Connecting
    .
    .
    .
    Type here...
    Add Symbol or Code

      No matching data

      All
      Trump Updates
      Recommend
      Stocks
      Cryptocurrencies
      Central Banks
      Featured News
      • All
      • Russia-Ukraine Conflict
      • Middle East Flashpoint
      • All
      • Russia-Ukraine Conflict
      • Middle East Flashpoint
      Search
      Products

      Charts Free Forever

      Chats Q&A with Experts
      Screeners Economic Calendar Data Tools
      Membership Features
      Data Warehouse Market Trends Institutional Data Policy Rates Macro

      Market Trends

      Market Sentiment Order Book Forex Correlations

      Top Indicators

      Charts Free Forever
      Markets

      News

      News Analysis 24/7 Columns Education
      From Institutions From Analysts
      Topics Columnists

      Latest Views

      Latest Views

      Trending Topics

      Top Columnists

      Latest Update

      Signals

      Copy Rankings Latest Signals Become a signal provider AI Rating
      Contests
      Brokers

      Overview Brokers Assessment Rankings Regulators News Claims
      Broker listing Forex Brokers Comparison Tool Live Spread Comparison Scam
      Q&A Complaint Scam Alert Videos Tips to Detect Scam
      More

      Business
      Events
      Careers About Us Advertising Help Center

      White Label

      Data API

      Web Plug-ins

      Affiliate Program

      Awards Institution Evaluation IB Seminar Salon Event Exhibition
      Vietnam Thailand Singapore Dubai
      Fans Party Investment Sharing Session
      FastBull Summit BrokersView Expo
      Recent Searches
        Top Searches
          Markets
          News
          Analysis
          User
          24/7
          Economic Calendar
          Education
          Data
          • Names
          • Latest
          • Prev

          View All

          No data

          Scan to Download

          Faster Charts, Chat Faster!

          Download App
          English
          • English
          • Español
          • العربية
          • Bahasa Indonesia
          • Bahasa Melayu
          • Tiếng Việt
          • ภาษาไทย
          • Français
          • Italiano
          • Türkçe
          • Русский язык
          • 简中
          • 繁中
          Open Account
          Search
          Products
          Charts Free Forever
          Markets
          News
          Signals

          Copy Rankings Latest Signals Become a signal provider AI Rating
          Contests
          Brokers

          Overview Brokers Assessment Rankings Regulators News Claims
          Broker listing Forex Brokers Comparison Tool Live Spread Comparison Scam
          Q&A Complaint Scam Alert Videos Tips to Detect Scam
          More

          Business
          Events
          Careers About Us Advertising Help Center

          White Label

          Data API

          Web Plug-ins

          Affiliate Program

          Awards Institution Evaluation IB Seminar Salon Event Exhibition
          Vietnam Thailand Singapore Dubai
          Fans Party Investment Sharing Session
          FastBull Summit BrokersView Expo

          US Census Bureau Says Implementing Strategies To Bring Economic Data Releases Back On Track

          James Whitman

          Economic

          Summary:

          The U.S. Census Bureau said on Wednesday it was adopting several strategies, including shortening the window for Principal Federal Economic Indicators collection, to get economic data back to their original release schedule "as quickly as possible."

          The U.S. Census Bureau said on Wednesday it was adopting several strategies, including shortening the window for Principal Federal Economic Indicators collection, to get economic data back to their original release schedule "as quickly as possible."

          "For our PFEIs to return to their original release schedules, processing stages must be accelerated and condensed where possible while still adhering to established quality standards," the Census Bureau said in a statement posted on its website.

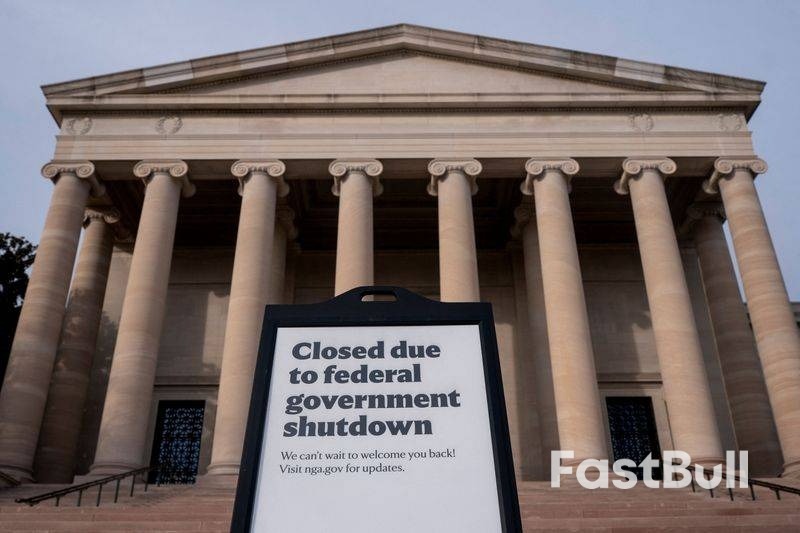
          A record 43-day shutdown of the government has delayed economic releases. The October employment and consumer price reports have been canceled because the shutdown prevented the collection of data, which could not be done retroactively.

          "For example, if the typical process allows 10 business days to obtain response, narrow it to seven days," the agency said. "For construction indicators that use field representatives, there may be an opportunity to collect two reference periods simultaneously."

          It was also temporarily reallocating resources to prioritize high-value review and correction while ensuring the shorter analysis period would not negatively impact data quality. While there were no changes to the treatment of nonresponses as the process was automated, the Census Bureau said more attention was being paid to "mitigate any negative effects of reduced response stemming from a shorter collection window."

          There was minimal change to the seasonal adjustment process, which is mostly automated. The agency, however, said "there may be an opportunity to readjust resources to help fast-track review and validation component of seasonal adjustment."

          Seasonal adjustment is used to strip out seasonal fluctuations from economic data. The Census Bureau is also temporarily reallocating resources to fast-track review, approval and dissemination processes.

          "By leveraging the strategies above, a Census Bureau PFEI such as monthly wholesale trade could temporarily reduce its total processing time from 30 to 20 days," the agency said.

          "If the indicator is starting 40 days behind schedule due to the lapse (in government funding), it could return to its original release cadence within four reference periods after implementing the acceleration strategy."

          Source: Reuters

          To stay updated on all economic events of today, please check out our Economic calendar
          Risk Warnings and Disclaimers
          You understand and acknowledge that there is a high degree of risk involved in trading. Following any strategies or investment methods may lead to potential losses. The content on the site is provided by our contributors and analysts for information purposes only. You are solely responsible for determining whether any trading assets, securities, strategy, or any other product is suitable for investing based on your own investment objectives and financial situation.
          Add to Favorites
          Share

          Nvidia Servers Speed up AI Models From China's Moonshoot AI and Others Tenfold

          Manuel

          Stocks

          Nvidia (NVDA.O) on Wednesday published new data showing that its latest artificial intelligence server can improve the performance of new models - including two popular ones from China - by 10 times.
          The data comes as the AI world has shifted its focus from training AI models, where Nvidia dominates the market, to putting them to use for millions of users, where Nvidia faces far more competition from rivals such as Advanced Micro Devices (AMD.O) and Cerebras.Nvidia's data focused on what are known as mixture-of-expert AI models.
          The technique is a way of making AI models more efficient by breaking up questions into pieces that are assigned to "experts" within the model. That exploded in popularity this year after China's DeepSeek shocked the world with a high-performing open source model that took less training on Nvidia chips than rivals in early 2025.
          Since then, the mixture-of-experts approach has been adopted by ChatGPT maker OpenAI, France's Mistral and China's Moonshoot AI, which in July released a highly-ranked open source model of its own.Meanwhile, Nvidia has focused on making the case that while such models might require less training on its chips, its offerings can still be used to serve those models to users.
          Nvidia on Wednesday said that its latest AI server, which packs 72 of its leading chips into a single computer with speedy links between them, improved the performance of Moonshot's Kimi K2 Thinking model by 10 times compared to the previous generation of Nvidia servers, a similar performance gain to what Nvidia has seen with DeepSeek's models.
          Nvidia said the gains primarily came from the sheer number of chips it can pack into servers and the fast links between them, an area where Nvidia still has advantages over its rivals.
          Nvidia competitor AMD is working on a similar server packed with multiple powerful chips that it has said will come to market next year.

          Source: Reuters

          Risk Warnings and Disclaimers
          You understand and acknowledge that there is a high degree of risk involved in trading. Following any strategies or investment methods may lead to potential losses. The content on the site is provided by our contributors and analysts for information purposes only. You are solely responsible for determining whether any trading assets, securities, strategy, or any other product is suitable for investing based on your own investment objectives and financial situation.
          Add to Favorites
          Share

          Strategy´s Yield Hunt Inadvertently Helps the Very Hedge Funds Looking to Short its Bitcoin Premium

          Manuel

          Cryptocurrency

          Stocks

          Strategy, formerly known as MicroStrategy, is considering a pivot that would fundamentally alter the risk profile of the world’s largest corporate Bitcoin treasury.
          For a decade, the company sold Wall Street on a singular thesis: it was a digital vault, offering unencumbered exposure to Bitcoin without the risks of custody or counterparty risk. That stand is changing as it is now exploring an entry into the crypto lending market.
          On Dec. 2, Strategy CEO Phong Le told Bloomberg the firm was in talks with banks about lending out its holdings. However, he cautioned that the firm was still waiting for major financial institutions to enter the space before making any decision.
          He said: “We’ve had a lot of constructive discussions. They have primarily been: we are thinking about offering Bitcoin services—custody, exchange, lending, etc. You are the largest corporate holder of Bitcoin in the world; what is your advice to us, and should we work together?”
          While framed as a maturation of the business, the move exposes the company to re-hypothecation risks that contradict the “cold storage” ethos that built its $55 billion reserve.
          Nonetheless, the pivot signals that Strategy is moving from a passive holding company to an active credit desk.
          This shift is driven by the need to justify its valuation premium in a market where spot ETFs have commoditized Bitcoin access.

          The yield trap

          Strategy currently holds 650,000 BTC. Historically, this stockpile has sat idle in the firm’s coffers.
          So, lending it out would generate revenue. However, it introduces a paradox as the primary institutional demand for borrowing Bitcoin comes from market makers and hedge funds looking to short the asset.
          To understand the risk, one must look at the mechanics of the trade.
          In the institutional market, demand for borrowing Bitcoin is rarely for holding, as it is almost exclusively for selling to hedge derivative exposure.
          By injecting its massive reserves into the lending market, Strategy would effectively lower the “cost to borrow,” a key friction that typically discouraged short sellers.
          Consequently, Strategy would effectively be supplying the inventory used to bet against the price appreciation of its own reserve by opening a lending desk.
          Moreover, the move introduces counterparty risk to a balance sheet that had previously been defined by its simplicity.
          Notably, the crypto credit market collapsed spectacularly in 2022 after lenders like BlockFi and Celsius mispriced the risk of lending to opaque borrowers.
          While Le insists that Strategy will partner only with top-tier banks, the core premise remains that Bitcoin will leave its vault.
          So, in the event of a banking failure or a credit seizure, Strategy would transition from an owner of property to an unsecured creditor.

          Defending the premium

          Meanwhile, Strategy’s search for yield appears tied to its compressing stock valuation.
          The company’s model relies on trading at a premium to its Net Asset Value (NAV), allowing it to issue equity at inflated prices to buy more Bitcoin. That premium, once as high as 2.5x, has cooled. As of Dec. 3, Strategy’s multiple to NAV (mNAV) stood at 1.15.Strategy´s Yield Hunt Inadvertently Helps the Very Hedge Funds Looking to Short its Bitcoin Premium_1
          In a candid admission, the firm recently admitted that it would consider selling Bitcoin if the mNAV falls below 1.
          This creates a potential “reflexivity loop” in the market: if Strategy’s share price falters, the company could be forced to liquidate Bitcoin, driving spot prices down and further depressing the share price.
          To prevent this, the Michael Saylor-led firm needs to offer investors something the ETFs cannot: yield.
          Moreover, the company recently raised $1.44 billion in equity to cover dividend obligations on its preferred shares, stressing the cash-flow strain of maintaining its current capital structure.
          Considering this, lending the Bitcoin stack is one of the only ways to fund these payouts without diluting common shareholders or selling the underlying asset.

          A crowded trade

          If Strategy enters the lending arena, it faces a market significantly different from the uncollateralized “Wild West” of 2021.
          According to Galaxy Digital, stablecoin issuer Tether currently dominates centralized lending with a $14.6 billion book.
          However, Tether lends stablecoins (USDT), fueling leverage for buyers. Strategy would be lending Bitcoin, fueling supply for borrowers.Strategy´s Yield Hunt Inadvertently Helps the Very Hedge Funds Looking to Short its Bitcoin Premium_2
          In a candid admission, the firm recently admitted that it would consider selling Bitcoin if the mNAV falls below 1.
          This creates a potential “reflexivity loop” in the market: if Strategy’s share price falters, the company could be forced to liquidate Bitcoin, driving spot prices down and further depressing the share price.
          To prevent this, the Michael Saylor-led firm needs to offer investors something the ETFs cannot: yield.
          Moreover, the company recently raised $1.44 billion in equity to cover dividend obligations on its preferred shares, stressing the cash-flow strain of maintaining its current capital structure.
          Considering this, lending the Bitcoin stack is one of the only ways to fund these payouts without diluting common shareholders or selling the underlying asset.

          A crowded trade

          If Strategy enters the lending arena, it faces a market significantly different from the uncollateralized “Wild West” of 2021.
          According to Galaxy Digital, stablecoin issuer Tether currently dominates centralized lending with a $14.6 billion book.
          However, Tether lends stablecoins (USDT), fueling leverage for buyers. Strategy would be lending Bitcoin, fueling supply for borrowers.
          The sheer size of Strategy’s 650,000 BTC reserve significantly dwarfs the collateral pools of competitors like Nexo and Galaxy and could potentially distort the market. If even a fraction of that supply hits the lending desks, the cost to borrow Bitcoin could collapse, crushing yields across the sector.
          Essentially, Strategy is betting that it can transform itself from a passive wrapper into a sophisticated financial operator. But in doing so, it risks trading the clarity of “digital gold” for the opacity of structured credit.
          For investors who bought Strategy as a proxy for pristine collateral, the vault door is beginning to look worryingly open.

          Source: Cryptoslate

          Risk Warnings and Disclaimers
          You understand and acknowledge that there is a high degree of risk involved in trading. Following any strategies or investment methods may lead to potential losses. The content on the site is provided by our contributors and analysts for information purposes only. You are solely responsible for determining whether any trading assets, securities, strategy, or any other product is suitable for investing based on your own investment objectives and financial situation.
          Add to Favorites
          Share

          Trump Rolls Back Biden-era Fuel Economy Standards, Paving way for More Gas-Powered Cars

          Manuel

          Political

          Economic

          President Trump rolled back fuel economy rules that he claims created an “EV mandate” after former President Joe Biden imposed stricter fuel economy standards last year.
          Trump said the administration was officially terminating Biden’s “ridiculous” CAFE (corporate average fuel economy) rules, claiming car prices would come down in response to today’s action. Automakers are now required to meet an average of 34.5 mpg across their model fleet by 2031, a dramatic drop from the average of 50.4 mpg across 2031 that the Biden administration had proposed.
          Trump said the action would allow automakers to produce cheaper cars, saving consumers “[at] least $1,000” off the price of a car.
          Ford (F) CEO Jim Farley, Stellantis (STLA) CEO Antonio Filosa, and other auto industry executives were in attendance.
          “Today is a victory for common sense and affordability,” Farley said at the event. “This is the right move … We will invest more in affordable vehicles.”
          Earlier this year, the Transportation Department and Secretary Sean Duffy paved the way for looser US fuel economy standards by declaring the Biden administration exceeded its authority, assuming increasing EV sales in calculating fleet mile per gallon rules. The prior rules assumed the fuel economy averages for the “fleet” of vehicles available by specific automakers would rise due to the higher uptake of EVs.
          Trump also signed legislation this year that ended fuel economy penalties for automakers, with the National Highway Traffic Safety Administration (NHTSA) claiming the industry faced no fines dating back to the 2022 model year. Automakers like Tesla make billions by selling emission credits for these penalties, a source of revenue that will now disappear.
          Wednesday’s action furthers Trump’s moves to weaken environmental regulations and aid automakers.
          ​​“We’re reviewing NHTSA’s announcement, but we’re glad the agency has proposed new fuel economy standards,” said John Bozzella, president and CEO of the Alliance for Automotive Innovation, the industry’s top trade group.
          “We’ve been clear and consistent: The current CAFE rules finalized under the previous administration are extremely challenging for automakers to achieve given the current marketplace for EVs."
          Bozzella added, “What’s good for consumers and the auto industry? A stable regulatory environment and balanced, reasonable, achievable standards that continue to reduce emissions and improve fuel economy.”
          Public advocacy groups countered the industry’s position.
          “The previous fuel economy standards — which the Trump administration has now said it will not enforce — would have saved Americans $23 billion in fuel costs and reduced our national fuel consumption by 70 billion gallons,” said Will Anderson, zero-emission vehicles policy advocate at Public Citizen. “Americans support strong fuel economy standards… [with] two-thirds saying that fuel economy is very important or extremely important.”
          Anderson added that the new policy diverts money to “Trump’s oil and gas cronies” at the expense of the American public.

          Source: Yahoo Finance

          To stay updated on all economic events of today, please check out our Economic calendar
          Risk Warnings and Disclaimers
          You understand and acknowledge that there is a high degree of risk involved in trading. Following any strategies or investment methods may lead to potential losses. The content on the site is provided by our contributors and analysts for information purposes only. You are solely responsible for determining whether any trading assets, securities, strategy, or any other product is suitable for investing based on your own investment objectives and financial situation.
          Add to Favorites
          Share

          Gold Holds Steady, Silver Scales Record High

          Manuel

          Commodity

          Central Bank

          Gold prices held steady on Wednesday, buoyed by weak private payrolls data that reinforced expectations of a U.S. interest rate cut next week, while silver hit a fresh record high.
          Spot gold was little changed at $4,202.06 an ounce by 2:03 p.m. ET (1903 GMT), after hitting a session high of $4,241.29 earlier in the session.
          U.S. gold futures for February delivery settled 0.3% higher at $4,232.50.
          Silver steadied after touching a record high of $58.98 earlier in the session.
          "This morning's miss on ADP data, combined with silver hitting all-time highs overnight," is supportive for gold, said RJO Futures senior market strategist Bob Haberkorn.
          "Gold is following silver at the moment, with silver pulling back a little bit here."
          U.S. private payrolls fell by 32,000 jobs in November, Wednesday's ADP employment report showed, missing economists' expectations for a 10,000-job increase.
          CME's FedWatch tool now shows an 89% chance that the U.S. central bank will cut rates next week, while major brokerages also forecast an interest rate cut at the December 9-10 policy meeting.
          Markets are still awaiting the delayed September Personal Consumption Expenditures data, the Fed's preferred inflation gauge, due on Friday.
          Lower interest rates tend to favor non-yielding assets such as gold.
          Silver is up 102% so far this year due to concerns about the market liquidity after outflows to the U.S. stocks, its inclusion in the U.S. critical minerals list and a structural supply deficit.
          "The strength in silver is due to supply concerns at the exchange levels," Haberkorn said, adding that the metal could touch the $60/oz milestone shortly.
          Copper prices also hit a record high on Wednesday on a weaker dollar, supply concerns and tighter availability of metal in warehouses registered with the London Metal Exchange.
          Elsewhere, platinum gained 0.9% to $1,652.03 an ounce and palladium rose 0.4% to $1,466.98.

          Source: Reuters

          Risk Warnings and Disclaimers
          You understand and acknowledge that there is a high degree of risk involved in trading. Following any strategies or investment methods may lead to potential losses. The content on the site is provided by our contributors and analysts for information purposes only. You are solely responsible for determining whether any trading assets, securities, strategy, or any other product is suitable for investing based on your own investment objectives and financial situation.
          Add to Favorites
          Share

          Oracle Credit Fear Gauge Hits Highest Since 2009 on AI Bubble Fears

          Manuel

          Bond

          Stocks

          A credit-risk gauge on Oracle Corp. debt closed at the highest level since the financial crisis after a flood of bond sales from tech giants amplified concerns that a bubble is forming in the artificial-intelligence industry.
          The cost of protecting Oracle’s debt against default reached its highest since March 2009 on Tuesday, based on end-of-the-day credit derivative prices in New York, rising to about 1.28 percentage point a year, according to ICE Data Services. The price rose nearly 0.03 percentage point from the day before, and has more than tripled from as low as 0.36 percentage point in June.
          The gauge pared some of the price gains Wednesday, tightening as much as 0.024 percentage point.
          Oracle has effectively sold tens of billions of dollars of bonds in recent months, through note sales in its own name and indirectly through projects that it’s backing. Those debt sales, paired with the fact that Oracle has weaker credit ratings than other cloud-computing giants, have made the company’s credit default swaps a key way for investors to protect themselves from an AI crash.
          The rising cost of default protection reflects investor angst over the gap between the massive investments already made in AI and when investors can expect to see productivity gains and an increase in corporate profits. TD Securities’ Hans Mikkelsen warns that the boom echoes previous periods of market mania that have driven asset prices to extremes before falling back to earth.
          “We’ve had these kinds of cycles before,” the strategist said in an interview. “I can’t prove that it’s the same, but it seems like what we’ve seen, for example, during the dot-com bubble.”
          A representative for Oracle declined to comment.
          Morgan Stanley cautioned in late November that Oracle’s growing debt pile risks driving the company’s credit default swaps even closer to 2 percentage points, just above its 2008 all-time high. The figure reached on Tuesday was the highest since a March 2009 level of 1.30 percentage point for a New York close.
          Austin-based Oracle, the lowest rated of the leading hyperscalers, sold $18 billion of US high-grade corporate bonds in September and its data centers are linked to the largest deal for AI-infrastructure to come to market. Oracle’s artificial intelligence ambitions are closely linked to OpenAI and the database firm is counting on hundreds of billions of dollars in revenues from OpenAI over the next few years.
          Oracle had about $105 billion of debt, including leases, as of the end of August, according to data compiled by Bloomberg. About $95 billion of its debt is now in the form of US bonds included in the Bloomberg US Corporate index. The company is the biggest issuer in the index outside of the banking industry.
          Investors have been snapping up hedges on the BBB rated firm’s debt recently. Trading volume on Oracle’s CDS had ballooned to about $8 billion over the nine weeks ended Nov. 28, according to an analysis of trade repository data by Barclays Plc credit strategist Jigar Patel. That’s up from $350 million in the same period last year.

          What Bloomberg Intelligence Says

          Data-center infrastructure outlays amid seemingly insatiable AI demand are boosting hyperscalers’ borrowing, spurring valuation concerns. Yet this angst may be excessive if the biggest tech companies reduce shareholder payouts. Record tech debt issuance can extend into 2026, but might be tempered by the vast amount of cash on balance sheets and hundreds of billions of dollars available as free cash flow before buybacks and dividends.

          Source: Bloomberg

          Risk Warnings and Disclaimers
          You understand and acknowledge that there is a high degree of risk involved in trading. Following any strategies or investment methods may lead to potential losses. The content on the site is provided by our contributors and analysts for information purposes only. You are solely responsible for determining whether any trading assets, securities, strategy, or any other product is suitable for investing based on your own investment objectives and financial situation.
          Add to Favorites
          Share

          China’s Balancing Act: Property Woes, Weak Demand, and Deflation Threaten 2026 Recovery

          Gerik

          Economic

          Confidence Abroad, Uncertainty at Home

          As 2025 ends, China has projected renewed global confidence through strategic responses to U.S. tariffs, breakthroughs in AI, and growing assertiveness in critical resources like rare earths. However, this image contrasts sharply with its domestic economic outlook. While political and technological momentum may bolster China’s standing externally, internal economic data reflect a trifecta of unresolved vulnerabilities: a deteriorating property sector, sluggish household consumption, and deflationary pressures.
          These issues are expected to dominate the agenda at the upcoming Central Economic Work Conference, which traditionally outlines the policy direction for the year ahead. Economists are watching for decisive actions that could determine whether China can stabilize its economy or slide further into stagnation.

          Property Sector: Deepening Crisis Despite Repeated Interventions

          The property market continues to be China’s most destabilizing economic fault line. This year, the financial instability of Vanke, once a symbol of real estate strength, has become a focal point. The company’s request to delay repayment of a 2 billion yuan bond triggered a credit downgrade by S&P Global Ratings, reigniting fears about sector-wide contagion. As confidence among homebuyers erodes, property sales have tumbled, with November figures showing a decline of 20% to 30% year-on-year.
          This relationship between developer insolvency and weakening consumer sentiment appears causal. As high-profile firms like Vanke struggle, public confidence diminishes, prompting buyers to delay or cancel purchases, which in turn further depresses developer cash flows. Edward Chan of S&P emphasized that government interventions such as mortgage subsidies are unlikely to reverse the trend without broader structural reforms.
          Data from Goldman Sachs and S&P suggest that monthly sales are still more than 65 billion yuan below 2024 levels. Yet, the government has not clarified a threshold that would trigger more aggressive policy responses, leading to continued uncertainty in the sector.

          Consumption: Supply-Side Optimism Meets Demand-Side Fragility

          Despite Beijing’s efforts to boost domestic demand, structural weaknesses in household finances and labor markets continue to suppress consumption. Policymakers announced ambitious plans to grow consumer industries such as electronics and sports goods, with goals to create several sectors worth over 1 trillion yuan by 2027. However, these strategies are almost entirely focused on expanding supply rather than stimulating real demand.
          Goldman Sachs analysts noted that the policy lacks clarity on funding mechanisms and fails to address short-term consumption triggers like employment and income support. The correlation here is instructive: although consumer-facing sectors might grow through investment and innovation, household purchasing power is not keeping pace, and bad loan ratios for consumers have surpassed those of businesses.
          Natixis data shows that the household non-performing loan ratio reached 1.33% in the first half of 2025, exceeding the corporate ratio of 1.2%. This signals an imbalance in resilience: businesses can restructure debt or access relief, but households face limited recovery options under continued pressure from housing and job markets.

          Deflation: A Symptom of Weak Demand and Price Wars

          China’s inflation narrative has shifted from overheating fears to deflation anxiety. While the official headline inflation hovers near zero, the core Consumer Price Index (excluding volatile food and energy prices) rose just 1.2% in October. However, Chief Economist Ting Lu at Nomura pointed out that nearly a quarter of that increase came from gold price surges. Adjusted for that, core inflation stands at a tepid 0.9%.
          This low inflation reflects more than just pricing dynamics—it reveals a deeper reluctance among consumers to spend and a hyper-competitive market where firms resort to price-cutting to attract demand. Charlene Chu of Autonomous Research noted that prolonged deflation is discouraging domestic corporate investment, raising the risk of a capital allocation spiral that could suppress productivity and growth in the medium term.
          Gene Ma of the Institute of International Finance emphasized that China’s most urgent problem is weak aggregate demand. The drop in investment is particularly concerning, having slowed more rapidly than consumption in 2025. This underscores a potential causal chain where investment downturns, triggered by uncertainty and poor returns, exacerbate income stagnation, which in turn limits consumption, a reinforcing cycle.

          Looking Ahead: Signs of Stabilization or Further Risk?

          China’s November inflation data, along with industrial production and retail figures due mid-December, will offer critical insight into whether the economic drag is intensifying or plateauing. Analysts anticipate that Beijing may respond with policy stimulus in the spring, aiming to stabilize growth at the start of the next five-year plan.
          Meanwhile, the CSI 300 Index remains stable, posting a modest gain of 0.65% for the week and up over 15% year-to-date. The Hang Seng, while more volatile, has climbed nearly 29% in 2025. The offshore yuan has also strengthened to its best level since late 2024, reflecting tentative investor optimism though this could reverse swiftly if policy clarity is not delivered soon.
          China's global tech advances and geopolitical assertiveness have strengthened its external narrative, but its internal fragilities remain unresolved. The real estate crisis, consumer insecurity, and deflationary risks are not simply parallel challenges they are interlinked forces that reflect a broader demand-side weakness. Without significant fiscal support, job creation, and direct aid to households, China risks beginning 2026 with a confidence gap that no AI breakthrough or trade summit can easily fill.

          Source: CNBC

          To stay updated on all economic events of today, please check out our Economic calendar
          Risk Warnings and Disclaimers
          You understand and acknowledge that there is a high degree of risk involved in trading. Following any strategies or investment methods may lead to potential losses. The content on the site is provided by our contributors and analysts for information purposes only. You are solely responsible for determining whether any trading assets, securities, strategy, or any other product is suitable for investing based on your own investment objectives and financial situation.
          Add to Favorites
          Share
          FastBull
          Copyright © 2025 FastBull Ltd

          728 RM B 7/F GEE LOK IND BLDG NO 34 HUNG TO RD KWUN TONG KLN HONG KONG

          TelegramInstagramTwitterfacebooklinkedin
          App Store Google Play Google Play
          Products
          Charts

          Chats

          Q&A with Experts
          Screeners
          Economic Calendar
          Data
          Tools
          Membership
          Features
          Function
          Markets
          Copy Trading
          Latest Signals
          Contests
          News
          Analysis
          24/7
          Columns
          Education
          Company
          Careers
          About Us
          Contact Us
          Advertising
          Help Center
          Feedback
          User Agreement
          Privacy Policy
          Business

          White Label

          Data API

          Web Plug-ins

          Poster Maker

          Affiliate Program

          Risk Disclosure

          The risk of loss in trading financial instruments such as stocks, FX, commodities, futures, bonds, ETFs and crypto can be substantial. You may sustain a total loss of the funds that you deposit with your broker. Therefore, you should carefully consider whether such trading is suitable for you in light of your circumstances and financial resources.

          No decision to invest should be made without thoroughly conducting due diligence by yourself or consulting with your financial advisors. Our web content might not suit you since we don't know your financial conditions and investment needs. Our financial information might have latency or contain inaccuracy, so you should be fully responsible for any of your trading and investment decisions. The company will not be responsible for your capital loss.

          Without getting permission from the website, you are not allowed to copy the website's graphics, texts, or trademarks. Intellectual property rights in the content or data incorporated into this website belong to its providers and exchange merchants.

          Not Logged In

          Log in to access more features

          FastBull Membership

          Not yet

          Purchase

          Become a signal provider
          Help Center
          Customer Service
          Dark Mode
          Price Up/Down Colors

          Log In

          Sign Up

          Position
          Layout
          Fullscreen
          Default to Chart
          The chart page opens by default when you visit fastbull.com