• Trade
  • Markets
  • Copy
  • Contests
  • News
  • 24/7
  • Calendar
  • Q&A
  • Chats
Trending
Screeners
SYMBOL
LAST
BID
ASK
HIGH
LOW
NET CHG.
%CHG.
SPREAD
SPX
S&P 500 Index
6827.42
6827.42
6827.42
6899.86
6801.80
-73.58
-1.07%
--
DJI
Dow Jones Industrial Average
48458.04
48458.04
48458.04
48886.86
48334.10
-245.98
-0.51%
--
IXIC
NASDAQ Composite Index
23195.16
23195.16
23195.16
23554.89
23094.51
-398.69
-1.69%
--
USDX
US Dollar Index
97.950
98.030
97.950
98.500
97.950
-0.370
-0.38%
--
EURUSD
Euro / US Dollar
1.17394
1.17409
1.17394
1.17496
1.17192
+0.00011
+ 0.01%
--
GBPUSD
Pound Sterling / US Dollar
1.33707
1.33732
1.33707
1.33997
1.33419
-0.00148
-0.11%
--
XAUUSD
Gold / US Dollar
4299.39
4299.39
4299.39
4353.41
4257.10
+20.10
+ 0.47%
--
WTI
Light Sweet Crude Oil
57.233
57.485
57.233
58.011
56.969
-0.408
-0.71%
--

Community Accounts

Signal Accounts
--
Profit Accounts
--
Loss Accounts
--
View More

Become a signal provider

Sell trading signals to earn additional income

View More

Guide to Copy Trading

Get started with ease and confidence

View More

Signal Accounts for Members

All Signal Accounts

Best Return
  • Best Return
  • Best P/L
  • Best MDD
Past 1W
  • Past 1W
  • Past 1M
  • Past 1Y

All Contests

  • All
  • Trump Updates
  • Recommend
  • Stocks
  • Cryptocurrencies
  • Central Banks
  • Featured News
Top News Only
Share

USA Embassy In Lithuania: Maria Kalesnikava Is Not Going To Vilnius

Share

USA Embassy In Lithuania: Other Prisoners Are Being Sent From Belarus To Ukraine

Share

Ukraine President Zelenskiy: Five Ukrainians Released By Belarus In US-Brokered Deal

Share

USA Vilnius Embassy: USA Stands Ready For "Additional Engagement With Belarus That Advances USA Interests"

Share

USA Vilnius Embassy: Belarus, USA, Other Citizens Among The Prisoners Released Into Lithuania

Share

USA Vilnius Embassy: USA Will Continue Diplomatic Efforts To Free The Remaining Political Prisoners In Belarus

Share

USA Vilnius Embassy: Belarus Releases 123 Prisoners Following Meeting Of President Trump's Envoy Coale And Belarus President Lukashenko

Share

USA Vilnius Embassy: Masatoshi Nakanishi, Aliaksandr Syrytsa Are Among The Prisoners Released By Belarus

Share

USA Vilnius Embassy: Maria Kalesnikava And Viktor Babaryka Are Among The Prisoners Released By Belarus

Share

USA Vilnius Embassy: Nobel Peace Prize Laureate Ales Bialiatski Is Among The Prisoners Released By Belarus

Share

Belarusian Presidential Administration Telegram Channel: Lukashenko Has Pardoned 123 Prisoners As Part Of Deal With US

Share

Two Local Syrian Officials: Joint US-Syrian Military Patrol In Central Syria Came Under Fire From Unknown Assailants

Share

Israeli Military Says It Targeted 'Key Hamas Terrorist' In Gaza City

Share

Rwanda's Actions In Eastern Drc Are A Clear Violation Of Washington Accords Signed By President Trump - Secretary Of State Rubio

Share

Israeli Military Issues Evacuation Warning In Southern Lebanon Village Ahead Of Strike - Spokesperson On X

Share

Belarusian State Media Cites US Envoy Coale As Saying He Discussed Ukraine And Venezuela With Lukashenko

Share

Belarusian State Media Cites US Envoy Coale As Saying That US Removes Sanctions On Belarusian Potassium

Share

Thai Prime Minister: No Ceasefire Agreement With Cambodia

Share

US, Ukraine To Discuss Ceasefire In Berlin Ahead Of European Summit

Share

Incoming Czech Prime Minister Babis: Czech Republic Will Not Take On Guarantees For Ukraine Financing, European Commission Must Find Alternatives

TIME
ACT
FCST
PREV
U.K. Trade Balance Non-EU (SA) (Oct)

A:--

F: --

P: --

U.K. Trade Balance (Oct)

A:--

F: --

P: --

U.K. Services Index MoM

A:--

F: --

P: --

U.K. Construction Output MoM (SA) (Oct)

A:--

F: --

P: --

U.K. Industrial Output YoY (Oct)

A:--

F: --

P: --

U.K. Trade Balance (SA) (Oct)

A:--

F: --

P: --

U.K. Trade Balance EU (SA) (Oct)

A:--

F: --

P: --

U.K. Manufacturing Output YoY (Oct)

A:--

F: --

P: --

U.K. GDP MoM (Oct)

A:--

F: --

P: --

U.K. GDP YoY (SA) (Oct)

A:--

F: --

P: --

U.K. Industrial Output MoM (Oct)

A:--

F: --

P: --

U.K. Construction Output YoY (Oct)

A:--

F: --

P: --

France HICP Final MoM (Nov)

A:--

F: --

P: --

China, Mainland Outstanding Loans Growth YoY (Nov)

A:--

F: --

P: --

China, Mainland M2 Money Supply YoY (Nov)

A:--

F: --

P: --

China, Mainland M0 Money Supply YoY (Nov)

A:--

F: --

P: --

China, Mainland M1 Money Supply YoY (Nov)

A:--

F: --

P: --

India CPI YoY (Nov)

A:--

F: --

P: --

India Deposit Gowth YoY

A:--

F: --

P: --

Brazil Services Growth YoY (Oct)

A:--

F: --

P: --

Mexico Industrial Output YoY (Oct)

A:--

F: --

P: --

Russia Trade Balance (Oct)

A:--

F: --

P: --

Philadelphia Fed President Henry Paulson delivers a speech
Canada Building Permits MoM (SA) (Oct)

A:--

F: --

P: --

Canada Wholesale Sales YoY (Oct)

A:--

F: --

P: --

Canada Wholesale Inventory MoM (Oct)

A:--

F: --

P: --

Canada Wholesale Inventory YoY (Oct)

A:--

F: --

P: --

Canada Wholesale Sales MoM (SA) (Oct)

A:--

F: --

P: --

Germany Current Account (Not SA) (Oct)

A:--

F: --

P: --

U.S. Weekly Total Rig Count

A:--

F: --

P: --

U.S. Weekly Total Oil Rig Count

A:--

F: --

P: --

Japan Tankan Large Non-Manufacturing Diffusion Index (Q4)

--

F: --

P: --

Japan Tankan Small Manufacturing Outlook Index (Q4)

--

F: --

P: --

Japan Tankan Large Non-Manufacturing Outlook Index (Q4)

--

F: --

P: --

Japan Tankan Large Manufacturing Outlook Index (Q4)

--

F: --

P: --

Japan Tankan Small Manufacturing Diffusion Index (Q4)

--

F: --

P: --

Japan Tankan Large Manufacturing Diffusion Index (Q4)

--

F: --

P: --

Japan Tankan Large-Enterprise Capital Expenditure YoY (Q4)

--

F: --

P: --

U.K. Rightmove House Price Index YoY (Dec)

--

F: --

P: --

China, Mainland Industrial Output YoY (YTD) (Nov)

--

F: --

P: --

China, Mainland Urban Area Unemployment Rate (Nov)

--

F: --

P: --

Saudi Arabia CPI YoY (Nov)

--

F: --

P: --

Euro Zone Industrial Output YoY (Oct)

--

F: --

P: --

Euro Zone Industrial Output MoM (Oct)

--

F: --

P: --

Canada Existing Home Sales MoM (Nov)

--

F: --

P: --

Euro Zone Total Reserve Assets (Nov)

--

F: --

P: --

U.K. Inflation Rate Expectations

--

F: --

P: --

Canada National Economic Confidence Index

--

F: --

P: --

Canada New Housing Starts (Nov)

--

F: --

P: --

U.S. NY Fed Manufacturing Employment Index (Dec)

--

F: --

P: --

U.S. NY Fed Manufacturing Index (Dec)

--

F: --

P: --

Canada Core CPI YoY (Nov)

--

F: --

P: --

Canada Manufacturing Unfilled Orders MoM (Oct)

--

F: --

P: --

Canada Manufacturing New Orders MoM (Oct)

--

F: --

P: --

Canada Core CPI MoM (Nov)

--

F: --

P: --

Canada Manufacturing Inventory MoM (Oct)

--

F: --

P: --

Canada CPI YoY (Nov)

--

F: --

P: --

Canada CPI MoM (Nov)

--

F: --

P: --

Canada CPI YoY (SA) (Nov)

--

F: --

P: --

Canada Core CPI MoM (SA) (Nov)

--

F: --

P: --

Q&A with Experts
    • All
    • Chatrooms
    • Groups
    • Friends
    Connecting
    .
    .
    .
    Type here...
    Add Symbol or Code

      No matching data

      All
      Trump Updates
      Recommend
      Stocks
      Cryptocurrencies
      Central Banks
      Featured News
      • All
      • Russia-Ukraine Conflict
      • Middle East Flashpoint
      • All
      • Russia-Ukraine Conflict
      • Middle East Flashpoint
      Search
      Products

      Charts Free Forever

      Chats Q&A with Experts
      Screeners Economic Calendar Data Tools
      Membership Features
      Data Warehouse Market Trends Institutional Data Policy Rates Macro

      Market Trends

      Market Sentiment Order Book Forex Correlations

      Top Indicators

      Charts Free Forever
      Markets

      News

      News Analysis 24/7 Columns Education
      From Institutions From Analysts
      Topics Columnists

      Latest Views

      Latest Views

      Trending Topics

      Top Columnists

      Latest Update

      Signals

      Copy Rankings Latest Signals Become a signal provider AI Rating
      Contests
      Brokers

      Overview Brokers Assessment Rankings Regulators News Claims
      Broker listing Forex Brokers Comparison Tool Live Spread Comparison Scam
      Q&A Complaint Scam Alert Videos Tips to Detect Scam
      More

      Business
      Events
      Careers About Us Advertising Help Center

      White Label

      Data API

      Web Plug-ins

      Affiliate Program

      Awards Institution Evaluation IB Seminar Salon Event Exhibition
      Vietnam Thailand Singapore Dubai
      Fans Party Investment Sharing Session
      FastBull Summit BrokersView Expo
      Recent Searches
        Top Searches
          Markets
          News
          Analysis
          User
          24/7
          Economic Calendar
          Education
          Data
          • Names
          • Latest
          • Prev

          View All

          No data

          Scan to Download

          Faster Charts, Chat Faster!

          Download App
          English
          • English
          • Español
          • العربية
          • Bahasa Indonesia
          • Bahasa Melayu
          • Tiếng Việt
          • ภาษาไทย
          • Français
          • Italiano
          • Türkçe
          • Русский язык
          • 简中
          • 繁中
          Open Account
          Search
          Products
          Charts Free Forever
          Markets
          News
          Signals

          Copy Rankings Latest Signals Become a signal provider AI Rating
          Contests
          Brokers

          Overview Brokers Assessment Rankings Regulators News Claims
          Broker listing Forex Brokers Comparison Tool Live Spread Comparison Scam
          Q&A Complaint Scam Alert Videos Tips to Detect Scam
          More

          Business
          Events
          Careers About Us Advertising Help Center

          White Label

          Data API

          Web Plug-ins

          Affiliate Program

          Awards Institution Evaluation IB Seminar Salon Event Exhibition
          Vietnam Thailand Singapore Dubai
          Fans Party Investment Sharing Session
          FastBull Summit BrokersView Expo

          Trump Decision On Next Fed Chair Not Imminent, White House Says

          Owen Li

          Central Bank

          Summary:

          The White House said Donald Trump’s decision on a successor for Federal Reserve Chair Jerome Powell is not near, after the Wall

          The White House said Donald Trump’s decision on a successor for Federal Reserve Chair Jerome Powell is not near, after the Wall Street Journal reported the president could make a pick as soon as the summer.

          No decisions are imminent, although the president has the right to change his mind, a White House official said on Thursday. Trump has many good options to nominate as the next central bank chief, according to the official.

          The dollar fell and US Treasuries rallied after the paper reported that Trump has considered naming Powell’s replacement by September or October, citing anonymous sources. One unnamed person said Trump’s ire toward Powell could prompt an even earlier choice this summer.

          Earlier: Trump Says Three or Four People on List to Replace Fed’s Powell

          Powell’s term as chair does not expire until May 2026, and choosing a replacement that early would be unusual.

          Trump has repeatedly bashed the Fed chair over the bank’s position to hold interest rates steady, calling for cuts and arguing its policy is keeping US government borrowing costs high.

          Trump said Wednesday that he has “three or four people” on his list of potential replacements for Powell. Earlier this month, the president said he was considering nominees and that they would come out “very soon.”

          Recently, the president has intensified his personal criticisms of Powell. During a Wednesday press conference at the NATO summit, Trump called the bank chief “terrible” and an “average mentally person” with “low IQ.”

          Source: Bloomberg Europe

          Risk Warnings and Disclaimers
          You understand and acknowledge that there is a high degree of risk involved in trading. Following any strategies or investment methods may lead to potential losses. The content on the site is provided by our contributors and analysts for information purposes only. You are solely responsible for determining whether any trading assets, securities, strategy, or any other product is suitable for investing based on your own investment objectives and financial situation.
          Add to Favorites
          Share

          Nvidia stock keeps rising after fresh record as analyst sees AI 'golden wave'

          Adam

          Stocks

          Nvidia (NVDA) stock continued to tick higher Thursday, rising 1.1% in early trading after notching a record high above $154 the prior day.
          The gains come amid bullish predictions for the AI chip market on Wall Street.
          Loop Capital analyst Ananda Baruah on Wednesday raised his price target on Nvidia shares to $250, the highest of Wall Street analysts tracked by Yahoo Finance, implying that the AI chipmaker's market capitalization could soar to $6 trillion. Baruah expects the market for AI chips to grow to $2 trillion in 2028.
          Baruah said that "we are entering the next 'Golden Wave' of Gen AI adoption and NVDA is at the front-end of another material leg of stronger than anticipated demand." He cited emerging demand for AI chips from governments, commitments from Big Tech "hyperscalers," and the availability of Nvidia's latest Blackwell AI chips.
          "While it may seem fantastic that NVDA fundamentals can continue to amplify from current levels, we remind folks that NVDA remains essentially a monopoly for critical tech, and that it has pricing (and margin) power," he wrote.
          Bank of America analyst Vivek Arya wrote in his own note to investors Wednesday that he forecasts demand for AI chips reaching a more modest but still impressive $650 billion by 2030, up from $201 billion in 2025. Arya said Nvidia is set to be a "key beneficiary" as it's "still far ahead" of new entrants in the sector.
          In another bullish sign for Nvidia, Micron (MU), which supplies memory chips for Nvidia's GPUs in data centers, beat Wall Street's expectations for its third quarter earnings results Wednesday, with executives citing strength in its AI business amid robust AI data center growth during a call with analysts.
          To be sure, there has been investor skepticism over whether Big Tech can continue its torrid pace of investment in AI, as companies are still working out how to monetize the technology. That skepticism was amplified when a new cost-effective AI model from Chinese firm DeepSeek caught the world’s attention in January. News of DeepSeek’s latest AI model in January sent Nvidia shares plummeting at the end of that month.
          Before its high Wednesday, Nvidia last hit a record close of $149.43 on Jan. 6. Nvidia stock had struggled in the months following its record close in January with the emergence of DeepSeek and as President Trump embarked on his trade war, which included the enactment of a ban on sales of the company's chips to China.
          Shares have seen a big upswing since the company announced trade deals in the Middle East and reported its first quarter earnings in late May, which showed revenue beating Wall Street's expectations and the company continuing to thrive despite Trump's export ban on its chips for China.

          Source: finance.yahoo

          Risk Warnings and Disclaimers
          You understand and acknowledge that there is a high degree of risk involved in trading. Following any strategies or investment methods may lead to potential losses. The content on the site is provided by our contributors and analysts for information purposes only. You are solely responsible for determining whether any trading assets, securities, strategy, or any other product is suitable for investing based on your own investment objectives and financial situation.
          Add to Favorites
          Share

          3 Stocks Set to Gain as NATO Allies Commit to Boost Defense Spending

          Adam

          Stocks

          Economic

          At the NATO summit in The Hague, the alliance’s member states reached an agreement on a gradual increase in defense spending, with a target of 5%. This figure is to be broken down into 3.5% strictly for defense and 1.5% for other expenditures, including infrastructure development, research, and innovation. At this stage, only Spain is raising objections, diplomatically insisting on the 2% level—which, however, was met with a typical and incisive response from Donald Trump, who referred to the Spaniards as “stowaways.” Regardless, the target date for achieving this level is 2035, and it is certainly questionable whether all members will meet their commitments within the next decade. So we’ll take a look at companies with strong growth potential in the defense industry sector, which could benefit from increased arms expenditures.

          V2X Inc – More Than 20% Growth Potential

          V2X Inc (NYSE:VVX) is a defense-related company providing a wide range of services in areas such as radar systems, critical infrastructure defense, and multi-role aircraft. According to the fair value index, the company boasts more than 20% growth potential with a moderate financial condition.
          Significantly, the company has consistently reported positive net income for the past three quarters—something that has not been the norm in recent years. The latest results showed earnings per share of $0.98, beating the consensus by 5.1%. If we get a bullish technical signal in the form of a breakout above $52 per share, this will be an interesting company to consider from a buyer’s perspective.

          General Dynamics Corporation With an Impressive Fundamental Profile

          Another company on the list is General Dynamics Corporation (NYSE:GD), which specializes in building military sea and land systems. The upside potential is estimated at just over 12%, amid a continued moderate uptrend since around mid-February. What stands out is the company’s fundamental profile, which shows a full range of positive indicators.
          The company is also clearly attractive to dividend investors, as evidenced by its 47-year payout history and consistent dividend growth over the past decade. Since 2019, net income has remained stable, with a visible upward trend projected in 2024 and 2025.

          Lockheed Martin Corporation Pending a Technical Signal

          The last company on the list is Lockheed Martin Corporation (NYSE:LMT), a well-known American brand in the defense industry. As with the aforementioned competitors, the key positives include stable net profits and an upside potential of just under 14%. However, the technical chart remains important here, showing a prolonged consolidation since the beginning of the year, in the $420–490 per share range.
          3 Stocks Set to Gain as NATO Allies Commit to Boost Defense Spending_1
          If pressure on the upper boundary continues, we could see the formation of an ascending triangle pattern—a bullish chart formation—which could result in a breakout. In such a scenario, the minimum expectation would be an attempt to reach fair value slightly above $520 per share.

          Source :investing

          To stay updated on all economic events of today, please check out our Economic calendar
          Risk Warnings and Disclaimers
          You understand and acknowledge that there is a high degree of risk involved in trading. Following any strategies or investment methods may lead to potential losses. The content on the site is provided by our contributors and analysts for information purposes only. You are solely responsible for determining whether any trading assets, securities, strategy, or any other product is suitable for investing based on your own investment objectives and financial situation.
          Add to Favorites
          Share

          Dow, EUR/JPY rallies stall as US natural gas prices stabilise

          Adam

          Forex

          Commodity

          Having briefly traded in 4-month highs at 43,183, the Dow Jones Industrial Average is beginning to lose upside momentum as traders digest Federal Reserve (Fed) Chair Jerome Powell's remarks and look forward to US-Iran talks.
          ​While Wednesday's low at 42,871 holds, immediate upside pressure remains in play with a rise above this week's 43,183 high possibly engaging the late December high at 43,374.
          ​Were Wednesday's low at 42,871 to be slipped through, though, the 200-day simple moving average (SMA) at 42,551 may be revisited.
          ​Further potential support sits at the 5 June low at 42,212 and Monday's 41,981 low. Then there is minor support around the late May low at 41,828 and the 15 May low at 41,778.
          ​Critical support for the long-term uptrend remains to be seen at the 23 May low at 41,354, only a fall through which may lead to a much deeper correction taking place.
          Dow, EUR/JPY rallies stall as US natural gas prices stabilise_1
          EUR/JPY rally loses steam
          ​EUR/JPY's swift advance has taken it to ¥169.71, to within inches of its ¥169.99 mid-July 2024 low before losing upside momentum. Nonetheless the cross is on track for its fifth consecutive week of gains.
          ​A rise above the ¥169.71-to-¥169.99 resistance area would likely target the 3 June 2024 peak at ¥170.89.
          ​Minor support below Tuesday's ¥167.91 low can be spotted at the mid-June ¥167.61 high.
          ​While the next lower 19 June low at ¥166.04 holds, the medium-term uptrend is deemed to be intact.
          Dow, EUR/JPY rallies stall as US natural gas prices stabilise_2
          Natural gas futures stem their decline
          ​The recent sharp advance and swift decline in US Natural gas futures prices amid the Israel-Iran conflict has taken these close to their late May-to-June lows at 295.7-to--294.4. These levels offer support with the 200-day simple moving average (SMA) at 292.4.
          ​While the 295.7-to-292.4 support zone holds the 12 June high at 311.7 may be revisited. Further up the 5 May high at 316.0 may act as minor resistance ahead of the more significant late March low, May and early June highs at 321.4-to-327.5.​​
          Dow, EUR/JPY rallies stall as US natural gas prices stabilise_3

          Source: ig

          Risk Warnings and Disclaimers
          You understand and acknowledge that there is a high degree of risk involved in trading. Following any strategies or investment methods may lead to potential losses. The content on the site is provided by our contributors and analysts for information purposes only. You are solely responsible for determining whether any trading assets, securities, strategy, or any other product is suitable for investing based on your own investment objectives and financial situation.
          Add to Favorites
          Share

          US Labor Market Losing Steam; Economic Outlook Uncertain

          Devin

          Economic

          The number of Americans filing new applications for jobless benefits fell last week, but work opportunities are becoming scarce as businesses remain hesitant to hire because of an uncertain economic outlook, raising the risk of the unemployment rate increasing in June.

          The weekly jobless claims report from the Labor Department on Thursday, the most timely data on the economy's health, also showed state unemployment benefit rolls in mid-June increasing to the highest level in 3-1/2 years. Though layoffs remain historically low, hiring has been tepid, with economists saying President DonaldTrump'sbroad import tariffs are making it difficult for businesses to plan ahead.

          But the pace of labor market slowdown is unlikely to prompt the Federal Reserve to resume cutting interest rates before September, they said. Fed Chair Jerome Powell told lawmakers this week the U.S. central bank needed more time to gauge if tariffs raised inflation before considering lowering rates.

          "The data are consistent with softening of labor market conditions, particularly on the hiring side of the labor market equation," said Nancy Vanden Houten, lead economist at Oxford Economics. "For now, we don't think the labor market is weak enough to prompt the Fed to cut rates before December, but the risk is increasing that once the Fed starts to lower rates, it will have some catching up to do."

          Initial claims for state unemployment benefits dropped 10,000 to a seasonally adjusted 236,000 for the week ended June 21, the Labor Department said. Economists polled by Reuters had forecast 245,000 claims for the latest week.

          The data included last week's Juneteenth National Independence Day holiday, which likely injected a downward bias.

          Cutting through the technical distortions, layoffs have picked up amid the economic uncertainty that has seen the Fed pausing its monetary policy easing cycle. The U.S. central bank last week left its benchmark overnight interest rate in the 4.25%-4.50% range where it has been since December.

          The number of people receiving benefits after an initial week of aid, a proxy for hiring, jumped 37,000 to a seasonally adjusted 1.974 million during the week ending June 14, the highest level since November 2021, the claims report showed.

          The so-called continuing claims covered the week during which the government surveyed households for June's unemployment rate. Continuing claims increased between the May and June survey week, leading economists to expect that the unemployment rate rose to 4.3% in June from 4.2% in May.

          A survey from the Conference Board this week showed the share of consumers who viewed jobs as being "plentiful" dropped to the lowest level in more than four years in June.

          Stocks on Wall Street opened higher. The dollar slipped to a three-year low against a basket of currencies. U.S. Treasury yields fell.

          GDP REVISED LOWER

          The Trump administration's tariffs are distorting the economic picture and this was evident in other data on Thursday.

          Gross domestic product decreased at a downwardly revised 0.5% annualized rate last quarter, the Commerce Department's Bureau of Economic Analysis (BEA) said in its third estimate of GDP.

          Thomson ReutersUS gross domestic product

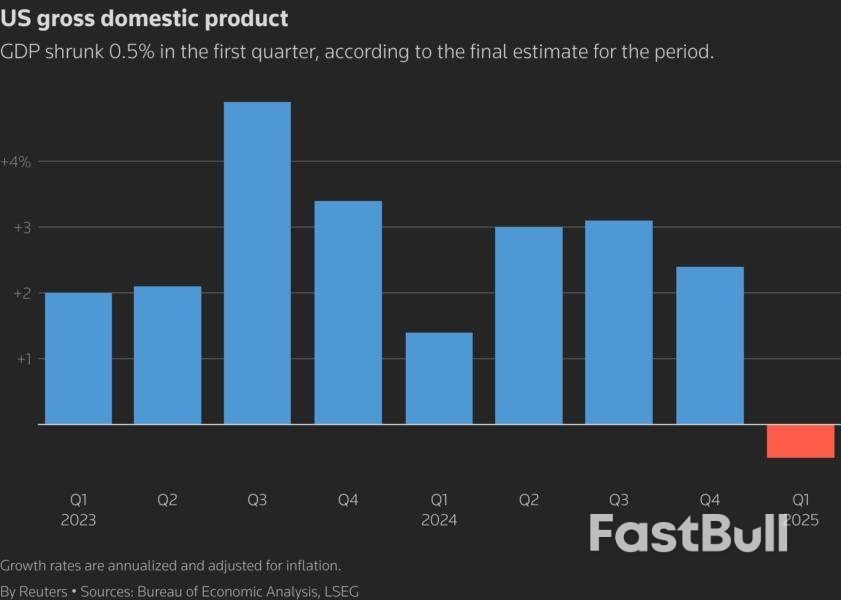
          The economy was previously reported to have contracted at a 0.2% pace. The revision reflected a sharp downgrade to consumer spending, which is now estimated to have increased at only a 0.5% pace instead of previously reported 1.2% rate.

          The economy grew at a 2.4% rate in the fourth quarter.

          Domestic demand growth was slashed to a 1.9% rate from the previously reported 2.5% pace.

          A flood of imports as businesses rushed to bring in goods before the sweeping tariffs kicked in accounted for the bulk of the decrease in GDP. Consumer spending also slowed as the boost from pre-emptive buying of goods, especially motor vehicles, ahead of the import duties faded.

          While the flow of imports has since subsided, exports are taking a hit from the trade tensions. A third report from the Census Bureau showed the goods trade deficit widened 11.1% to $96.6 billion in May, with exports dropping $9.7 billion to $179.2 billion. But goods imports were little changed at $275.8 billion, positioning GDP for a sharp rebound this quarter.

          The Atlanta Federal Reserve is forecasting GDP accelerating at a 3.4% rate in the second quarter. Given the gyrations from imports, economists cautioned against interpreting the anticipated bounce back in GDP as a sign of economic strength.

          Data on retail sales, the housing and labor markets have suggested economic activity is softening.

          "The difficulty of accurately capturing the extraordinary foreign-trade and inventory gymnastics that companies undertook to avoid U.S. tariffs created serious measurement challenges that will linger for some time to come," said Lou Crandall, chief economist at Wrightson ICAP.

          While a fourth report from the Census Bureau showed orders for long-lasting manufactured goods rebounded sharply in May because of strength in commercial aircraft bookings, the uncertain economic environment remained a constraint for business spending.

          Orders for durable goods, items ranging from toasters to aircraft meant to last three years or more, jumped 16.4% last month after a 6.6% decline in April. Transportation equipment orders soared 48.3%, driven by a 230.8% surge in commercial aircraft orders, which are extremely volatile.

          Boeingreported on its website that it had received 303 aircraft orders, including 150 from Qatar Airways placed during Trump's visit to the Gulf Arab country in May. That compared to only eight orders in April.

          Non-defense capital goods orders accelerated 49.4% after plunging 19.1% in April. Shipments of these goods were unchanged after advancing 3.6% in April.

          Outside the transportation industry, orders were moderate. Non-defense capital goods orders excluding aircraft, a closely watched proxy for business spending plans, rebounded 1.7% in May after a 1.4% decline in April. Shipments of core capital goods rose 0.5% after being unchanged in the prior month. Business spending on equipment accelerated sharply in the first quarter.

          Source: TradingView

          To stay updated on all economic events of today, please check out our Economic calendar
          Risk Warnings and Disclaimers
          You understand and acknowledge that there is a high degree of risk involved in trading. Following any strategies or investment methods may lead to potential losses. The content on the site is provided by our contributors and analysts for information purposes only. You are solely responsible for determining whether any trading assets, securities, strategy, or any other product is suitable for investing based on your own investment objectives and financial situation.
          Add to Favorites
          Share

          Bitcoin ETFs' 12-day net inflow streak nears $4 billion as BTC gains amid dollar slump

          Adam

          Cryptocurrency

          U.S. spot Bitcoin BTC +0.020% exchange-traded funds' net inflow streak extended into a twelfth day on Wednesday, adding $547.7 million to a total of $3.9 billion for the period, according to data compiled by The Block.
          BlackRock's IBIT continues to dominate over the other Bitcoin funds, attracting $340.3 million in net inflows on June 25 alone, followed by Fidelity's FBTC with $115.2 million. Ark Invest and 21Shares' ARKB, Bitwise's BITB, and VanEck's HODL brought in $70.2 million, $12.9 million, and $9.1 million, respectively. The other ETFs all registered zero flows for the day. IBIT also leads the twelve-day streak, accounting for over $3.3 billion or 86% of the net inflows.
          The Bitcoin ETF inflows have also ramped up over the last couple of days, adding more than $500 million on both Tuesday and Wednesday compared to an average of $276 million during the initial 10-day streak, despite significant price volatility amid the Middle East conflict.
          "Over a half billion into spot Bitcoin ETFs," The ETF Store President, Nate Geraci, posted on X. "12 straight days of inflows. Nearly $4 billion new $$$. Category now approaching *$50 billion* inflows since Jan 2024 launch. Absolutely ridiculous."
          Specifically, the U.S. spot Bitcoin ETFs have now picked up $48.4 billion worth of cumulative net inflows since their debut in January 2024, with nearly $125 billion in assets now under management amid the concurrent price rise, per The Block's Bitcoin ETF Tracker page.
          Meanwhile, the U.S. spot Ethereum ETFs also maintained momentum on Wednesday with $60.4 million worth of net inflows, again led by $55.2 million into BlackRock's ETHA fund, and extending their own positive streak to three days, totaling $232.4 million. Total net inflows for the Ethereum funds, which launched later in July 2024, currently stand at $4.2 billion.
          Dollar slump, weak growth outlook fuel bitcoin's rise as institutional tailwinds strengthen
          Bitcoin is currently trading for $107,445, according to The Block's BTC price page, up 0.8% over the last 24 hours and 2.9% during the past week. Having dropped back toward $98,000 on Sunday, bitcoin briefly surpassed the $108,000 level earlier again on Thursday, reinforced by macro tailwinds.
          "The U.S. Dollar Index's decline to its lowest level since March 2022 is creating a powerful tailwind for digital assets, reinforcing bitcoin's appeal as an alternative store of value," BRN Head of Research Timothy Misir told The Block. "This dollar weakness, combined with the World Bank's sharp downward revision of 2025 U.S. growth forecasts from 2.3% to 1.4%, signals potential economic headwinds that historically favor non-correlated assets like bitcoin."
          "Bitcoin's push above $108K on these sustained institutional flows and dollar weakness demonstrates remarkable resilience," Misir added. "With the federal government now openly discussing bitcoin accumulation and corporate adoption accelerating, we're witnessing the maturation of bitcoin as an institutional asset class. Combined with weakening dollar dynamics and growth concerns, these factors support continued upside momentum."
          Earlier this week, K33 Head of Research Vetle Lunde outlined why ETF flows continue to drive bitcoin's price, while treasury companies have a more muted impact.

          Source: theblock

          Risk Warnings and Disclaimers
          You understand and acknowledge that there is a high degree of risk involved in trading. Following any strategies or investment methods may lead to potential losses. The content on the site is provided by our contributors and analysts for information purposes only. You are solely responsible for determining whether any trading assets, securities, strategy, or any other product is suitable for investing based on your own investment objectives and financial situation.
          Add to Favorites
          Share

          Bitcoin Price Starts 'Normal and Healthy' Support Test as $108K Halts Bulls

          Warren Takunda

          Cryptocurrency

          Key points:
          Bitcoin order book liquidity remains a decisive force on low-timeframe BTC price action after a $108,000 grab.
          Whales show divergent behavior from smaller retail investors, choosing to up BTC exposure at current prices.
          A “normal and healthy” support retest is now on the cards, with the 50-day SMA of interest to buyers.
          Bitcoin cooled its upside at the June 25 Wall Street open as $108,000 became the key breakthrough level for bulls.Bitcoin Price Starts 'Normal and Healthy' Support Test as $108K Halts Bulls_1

          BTC/USD 1-hour chart. Source: Cointelegraph/TradingView

          BTC price gains paused as whales add exposure

          Data from Cointelegraph Markets Pro and TradingView showed BTC/USD returning to consolidation after a snap move to ten-day highs.
          Having taken liquidity to the upside, Bitcoin rested on a cloud of bids as sellers lined up closer to all-time highs, per data from monitoring resource CoinGlass.Bitcoin Price Starts 'Normal and Healthy' Support Test as $108K Halts Bulls_2

          BTC 24-hour liquidation heatmap. Source: CoinGlass

          Market participants themselves held divergent views of what might happen next, with smaller investors taking profit while whales and other major entities added exposure.
          “As $BTC attempts to reclaim $108K, the Accumulation Trend Score shows no unified cohort behavior,” onchain analytics firm Glassnode reported in part of ongoing analysis on X.
          “1–10 BTC wallets continue distributing, while 10–100 $BTC are net accumulators. Others show mixed signals, though the overall score has rebounded from 0.25 to 0.57.”

          Bitcoin Price Starts 'Normal and Healthy' Support Test as $108K Halts Bulls_3Bitcoin Trend Accumulation Score chart. Source: Glassnode/X

          Whale accumulation tends to imply faith in further gains to come among Bitcoin’s “smart money” cohort.
          Continuing, popular X commentator TheKingfisher identified $107,000 as a point where significant long liquidations should occur.Bitcoin Price Starts 'Normal and Healthy' Support Test as $108K Halts Bulls_4
          The day prior, trading resource Material Indicators revealed all order classes except smaller retail traders buying as the price rose.
          “FireCharts shows a small block of bid liquidity appearing in the order book to keep $BTC price elevated amidst nominal profit taking,” it told X followers, referencing one of its proprietary trading tools.
          “It is completely normal to see traders profit taking in this range while long term investors continue to HODL.”

          Bitcoin Price Starts 'Normal and Healthy' Support Test as $108K Halts Bulls_5BTC/USDT order book liquidity data as of June 25. Source: Material Indicators/X

          Bitcoin analyst sees $105,700 “buying opportunity”

          Material Indicators co-founder Keith Alan, meanwhile, observed what he described as a “normal and healthy” price retracement after the $108,000 run.
          “If price drops below the 50-Day SMA, I'll anticipate another flush to shakeout weak hands, and I'll look for my next buying opportunity,” he concluded, referring to Bitcoin’s 50-day simple moving average at around $105,700.
          An accompanying chart showed recent daily green “buy” and red “sell” signals on another trading tool.Bitcoin Price Starts 'Normal and Healthy' Support Test as $108K Halts Bulls_6

          BTC/USD 1-day chart. Source: Keith Alan/X

          Source: Cointelegraph

          Risk Warnings and Disclaimers
          You understand and acknowledge that there is a high degree of risk involved in trading. Following any strategies or investment methods may lead to potential losses. The content on the site is provided by our contributors and analysts for information purposes only. You are solely responsible for determining whether any trading assets, securities, strategy, or any other product is suitable for investing based on your own investment objectives and financial situation.
          Add to Favorites
          Share
          FastBull
          Copyright © 2025 FastBull Ltd

          728 RM B 7/F GEE LOK IND BLDG NO 34 HUNG TO RD KWUN TONG KLN HONG KONG

          TelegramInstagramTwitterfacebooklinkedin
          App Store Google Play Google Play
          Products
          Charts

          Chats

          Q&A with Experts
          Screeners
          Economic Calendar
          Data
          Tools
          Membership
          Features
          Function
          Markets
          Copy Trading
          Latest Signals
          Contests
          News
          Analysis
          24/7
          Columns
          Education
          Company
          Careers
          About Us
          Contact Us
          Advertising
          Help Center
          Feedback
          User Agreement
          Privacy Policy
          Business

          White Label

          Data API

          Web Plug-ins

          Poster Maker

          Affiliate Program

          Risk Disclosure

          The risk of loss in trading financial instruments such as stocks, FX, commodities, futures, bonds, ETFs and crypto can be substantial. You may sustain a total loss of the funds that you deposit with your broker. Therefore, you should carefully consider whether such trading is suitable for you in light of your circumstances and financial resources.

          No decision to invest should be made without thoroughly conducting due diligence by yourself or consulting with your financial advisors. Our web content might not suit you since we don't know your financial conditions and investment needs. Our financial information might have latency or contain inaccuracy, so you should be fully responsible for any of your trading and investment decisions. The company will not be responsible for your capital loss.

          Without getting permission from the website, you are not allowed to copy the website's graphics, texts, or trademarks. Intellectual property rights in the content or data incorporated into this website belong to its providers and exchange merchants.

          Not Logged In

          Log in to access more features

          FastBull Membership

          Not yet

          Purchase

          Become a signal provider
          Help Center
          Customer Service
          Dark Mode
          Price Up/Down Colors

          Log In

          Sign Up

          Position
          Layout
          Fullscreen
          Default to Chart
          The chart page opens by default when you visit fastbull.com