• Trade
  • Markets
  • Copy
  • Contests
  • News
  • 24/7
  • Calendar
  • Q&A
  • Chats
Trending
Screeners
SYMBOL
LAST
BID
ASK
HIGH
LOW
NET CHG.
%CHG.
SPREAD
SPX
S&P 500 Index
6845.73
6845.73
6845.73
6861.30
6845.73
+18.32
+ 0.27%
--
DJI
Dow Jones Industrial Average
48579.15
48579.15
48579.15
48679.14
48557.21
+121.11
+ 0.25%
--
IXIC
NASDAQ Composite Index
23251.49
23251.49
23251.49
23345.56
23251.49
+56.33
+ 0.24%
--
USDX
US Dollar Index
97.820
97.900
97.820
98.070
97.810
-0.130
-0.13%
--
EURUSD
Euro / US Dollar
1.17564
1.17571
1.17564
1.17596
1.17262
+0.00170
+ 0.14%
--
GBPUSD
Pound Sterling / US Dollar
1.33961
1.33970
1.33961
1.33970
1.33546
+0.00254
+ 0.19%
--
XAUUSD
Gold / US Dollar
4332.89
4333.30
4332.89
4350.16
4294.68
+33.50
+ 0.78%
--
WTI
Light Sweet Crude Oil
56.879
56.909
56.879
57.601
56.789
-0.354
-0.62%
--

Community Accounts

Signal Accounts
--
Profit Accounts
--
Loss Accounts
--
View More

Become a signal provider

Sell trading signals to earn additional income

View More

Guide to Copy Trading

Get started with ease and confidence

View More

Signal Accounts for Members

All Signal Accounts

Best Return
  • Best Return
  • Best P/L
  • Best MDD
Past 1W
  • Past 1W
  • Past 1M
  • Past 1Y

All Contests

  • All
  • Trump Updates
  • Recommend
  • Stocks
  • Cryptocurrencies
  • Central Banks
  • Featured News
Top News Only
Share

The Nasdaq Golden Dragon China Index Fell 0.9% In Early Trading

Share

The S&P 500 Opened 32.78 Points Higher, Or 0.48%, At 6860.19; The Dow Jones Industrial Average Opened 136.31 Points Higher, Or 0.28%, At 48594.36; And The Nasdaq Composite Opened 134.87 Points Higher, Or 0.58%, At 23330.04

Share

Miran: Goods Inflation Could Be Settling In At A Higher Level Than Was Normal Before The Pandemic, But That Will Be More Than Offset By Housing Disinflation

Share

Miran, Who Dissented In Favor Of A Larger Cut At Last Fed Meeting, Repeats Keeping Policy Too Tight Will Lead To Job Losses

Share

Miran: Does Not Think Higher Goods Inflation Is Mostly From Tariffs, But Acknowledges Does Not Have A Full Explanation For It

Share

Toronto Stock Index .GSPTSE Rises 67.16 Points, Or 0.21 Percent, To 31594.55 At Open

Share

Miran: Excluding Housing And Non-Market Based Items, Core Pce Inflation May Be Below 2.3%, “Within Noise” Of The Fed's 2% Target

Share

Polish State Assets Minister Balczun Says Jsw Needs Over USD 830 Million Financing To Keep Liquidity For A Year

Share

Miran: Prices Are “Once Again Stable” And Monetary Policy Should Reflect That

Share

Fed's Miran: Current Excess Inflation Is Not Reflective Of Underlying Supply And Demand In The Economy

Share

Portugal Treasury Puts 2026 Net Financing Needs At 13 Billion Euros, Up From 10.8 Billion In 2025

Share

Portugal Treasury Expects 2026 Net Financing Needs At 29.4 Billion Euros, Up From 25.8 Billion In 2025

Share

Bank Of America Says With Indonesia's Smelter Now Ramping Up, It Expects Aluminium Supply Growth To Accelerate To 2.6% Year On Year In 2026

Share

Bank Of America Expects A Deficit In Aluminium Next Year And Sees Prices Pushing Above $3000/T

Share

Fed Data - USA Effective Federal Funds Rate At 3.64 Percent On 12 December On $102 Billion In Trades Versus 3.64 Percent On $99 Billion On 11 December

Share

Brazil's Petrobras Says No Impact Seen On Oil, Petroleum Products Output As Workers Start Planned Strike

Share

Statement: US Travel Group Warns New Proposed Trump Administration Requirements For Foreign Tourists To Provide Social Media Histories Could Mean Millions Of People Opting Not To Visit

Share

Blackrock: Kerry White Will Become Head Of Citi Investment Management At Citi Wealth

Share

Blackrock: Rob Jasminski, Head Of Citi Investment Management, Has Joined With Team

Share

Blackrock: Effective Dec 15, Citi Investment Management Employees Will Join Blackrock

TIME
ACT
FCST
PREV
Japan Tankan Small Manufacturing Outlook Index (Q4)

A:--

F: --

P: --

Japan Tankan Large Non-Manufacturing Outlook Index (Q4)

A:--

F: --

P: --

Japan Tankan Large Manufacturing Outlook Index (Q4)

A:--

F: --

P: --

Japan Tankan Small Manufacturing Diffusion Index (Q4)

A:--

F: --

P: --

Japan Tankan Large Manufacturing Diffusion Index (Q4)

A:--

F: --

P: --

Japan Tankan Large-Enterprise Capital Expenditure YoY (Q4)

A:--

F: --

P: --

U.K. Rightmove House Price Index YoY (Dec)

A:--

F: --

P: --

China, Mainland Industrial Output YoY (YTD) (Nov)

A:--

F: --

P: --

China, Mainland Urban Area Unemployment Rate (Nov)

A:--

F: --

P: --

Saudi Arabia CPI YoY (Nov)

A:--

F: --

P: --

Euro Zone Industrial Output YoY (Oct)

A:--

F: --

P: --

Euro Zone Industrial Output MoM (Oct)

A:--

F: --

P: --

Canada Existing Home Sales MoM (Nov)

A:--

F: --

P: --

Canada National Economic Confidence Index

A:--

F: --

P: --

Canada New Housing Starts (Nov)

A:--

F: --

P: --
U.S. NY Fed Manufacturing Employment Index (Dec)

A:--

F: --

P: --

U.S. NY Fed Manufacturing Index (Dec)

A:--

F: --

P: --

Canada Core CPI YoY (Nov)

A:--

F: --

P: --

Canada Manufacturing Unfilled Orders MoM (Oct)

A:--

F: --

P: --

U.S. NY Fed Manufacturing Prices Received Index (Dec)

A:--

F: --

P: --

U.S. NY Fed Manufacturing New Orders Index (Dec)

A:--

F: --

P: --

Canada Manufacturing New Orders MoM (Oct)

A:--

F: --

P: --

Canada Core CPI MoM (Nov)

A:--

F: --

P: --

Canada Trimmed CPI YoY (SA) (Nov)

A:--

F: --

P: --

Canada Manufacturing Inventory MoM (Oct)

A:--

F: --

P: --

Canada CPI YoY (Nov)

A:--

F: --

P: --

Canada CPI MoM (Nov)

A:--

F: --

P: --

Canada CPI YoY (SA) (Nov)

A:--

F: --

P: --

Canada Core CPI MoM (SA) (Nov)

A:--

F: --

P: --

Canada CPI MoM (SA) (Nov)

A:--

F: --

P: --

Federal Reserve Board Governor Milan delivered a speech
U.S. NAHB Housing Market Index (Dec)

--

F: --

P: --

Australia Composite PMI Prelim (Dec)

--

F: --

P: --

Australia Services PMI Prelim (Dec)

--

F: --

P: --

Australia Manufacturing PMI Prelim (Dec)

--

F: --

P: --

Japan Manufacturing PMI Prelim (SA) (Dec)

--

F: --

P: --

U.K. 3-Month ILO Employment Change (Oct)

--

F: --

P: --

U.K. Unemployment Claimant Count (Nov)

--

F: --

P: --

U.K. Unemployment Rate (Nov)

--

F: --

P: --

U.K. 3-Month ILO Unemployment Rate (Oct)

--

F: --

P: --

U.K. Average Weekly Earnings (3-Month Average, Including Bonuses) YoY (Oct)

--

F: --

P: --

U.K. Average Weekly Earnings (3-Month Average, Excluding Bonuses) YoY (Oct)

--

F: --

P: --

France Services PMI Prelim (Dec)

--

F: --

P: --

France Composite PMI Prelim (SA) (Dec)

--

F: --

P: --

France Manufacturing PMI Prelim (Dec)

--

F: --

P: --

Germany Services PMI Prelim (SA) (Dec)

--

F: --

P: --

Germany Manufacturing PMI Prelim (SA) (Dec)

--

F: --

P: --

Germany Composite PMI Prelim (SA) (Dec)

--

F: --

P: --

Euro Zone Composite PMI Prelim (SA) (Dec)

--

F: --

P: --

Euro Zone Services PMI Prelim (SA) (Dec)

--

F: --

P: --

Euro Zone Manufacturing PMI Prelim (SA) (Dec)

--

F: --

P: --

U.K. Services PMI Prelim (Dec)

--

F: --

P: --

U.K. Manufacturing PMI Prelim (Dec)

--

F: --

P: --

U.K. Composite PMI Prelim (Dec)

--

F: --

P: --

Euro Zone ZEW Economic Sentiment Index (Dec)

--

F: --

P: --

Germany ZEW Current Conditions Index (Dec)

--

F: --

P: --

Germany ZEW Economic Sentiment Index (Dec)

--

F: --

P: --

Euro Zone Trade Balance (Not SA) (Oct)

--

F: --

P: --

Euro Zone ZEW Current Conditions Index (Dec)

--

F: --

P: --

Euro Zone Trade Balance (SA) (Oct)

--

F: --

P: --

U.S. Retail Sales MoM (Excl. Automobile) (SA) (Oct)

--

F: --

P: --

Q&A with Experts
    • All
    • Chatrooms
    • Groups
    • Friends
    Connecting
    .
    .
    .
    Type here...
    Add Symbol or Code

      No matching data

      All
      Trump Updates
      Recommend
      Stocks
      Cryptocurrencies
      Central Banks
      Featured News
      • All
      • Russia-Ukraine Conflict
      • Middle East Flashpoint
      • All
      • Russia-Ukraine Conflict
      • Middle East Flashpoint
      Search
      Products

      Charts Free Forever

      Chats Q&A with Experts
      Screeners Economic Calendar Data Tools
      Membership Features
      Data Warehouse Market Trends Institutional Data Policy Rates Macro

      Market Trends

      Market Sentiment Order Book Forex Correlations

      Top Indicators

      Charts Free Forever
      Markets

      News

      News Analysis 24/7 Columns Education
      From Institutions From Analysts
      Topics Columnists

      Latest Views

      Latest Views

      Trending Topics

      Top Columnists

      Latest Update

      Signals

      Copy Rankings Latest Signals Become a signal provider AI Rating
      Contests
      Brokers

      Overview Brokers Assessment Rankings Regulators News Claims
      Broker listing Forex Brokers Comparison Tool Live Spread Comparison Scam
      Q&A Complaint Scam Alert Videos Tips to Detect Scam
      More

      Business
      Events
      Careers About Us Advertising Help Center

      White Label

      Data API

      Web Plug-ins

      Affiliate Program

      Awards Institution Evaluation IB Seminar Salon Event Exhibition
      Vietnam Thailand Singapore Dubai
      Fans Party Investment Sharing Session
      FastBull Summit BrokersView Expo
      Recent Searches
        Top Searches
          Markets
          News
          Analysis
          User
          24/7
          Economic Calendar
          Education
          Data
          • Names
          • Latest
          • Prev

          View All

          No data

          Scan to Download

          Faster Charts, Chat Faster!

          Download App
          English
          • English
          • Español
          • العربية
          • Bahasa Indonesia
          • Bahasa Melayu
          • Tiếng Việt
          • ภาษาไทย
          • Français
          • Italiano
          • Türkçe
          • Русский язык
          • 简中
          • 繁中
          Open Account
          Search
          Products
          Charts Free Forever
          Markets
          News
          Signals

          Copy Rankings Latest Signals Become a signal provider AI Rating
          Contests
          Brokers

          Overview Brokers Assessment Rankings Regulators News Claims
          Broker listing Forex Brokers Comparison Tool Live Spread Comparison Scam
          Q&A Complaint Scam Alert Videos Tips to Detect Scam
          More

          Business
          Events
          Careers About Us Advertising Help Center

          White Label

          Data API

          Web Plug-ins

          Affiliate Program

          Awards Institution Evaluation IB Seminar Salon Event Exhibition
          Vietnam Thailand Singapore Dubai
          Fans Party Investment Sharing Session
          FastBull Summit BrokersView Expo

          Three U.S. Missile Destroyers Sail Toward Venezuela To Combat Narco-Terrorists

          Winkelmann

          Economic

          Political

          Summary:

          More details are emerging about President Trump's latest show of force in Latin America aimed at narco-terrorist cartels fueling America's drug crisis, which claims 100,000 lives a year.

          More details are emerging about President Trump's latest show of force in Latin America aimed at narco-terrorist cartels fueling America's drug crisis, which claims 100,000 lives a year. According to Reuters, three Aegis destroyers, surveillance aircraft, and an attack submarine are being deployed to international waters off Venezuela.

          Sources close to the media outlet say 4,000 sailors and Marines will support the large force projection mission that includes three U.S. Aegis guided-missile destroyers (USS Gravely, USS Jason Dunham, and USS Sampson), along with P-8 surveillance planes, other warships, and at least one attack submarine.

          The operation will run for several months and focus on enhancing hemispheric defense to dismantle narco-terrorist cartels' command and control nodes that funnel drugs into the U.S. Also, this force projection is a signal to Beijing to limit Chinese activity in the region, particularly around critical infrastructure and trade chokepoints. The Trump administration has put Mexico's Sinaloa Cartel and Venezuela's Tren de Aragua on notice, classifying them as foreign terrorist organizations. The broader understanding is that this is all a part of hemispheric defense.

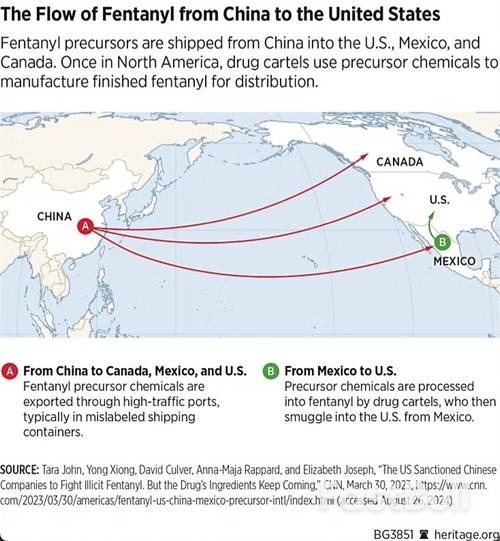
          Source: Heritage Foundation

          The deployment also signals to Venezuelan President Nicolas Maduro's government that Washington is not playing around. Maduro told the nation on Monday that his country will "defend our seas, our skies and our lands." He hinted at what he called "the outlandish, bizarre threat of a declining empire."

          On Tuesday, Mao Ning, a spokeswoman for the Chinese Foreign Ministry, said combating drugs is a shared responsibility around the world: "But we hope that major countries should play the role responsibly, maintain regional peace and stability, and properly handle the issue together with relevant countries."

          Source: Zero Hedge

          To stay updated on all economic events of today, please check out our Economic calendar
          Risk Warnings and Disclaimers
          You understand and acknowledge that there is a high degree of risk involved in trading. Following any strategies or investment methods may lead to potential losses. The content on the site is provided by our contributors and analysts for information purposes only. You are solely responsible for determining whether any trading assets, securities, strategy, or any other product is suitable for investing based on your own investment objectives and financial situation.
          Add to Favorites
          Share

          Nasdaq 100: Investors Eye Powell’s Jackson Hole Speech Amid Profit-Taking

          Adam

          Economic

          US equities took a hit on Tuesday, led by losses in the technology sector; the Nasdaq 100 slid 1.4% and the S&P 500 was down 0.6%. The pullback, in part, may be due to recent comments from OpenAI CEO Sam Altman, saying Artificial Intelligence (AI) is in a bubble.
          Still, I think the drop across risk assets is primarily due to investors’ profit-taking ahead of upcoming event risk, including today’s release of the minutes from the previous US Federal Reserve (Fed) meeting and the Jackson Hole Symposium, which kicks off tomorrow.
          Markets are largely expecting Fed Chair Jerome Powell to adopt a more dovish stance on Friday at the Symposium. The risk, therefore, is whether Powell reiterates his wait-and-see stance and essentially throws cold water on near-term easing.
          As I highlighted in the week-ahead preview, if Powell were to stick to his guns and suggest waiting for more clarity before advocating for a rate cut, you can expect a hawkish market response. This should benefit US Treasury yields along with the US dollar (USD), and weigh on Stocks.
          Fed Governor Michelle Bowman also hit the wires yesterday and doubled down on her dissent. Speaking to Bloomberg, Bowman said that ‘the story is out there’, and added that ‘she had not changed her views’.
          You may recall that both Bowman and Fed Governor Christopher Waller dissented at the previous Fed meeting, calling for a 25-basis point (bp) rate cut, which marked the first time since the 1980s that two Fed Governors dissented. She also brushed off speculation that she is in the running for the new Fed Chair spot.

          NZD and GBP in Focus in Early Trading

          In the FX space, the USD rose for a second consecutive day on Tuesday, up 0.2% according to the USD Index, and found acceptance north of the 50-day simple moving average at 98.07. The New Zealand dollar (NZD) is down versus G10 peers this morning, following the Reserve Bank of New Zealand (RBNZ) reducing its cash rate by 25 bps to 3.0%.
          Per the central bank’s updated forecasts, the RBNZ now projects higher inflation/unemployment along with lower economic activity, and scope for two additional rate cuts – one at the end of 2025 and another in early 2026. You will also see that the minutes show there were discussions of a 50-bp cut today!
          The British pound (GBP) was also in the spotlight earlier this morning, immediately catching a bid following the July UK CPI inflation data (Consumer Price Index). Headline YY inflation accelerated to 3.8%, largely driven by airfares, and bettered both the median estimate of 3.7% and June’s reading of 3.6%.
          YoY core inflation also edged higher by 3.8%, up from the 3.7% consensus/previous data, with the YY services print coming in at 5.0%, surpassing the 4.8% forecast and up from the 4.7% previous figure. While hotter-than-expected data could keep the Bank of England (BoE) at bay this year, we have to remember the central bank is expecting inflation to reach 4.0% in September. As you would expect, investors have pared rate-cut bets on the back of the latest inflation numbers.

          Spot Gold Testing The Lower Boundary Of Potential Weekly Pennant Pattern

          Across commodities, Spot Gold (XAU/USD), Spot Silver (XAG/USD), and WTI Oil (West Texas Intermediate) all explored deeper water yesterday, shedding 0.5%, 1.7%, and 0.9%, respectively. For any technical analysts reading, Gold is currently shaking hands with the lower boundary of a potential weekly bullish pennant pattern, extending from the low of US$3,120. What is interesting here is that price is now at the pattern’s apex, meaning a breakout could be imminent.
          Nasdaq 100: Investors Eye Powell’s Jackson Hole Speech Amid Profit-Taking_1

          Source: investing

          To stay updated on all economic events of today, please check out our Economic calendar
          Risk Warnings and Disclaimers
          You understand and acknowledge that there is a high degree of risk involved in trading. Following any strategies or investment methods may lead to potential losses. The content on the site is provided by our contributors and analysts for information purposes only. You are solely responsible for determining whether any trading assets, securities, strategy, or any other product is suitable for investing based on your own investment objectives and financial situation.
          Add to Favorites
          Share

          Bitcoin Analysts Point to ‘Manipulation’ as BTC Price Falls to 17-Day Low

          Warren Takunda

          Cryptocurrency

          Key points:
          Bitcoin heads back below $113,000 at the Wall Street open as bulls fail to clinch support.
          BTC price manipulation is one explanation for the downside, with exchange order-book bid liquidity in focus.
          More crypto market volatility is expected from the Federal Reserve’s Jackson Hole event.
          Bitcoin sought new local lows at Wednesday’s Wall Street open as bulls struggled to halt a repeat US sell-off.Bitcoin Analysts Point to ‘Manipulation’ as BTC Price Falls to 17-Day Low_1

          BTC/USD one-hour chart. Source: Cointelegraph/TradingView

          Bitcoin price pressure brings back “Spoofy the Whale”

          Data from Cointelegraph Markets Pro and TradingView followed BTC/USD as it sank below $113,000 after initially reclaiming it after the daily open.
          Bid liquidity was being taken on exchanges at the time of writing, with $112,300 now a level of interest, per data from CoinGlass.
          “$BTC Took out a bunch of liquidity on both sides for the past 6 weeks, as it ranged around this same price region,” popular trader Daan Crypto Trades summarized on liquidity conditions in his latest post on X.

          “The biggest cluster in close proximity now sits at around $120K and of course the local range low at $112K is still in play. Keep an eye out of those areas as they often act as local reversal zones and/or magnets when price gets close to them.”Bitcoin Analysts Point to ‘Manipulation’ as BTC Price Falls to 17-Day Low_2BTC liquidation heatmap. Source: CoinGlass

          Keith Alan, co-founder of trading resource Material Indicators, suggested that more bid liquidity appearing lower down the order book — including “plunge protection” at $105,000 — could be a form of price manipulation.
          Alan referred to entities for whom he coined the phrases “Spoofy the Whale” and the “Notorious B.I.D.” — both apt to artificially influence price action in recent months.
          “Too soon to make any assumptions, but the influence on price direction will be the same,” he concluded.

          “Bids moving lower invites price to move lower.”Bitcoin Analysts Point to ‘Manipulation’ as BTC Price Falls to 17-Day Low_3BTC/USDT order book liquidity with whale volume data. Source: Keith Alan/X

          Continuing, popular commentator TheKingfisher warned that Bitcoin could “bleed” further, which would have significant consequences for altcoins.
          “Altcoins currently show a balanced skew. We might see a minor retrace aimed at liquidating high-leverage shorts. Momentum remains steady,” part of an X post read on the day.

          “Still, we could see a gradual bleed, cascading block by block. While majors remain stable, a 5% BTC move could trigger 10–30% drops in alts.”Bitcoin Analysts Point to ‘Manipulation’ as BTC Price Falls to 17-Day Low_4Total altcoin market cap one-day chart. Source: Cointelegraph/TradingView

          A silver lining came from popular trader and analyst Rekt Capital, who compared current price action to previous bull-market corrections.
          “One of the most positive things about this current pullback is that this same type of retrace took place at this same moment in the cycle in both 2017 and 2021,” he told X followers.
          “In both 2017 and 2021, each of those retraces preceded upside to new All Time Highs.”

          All eyes on Fed’s Powell at Jackson Hole

          With the minutes of the US Federal Reserve’s July Federal Open Market Committee (FOMC) meeting due, trading firm QCP Capital looked to Friday’s speech by Chair Jerome Powell.
          Under heavy pressure to cut interest rates, Powell will take to the stage at the Fed’s annual Jackson Hole economic symposium.
          As Cointelegraph reported, last year saw Powell channel details about forthcoming rate cuts. His language will be watched by markets looking for confirmation that September’s meeting will yield that outcome.
          “The stakes are high: setting the path of monetary policy as markets balance easing inflation against rising labour risks,” QCP wrote in its latest “Asia Color” update on Wednesday.

          “Markets are currently pricing an 80–95 % probability of a 25‑basis‑point cut at the 17 Sep FOMC, yet incoming data could shift expectations quickly.”Bitcoin Analysts Point to ‘Manipulation’ as BTC Price Falls to 17-Day Low_5Fed target rate probabilities for September FOMC meeting (screenshot). Source: CME Group FedWatch Tool

          Source: Cointelegraph

          Risk Warnings and Disclaimers
          You understand and acknowledge that there is a high degree of risk involved in trading. Following any strategies or investment methods may lead to potential losses. The content on the site is provided by our contributors and analysts for information purposes only. You are solely responsible for determining whether any trading assets, securities, strategy, or any other product is suitable for investing based on your own investment objectives and financial situation.
          Add to Favorites
          Share

          Natural Gas and Oil Forecast: OPEC+ Output and Sanction Risks Keep Markets Fragile

          Adam

          Commodity

          Market Overview

          Oil and natural gas prices steadied midweek, with WTI crude climbing above $62 per barrel after U.S. inventories fell 2.4 million barrels, nearly double expectations. The draw signals resilient demand, yet gains remain limited as geopolitical tensions cloud the outlook.
          Energy traders weigh the prospect of shifting global supply flows, including stronger Russian exports and higher OPEC+ output, which have pressured crude to a three-month low, down over 10% this month.
          With uncertainty surrounding global negotiations and sanctions enforcement, both oil and gas markets face a fragile balance between supply risks and demand resilience.

          Natural Gas Price Forecast

          Natural Gas and Oil Forecast: OPEC+ Output and Sanction Risks Keep Markets Fragile_1Natural Gas (NG) Price Chart

          Natural gas futures are trading at $2.75, holding near short-term support at $2.73 after failing to sustain momentum above $2.88. The broader trend remains pressured by a descending trendline, keeping upside capped below the 50-EMA ($2.83) and 100-EMA ($2.88).
          If price breaks lower, the next downside targets stand at $2.67 and $2.61. On the other hand, a rebound above $2.80–2.83 could open the way for a retest of $2.95.
          The RSI at 36.3 signals weak momentum, leaning toward continued selling pressure unless buyers step in around current support. Until a clear break above the descending trendline, the market remains vulnerable to further downside extension.

          WTI Oil Price Forecast

          Natural Gas and Oil Forecast: OPEC+ Output and Sanction Risks Keep Markets Fragile_2WTI Price Chart

          WTI crude oil is trading at $62.47, showing early signs of stabilization after testing the $61.55 support zone. Price action remains capped by a descending trendline, aligning closely with the 50-EMA ($62.57) and 100-EMA ($63.24), reinforcing overhead resistance.
          A decisive close above these levels could open the way toward $64.14 and $65.12, while failure to clear may extend the downtrend. On the downside, a break under $61.55 exposes $60.72 and potentially $59.91.
          Momentum indicators show improving sentiment, with the RSI recovering to 54, suggesting buyers are attempting to regain control. For now, the structure favors a cautious watch for a confirmed breakout rather than premature positioning.

          Brent Oil Price Forecast

          Natural Gas and Oil Forecast: OPEC+ Output and Sanction Risks Keep Markets Fragile_3Brent Price Chart

          Brent crude is trading at $66.44, attempting to break above a descending trendline that has capped upside momentum since early August. Price is consolidating within a symmetrical triangle, with immediate resistance at $66.58 (100-EMA) and a stronger ceiling at $67.15.
          A confirmed breakout above these levels could pave the way toward $68.15 and $69.14. On the downside, support rests at $65.30, followed by $64.61 if pressure builds. Momentum is improving, with the RSI at 58.4, suggesting growing bullish interest after a prolonged consolidation.
          Until price clears the triangle’s upper boundary with volume, the market remains range-bound, favoring reactive trading strategies around support and resistance zones.

          Source: fxempire

          Risk Warnings and Disclaimers
          You understand and acknowledge that there is a high degree of risk involved in trading. Following any strategies or investment methods may lead to potential losses. The content on the site is provided by our contributors and analysts for information purposes only. You are solely responsible for determining whether any trading assets, securities, strategy, or any other product is suitable for investing based on your own investment objectives and financial situation.
          Add to Favorites
          Share

          Crude Inventories Drop By 6 Million Barrels; WTI Oil Tests The $62.50 Level

          Dark Current

          Economic

          Commodity

          Key Points:

          ●Strategic Petroleum Reserve increased from 403.2 million barrels to 403.4 million barrels.
          ●Domestic oil production grew from 13.327 million bpd to 13.382 million bpd.
          ●WTI oil was mostly flat as traders reacted to the EIA report.

          On August 20, 2025, EIA released its Weekly Petroleum Status Report. The report indicated that crude inventories decreased by -6 million barrels from the previous week, compared to analyst consensus of -1.3 million barrels. At current levels, crude inventories are about 6% below the five-year average for this time of the year.

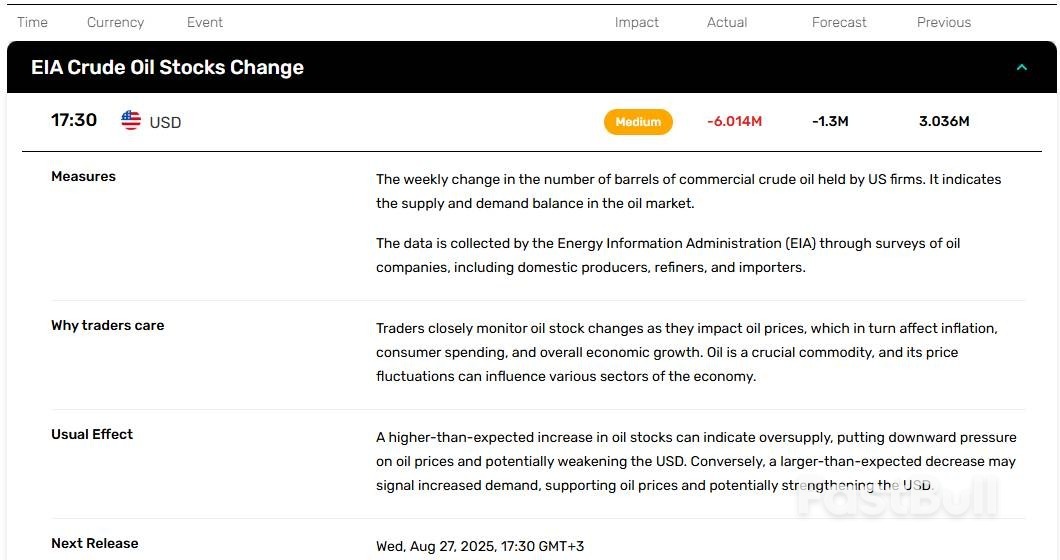
          Gasoline inventories declined by -2.7 million barrels, compared to analyst forecast of -0.8 million barrels. Distillate fuel inventories increased by +2.3 million barrels from the previous week.

          Crude oil imports declined by 423,000 bpd, averaging 6.5 million bpd. Over the past four weeks, crude oil imports averaged 6.4 million bpd.

          Strategic Petroleum Reserve increased from 403.2 million barrels to 403.4 million barrels. The SPR continues to grow at a slow pace.

          Domestic oil production increased from 13.327 million bpd to 13.382 million bpd. From a big picture point of view, domestic oil production stabilized after recent pullback.

          WTI oil was mostly flat after the release of the EIA report. Currently, WTI oil is trying to settle above the $62.50 level.

          Brent oil made an attempt to settle above the $66.50 level as traders reacted to the report. Falling crude inventories may provide some support to oil markets, although traders remain worried about oversupply due to rising production from OPEC+ countries.

          Source: FX Empire

          To stay updated on all economic events of today, please check out our Economic calendar
          Risk Warnings and Disclaimers
          You understand and acknowledge that there is a high degree of risk involved in trading. Following any strategies or investment methods may lead to potential losses. The content on the site is provided by our contributors and analysts for information purposes only. You are solely responsible for determining whether any trading assets, securities, strategy, or any other product is suitable for investing based on your own investment objectives and financial situation.
          Add to Favorites
          Share

          S&P 500: Is a Bear Market Even Possible?

          Adam

          Economic

          My broader view on the S&P500 (SPX) is that we are coming to the conclusion of a rally, which can represent a major long-term top in the United States equity market. This would conclude an almost 100-year bull market which began at the bottom of the market crash of 1929. In fact, this could usher in a bear market that would rival the one seen in Japan, which lasted for well over a decade.
          Not only has this market has done a phenomenal job of convincing investors that such a scenario is impossible, but it has attracted new investors with thoughts of constant profits since the market has "always come back” in a Pavlovian manner. This will likely be a bane to the average investor once the bear market begins.
          French writer Jean-Baptiste Alphonse Karr seems to be the first person quoted (in 1849) as proclaiming that “the more things change, the more they stay the same.” As I am sure many understand, he was providing insight into the fact that, while events and circumstances may seem to change in our “modern” era, the underlying driver of human sentiment does not. This truly encapsulates how our financial markets work.
          Currently, we are hearing how “this time is different” again. Most analysts are pointing towards AI as the reason for this newly found and ubiquitous confidence in the stock market. But, anyone who has traded or invested in the stock market for more than a decade or two knows quite well how fallacious this perspective to be.
          So, while many of these newly minted bulls are certain of this market’s infallibility, on my travels this summer through Europe and the United States, I cannot tell you how many people have told me that their children in their teenage years or their early 20’s have taken up trading, because, as their children have put it, “it is so easy to make money.”
          Yet, analysts are really not much different. The only real difference is they try to come up with “reasoning” for what their hearts tell them to do. As Ben Franklin astutely noted, “so convenient a thing it is to be a reasonable creature, since it enables one to find or to make a reason for everything one has a mind to do.”
          So, as I have read a number of missives of late which explain why this market has so much higher to go, many of these analysts seem to be basing their expectations on earnings. So, I am going to take a moment to comment on some of their analysis. One author started with the following premise:
          “You see, great investors aren’t focused on the moment. They’re trying to discern what the environment will look like a year down the road.” All this statement did was make me wonder if he truly believed that investors are omniscient or clairvoyant? But, I digress. Let’s get to the heart of their “reasoning.”
          Most of these investors claim that companies are beating their earnings estimates this year. And, they go on to explain that, based upon these earnings estimates, the market should be heading to 7000 (or higher) by the end of the year.
          While it is possible and they may be right about the market having much further to go, I do not think it is probable. Nor do I think that following earnings in a linear manner is an appropriate way to prognosticate the stock market.
          First, anyone who has been involved in markets long enough knows quite well that the earnings season is nothing more than a game. Analysts will often lower expectations right before earnings so that the reported earnings can easily beat those expectations.
          Second, I do not believe utilizing earnings in a linear fashion to project stock market targets, as is done by most analysts, is an accurate manner to prognosticate the market, especially at the major turns.
          While I know many of you may not want to read that full article, I do want to quote certain pertinent items to drive home my point. Finance professor Robert Olson published an article in 1996 in the Financial Analysts Journal in which he presented the conclusions of his study of 4000 corporate earnings estimates by company analysts:
          “Experts’ earnings predictions exhibit positive bias and disappointing accuracy. These shortcomings are usually attributed to some combination of incomplete knowledge, incompetence, and/or misrepresentation. This article suggests that the human desire for consensus leads to herding behavior among earnings forecasters.”
          In Daniel Crosby’s book The Behavioral Investor, he noted the following:
          “Contrarian investor David Dreman found that most (59%) of Wall Street consensus forecasts miss their targets by gaps so large as to make the results unusable – either undershooting or overshooting the actual number by more than 15%. Further analysis by Dreman found that from 1973-1993, the nearly 80,000 estimates he looked at had a mere 1 in 170 chance of being within 5% of the actual number.
          "James Montier sheds some light on the difficulty of forecasting in his “Little Book of Behavioral Investing.” In 2000, the average target price of stocks was 37% above market price and they ended up 16%. In 2008, the average forecast was a 28% increase and the market fell 40%. Between 2000 and 2008, analysts failed to even get the direction right in four out of the nine years.
          "Finally, Michael Sandretto of Harvard and Sudhir Milkrishnamurthi of MIT looked at the one-year forecasts of 1000 companies covered most widely by analysts. They found that analysts were consistently inconsistent, missing the market by an annual rate of 31.3% on average.”
          So, considering the game that analysts play each earnings season, as well as the facts brought to light by these various studies (and, yes, there are many more such studies), do we really believe that projecting earnings linearly into the future is going to “discern what the environment will look like a year down the road?”
          I think not.
          So, again, while these analysts may be right that we rally into the end of the year in a linear fashion to 7000 or higher, I do not believe this to be probable. Nor do I believe that this time is different. Human nature has not changed in a millennia, and it is human nature which drives financial market prices.
          And, no linear analysis will ever be able to determine when human nature will decide to change direction, as linear analysis only presupposes that the current trend continues unabated. How did that work out in 2007 or in early 2020?
          While the market has certainly exceeded my expectations based upon the standards we apply, I will not attempt to justify it based upon reasoning. And, why would I? If the market is driven by emotion, why would I attempt to reason within an emotional environment? This is akin to attempting to reason with your spouse while they are being emotional. How well does that work for you?
          Rather, when I see a market that has not seen more than a .236 retracement since mid-April, it tells me that the extreme madness of the crowds has taken over, and the market is likely very stretched to the upside. So, we need to seek out clues as to when the crowd eventually runs out of room.
          In conclusion, while some of you may have viewed me of late as a perma-bear, I can assure you that is not the case. I do not know any perma-bears who were going aggressively long at the bottom of the Covid crash or in October of 2022, or near the bottom of the April 2025 decline.
          Rather, I am viewing this market rally with a healthy dose of concern, as the much longer-term pattern off not just the 2008 low, but off the 1931 low seems to be coming to a conclusion. Therefore, I will continue to approach the market with that healthy dose of concern and caution in all my analysis, as well as a large cash position in my own accounts. Please recognize this when reading my analysis.
          S&P 500: Is a Bear Market Even Possible?_1

          Source: investing

          To stay updated on all economic events of today, please check out our Economic calendar
          Risk Warnings and Disclaimers
          You understand and acknowledge that there is a high degree of risk involved in trading. Following any strategies or investment methods may lead to potential losses. The content on the site is provided by our contributors and analysts for information purposes only. You are solely responsible for determining whether any trading assets, securities, strategy, or any other product is suitable for investing based on your own investment objectives and financial situation.
          Add to Favorites
          Share

          Trump Demands Fed's Cook Resign After Pulte Calls For 'mortgage Fraud' Probe

          Thomas

          Central Bank

          FILE PHOTO: Lisa DeNell Cook, nominee to be a member of the Board of Governors of the Federal Reserve System, testifies during a Senate Banking nominations hearing on June 21, 2023 in Washington, DC.

          President Donald Trump on Wednesday demanded that Federal Reserve Governor Lisa Cook resign after a U.S. housing agency chief called on the Department of Justice to launch a criminal mortgage fraud investigation into the central bank official.

          "Cook must resign, now!!!" Trump wrote in a Truth Social post that linked to a Bloomberg report on the allegations that Bill Pulte, director of the Federal Housing Finance Agency, has lodged against Cook.

          The Fed declined CNBC's request for comment on Pulte's claims and Trump's reaction.

          It's the latest example of the Trump administration airing allegations of mortgage-related wrongdoing against the president's opponents. The Justice Department is investigating Sen. Adam Schiff, D-Calif., and New York Attorney General Letitia James on similar grounds.

          The remarks also show Trump expanding his attacks on the Fed beyond its chairman, Jerome Powell, as he pressures the central bank to slash interest rates.

          Cook, who was nominated by former President Joe Biden in 2022, voted with the majority on the Federal Open Market Committee to keep rates unchanged after the group's latest meeting last month.

          Pulte, an aggressive critic of Powell, wrote in the letter dated Aug. 15 that mortgage documents obtained by FHFA appear to show Cook "falsified bank documents and property records to acquire more favorable loan terms, potentially committing mortgage fraud."

          He accused Cook of "falsifying residence statuses" for a residence in Ann Arbor, Michigan, and a property in Atlanta, Georgia "in order to potentially secure lower interest rates and more favorable loan terms."

          For both properties, Cook "appears to have acquired mortgages that do not meet certain lending requirements and could have received favorable loan terms under fraudulent circumstances," Pulte alleged.

          Source: CNBC

          Risk Warnings and Disclaimers
          You understand and acknowledge that there is a high degree of risk involved in trading. Following any strategies or investment methods may lead to potential losses. The content on the site is provided by our contributors and analysts for information purposes only. You are solely responsible for determining whether any trading assets, securities, strategy, or any other product is suitable for investing based on your own investment objectives and financial situation.
          Add to Favorites
          Share
          FastBull
          Copyright © 2025 FastBull Ltd

          728 RM B 7/F GEE LOK IND BLDG NO 34 HUNG TO RD KWUN TONG KLN HONG KONG

          TelegramInstagramTwitterfacebooklinkedin
          App Store Google Play Google Play
          Products
          Charts

          Chats

          Q&A with Experts
          Screeners
          Economic Calendar
          Data
          Tools
          Membership
          Features
          Function
          Markets
          Copy Trading
          Latest Signals
          Contests
          News
          Analysis
          24/7
          Columns
          Education
          Company
          Careers
          About Us
          Contact Us
          Advertising
          Help Center
          Feedback
          User Agreement
          Privacy Policy
          Business

          White Label

          Data API

          Web Plug-ins

          Poster Maker

          Affiliate Program

          Risk Disclosure

          The risk of loss in trading financial instruments such as stocks, FX, commodities, futures, bonds, ETFs and crypto can be substantial. You may sustain a total loss of the funds that you deposit with your broker. Therefore, you should carefully consider whether such trading is suitable for you in light of your circumstances and financial resources.

          No decision to invest should be made without thoroughly conducting due diligence by yourself or consulting with your financial advisors. Our web content might not suit you since we don't know your financial conditions and investment needs. Our financial information might have latency or contain inaccuracy, so you should be fully responsible for any of your trading and investment decisions. The company will not be responsible for your capital loss.

          Without getting permission from the website, you are not allowed to copy the website's graphics, texts, or trademarks. Intellectual property rights in the content or data incorporated into this website belong to its providers and exchange merchants.

          Not Logged In

          Log in to access more features

          FastBull Membership

          Not yet

          Purchase

          Become a signal provider
          Help Center
          Customer Service
          Dark Mode
          Price Up/Down Colors

          Log In

          Sign Up

          Position
          Layout
          Fullscreen
          Default to Chart
          The chart page opens by default when you visit fastbull.com