• Trade
  • Markets
  • Copy
  • Contests
  • News
  • 24/7
  • Calendar
  • Q&A
  • Chats
Screeners
SYMBOL
LAST
ASK
BID
HIGH
LOW
NET CHG.
%CHG.
SPREAD
SPX
S&P 500 Index
6969.02
6969.02
6969.02
6992.83
6870.81
-9.01
-0.13%
--
DJI
Dow Jones Industrial Average
49071.55
49071.55
49071.55
49292.81
48597.22
+55.96
+ 0.11%
--
IXIC
NASDAQ Composite Index
23685.11
23685.11
23685.11
23840.55
23232.78
-172.33
-0.72%
--
USDX
US Dollar Index
96.300
96.380
96.300
96.590
96.240
+0.330
+ 0.34%
--
EURUSD
Euro / US Dollar
1.19373
1.19380
1.19373
1.19743
1.18947
-0.00329
-0.27%
--
GBPUSD
Pound Sterling / US Dollar
1.37665
1.37676
1.37665
1.38142
1.37248
-0.00428
-0.31%
--
XAUUSD
Gold / US Dollar
5102.83
5103.17
5102.83
5450.83
4941.85
-273.48
-5.09%
--
WTI
Light Sweet Crude Oil
64.429
64.459
64.429
65.611
63.409
-0.823
-1.26%
--

Community Accounts

Signal Accounts
--
Profit Accounts
--
Loss Accounts
--
View More

Become a signal provider

Sell trading signals to earn additional income

View More

Guide to Copy Trading

Get started with ease and confidence

View More

Signal Accounts for Members

All Signal Accounts

Best Return
  • Best Return
  • Best P/L
  • Best MDD
Past 1W
  • Past 1W
  • Past 1M
  • Past 1Y

All Contests

  • All
  • Trump Updates
  • Recommend
  • Stocks
  • Cryptocurrencies
  • Central Banks
  • Featured News
Top News Only
Share

Turkish Foreign Minister: We Hope Solution Can Be Found To Avoid Conflict And Isolation Of Iran

Share

Turkish Foreign Minister: Spoke With USA Envoy Witkoff On Thursday, Will Continue Speaking To USA Officials On Iran

Share

Iran's Araqchi Says Tehran Wants Unity And Peace In Syria

Share

Iran's Araqchi Says Tehran Welcomes Talks With Regional Countries That Aims At Bringing Stability And Peace

Share

Iran's Araqchi Says Any Talks Should Be Fair, And Based On Mutual Respect

Share

Istanbul - Iran's Foreign Minister Araqchi Says Tehran 'Is Prepared For Resumption Of Talks With The US'

Share

India's Forex Reserves Rise To $709.41 Billion As Of Jan 23

Share

Israeli Cogat Agency: Gaza's Rafah Crossing With Egypt To Reopen On Sunday

Share

Istanbul - Iran's Foreign Minister Araqchi: Talks With His Turkish Counterpart Fidan Was Very 'Good And Useful'

Share

Turkish Foreign Minister: Turkey Closely Following Integration Agreement Between Damascus-Sdf In Syria

Share

Turkish Foreign Minister: We Hope US Will Not Attack Iran

Share

Turkish Foreign Minister: We See Israel Is Trying To Convince US To Militarily Attack Iran

Share

Turkish Foreign Minister: Turkey Calling On US, Iran To Come To Negotiating Table To Resolve Issues

Share

Turkish Foreign Minister: Turkey Opposes Foreign Intervention On Iran, We Tell Our Counterparts This

Share

Philippine Central Bank: January 2026 Inflation To Be Within Range Of 1.4 To 2.2 Percent

Share

Turkish Foreign Minister: Iran's Peace And Stability Important For US, Turkey Saddened By Deaths During Protests

Share

Chevron: Continue To Engage With The USA And Venezuelan Governments To Advance Shared Energy Goals

Share

ICE London Cocoa Falls More Than 6% To 2728 Pounds A Metric Ton

Share

ICE New York Cocoa Falls Nearly 6% To $3931 A Metric Ton

Share

Ukraine President Zelenskiy: Russian Strike Damaged USA Company Production Site In Kharkiv

TIME
ACT
FCST
PREV
Japan Tokyo CPI YoY (Excl. Food & Energy) (Jan)

A:--

F: --

P: --

Japan Retail Sales YoY (Dec)

A:--

F: --

P: --
Japan Industrial Inventory MoM (Dec)

A:--

F: --

P: --

Japan Retail Sales (Dec)

A:--

F: --

P: --

Japan Retail Sales MoM (SA) (Dec)

A:--

F: --

P: --
Japan Large-Scale Retail Sales YoY (Dec)

A:--

F: --

P: --

Japan Industrial Output Prelim MoM (Dec)

A:--

F: --

P: --

Japan Industrial Output Prelim YoY (Dec)

A:--

F: --

P: --

Australia PPI YoY (Q4)

A:--

F: --

P: --

Australia PPI QoQ (Q4)

A:--

F: --

P: --

Japan Construction Orders YoY (Dec)

A:--

F: --

P: --

Japan New Housing Starts YoY (Dec)

A:--

F: --

P: --

France GDP Prelim YoY (SA) (Q4)

A:--

F: --

P: --

Turkey Trade Balance (Dec)

A:--

F: --

P: --

France PPI MoM (Dec)

A:--

F: --

P: --
Germany Unemployment Rate (SA) (Jan)

A:--

F: --

P: --

Germany GDP Prelim YoY (Not SA) (Q4)

A:--

F: --

P: --

Germany GDP Prelim QoQ (SA) (Q4)

A:--

F: --

P: --

Germany GDP Prelim YoY (Working-day Adjusted) (Q4)

A:--

F: --

P: --

Italy GDP Prelim YoY (SA) (Q4)

A:--

F: --

P: --

U.K. M4 Money Supply (SA) (Dec)

A:--

F: --

P: --
U.K. M4 Money Supply YoY (Dec)

A:--

F: --

P: --

U.K. M4 Money Supply MoM (Dec)

A:--

F: --

P: --

U.K. Mortgage Lending (Dec)

A:--

F: --

P: --
U.K. Mortgage Approvals (Dec)

A:--

F: --

P: --
Italy Unemployment Rate (SA) (Dec)

A:--

F: --

P: --

Euro Zone Unemployment Rate (Dec)

A:--

F: --

P: --

Euro Zone GDP Prelim QoQ (SA) (Q4)

A:--

F: --

P: --

Euro Zone GDP Prelim YoY (SA) (Q4)

A:--

F: --

P: --

Italy PPI YoY (Dec)

A:--

F: --

P: --

Mexico GDP Prelim YoY (Q4)

--

F: --

P: --

Brazil Unemployment Rate (Dec)

--

F: --

P: --

South Africa Trade Balance (Dec)

--

F: --

P: --

India Deposit Gowth YoY

A:--

F: --

P: --

Germany CPI Prelim YoY (Jan)

--

F: --

P: --

Germany CPI Prelim MoM (Jan)

--

F: --

P: --

Germany HICP Prelim YoY (Jan)

--

F: --

P: --

Germany HICP Prelim MoM (Jan)

--

F: --

P: --

U.S. Core PPI YoY (Dec)

--

F: --

P: --

U.S. Core PPI MoM (SA) (Dec)

--

F: --

P: --

U.S. PPI YoY (Dec)

--

F: --

P: --

U.S. PPI MoM (SA) (Dec)

--

F: --

P: --

Canada GDP MoM (SA) (Nov)

--

F: --

P: --

Canada GDP YoY (Nov)

--

F: --

P: --

U.S. PPI MoM Final (Excl. Food, Energy and Trade) (SA) (Dec)

--

F: --

P: --

U.S. PPI YoY (Excl. Food, Energy & Trade) (Dec)

--

F: --

P: --

U.S. Chicago PMI (Jan)

--

F: --

P: --
Canada Federal Government Budget Balance (Nov)

--

F: --

P: --

Brazil CAGED Net Payroll Jobs (Dec)

--

F: --

P: --

U.S. Weekly Total Oil Rig Count

--

F: --

P: --

U.S. Weekly Total Rig Count

--

F: --

P: --

China, Mainland NBS Manufacturing PMI (Jan)

--

F: --

P: --

China, Mainland NBS Non-manufacturing PMI (Jan)

--

F: --

P: --

China, Mainland Composite PMI (Jan)

--

F: --

P: --

South Korea Trade Balance Prelim (Jan)

--

F: --

P: --
Japan Manufacturing PMI Final (Jan)

--

F: --

P: --

South Korea IHS Markit Manufacturing PMI (SA) (Jan)

--

F: --

P: --

Indonesia IHS Markit Manufacturing PMI (Jan)

--

F: --

P: --

China, Mainland Caixin Manufacturing PMI (SA) (Jan)

--

F: --

P: --

Indonesia Core Inflation YoY (Jan)

--

F: --

P: --

Q&A with Experts
    • All
    • Chatrooms
    • Groups
    • Friends
    PLED6KDR6W flag
    how's everything
    PLED6KDR6W flag
    going on
    Nawhdir Øt flag
    EuroTrader
    @EuroTraderI'm full today.
    PLED6KDR6W flag
    what about update of bitcoin
    PLED6KDR6W flag
    brother
    Nawhdir Øt flag
    I just arrived at home. Haven't check graph
    john flag
    Faburama Bojang
    BUY GOLD NOW, the target is 5300
    I think the knife has not touched the ground just yet
    Nawhdir Øt flag
    john
    @johnI just bought at 4946 an hour ago. Could it still go down again in 1d today?
    EuroTrader flag
    Aliola
    @AliolaIf you wish to hold then you can hold since you are already in the trade
    marsgents flag
    buy now got smack🤣
    3485147 flag
    LOL
    EuroTrader flag
    Aliola
    @AliolaOnce this is settled it should be your last trade with Eurgbp actually. It's a pain to watch
    Nawhdir Øt flag
    marsgents
    buy now got smack🤣
    @marsgents🤦🏻‍♂️ Seriously.
    EuroTrader flag
    Nawhdir Øt
    @Nawhdir ØtWoww .what's filling you up cousin? is it the markets that got you filled or it's your profits
    Aliola flag
    EuroTrader
    @EuroTraderI swear
    Nawhdir Øt flag
    EuroTrader
    @EuroTraderjust enough.
    EuroTrader flag
    Nawhdir Øt
    @Nawhdir ØtAny running trades at the moment cousin or you gonna do TGIF today?.
    marsgents flag
    Nawhdir Øt
    @Nawhdir ØtIt wasn't me who invited you to buy now😆
    EuroTrader flag
    Aliola
    @AliolaI never traded it since the last time I slept for two weeks on the trade only to close at a loss
    Nawhdir Øt flag
    EuroTrader
    @EuroTradersome stocks.
    Type here...
    Add Symbol or Code

      No matching data

      All
      Trump Updates
      Recommend
      Stocks
      Cryptocurrencies
      Central Banks
      Featured News
      • All
      • Russia-Ukraine Conflict
      • Middle East Flashpoint
      • All
      • Russia-Ukraine Conflict
      • Middle East Flashpoint
      Search
      Products

      Charts Free Forever

      Chats Q&A with Experts
      Screeners Economic Calendar Data Tools
      Membership Features
      Data Warehouse Market Trends Institutional Data Policy Rates Macro

      Market Trends

      Market Sentiment Order Book Forex Correlations

      Top Indicators

      Charts Free Forever
      Markets

      News

      News Analysis 24/7 Columns Education
      From Institutions From Analysts
      Topics Columnists

      Latest Views

      Latest Views

      Trending Topics

      Top Columnists

      Latest Update

      Signals

      Copy Rankings Latest Signals Become a signal provider AI Rating
      Contests
      Brokers

      Overview Brokers Assessment Rankings Regulators News Claims
      Broker listing Forex Brokers Comparison Tool Live Spread Comparison Scam
      Q&A Complaint Scam Alert Videos Tips to Detect Scam
      More

      Business
      Events
      Careers About Us Advertising Help Center

      White Label

      Data API

      Web Plug-ins

      Affiliate Program

      Awards Institution Evaluation IB Seminar Salon Event Exhibition
      Vietnam Thailand Singapore Dubai
      Fans Party Investment Sharing Session
      FastBull Summit BrokersView Expo
      Recent Searches
        Top Searches
          Markets
          News
          Analysis
          User
          24/7
          Economic Calendar
          Education
          Data
          • Names
          • Latest
          • Prev

          View All

          No data

          Scan to Download

          Faster Charts, Chat Faster!

          Download App
          English
          • English
          • Español
          • العربية
          • Bahasa Indonesia
          • Bahasa Melayu
          • Tiếng Việt
          • ภาษาไทย
          • Français
          • Italiano
          • Türkçe
          • Русский язык
          • 简中
          • 繁中
          Open Account
          Search
          Products
          Charts Free Forever
          Markets
          News
          Signals

          Copy Rankings Latest Signals Become a signal provider AI Rating
          Contests
          Brokers

          Overview Brokers Assessment Rankings Regulators News Claims
          Broker listing Forex Brokers Comparison Tool Live Spread Comparison Scam
          Q&A Complaint Scam Alert Videos Tips to Detect Scam
          More

          Business
          Events
          Careers About Us Advertising Help Center

          White Label

          Data API

          Web Plug-ins

          Affiliate Program

          Awards Institution Evaluation IB Seminar Salon Event Exhibition
          Vietnam Thailand Singapore Dubai
          Fans Party Investment Sharing Session
          FastBull Summit BrokersView Expo

          Starmer's China Deal: A Small Win or a Risky Bet?

          Isaac Bennett

          Economic

          Political

          Data Interpretation

          China–U.S. Trade War

          Remarks of Officials

          Summary:

          Middle powers court Beijing amid US unpredictability, securing modest deals yet confronting China's economic might and Washington's ire.

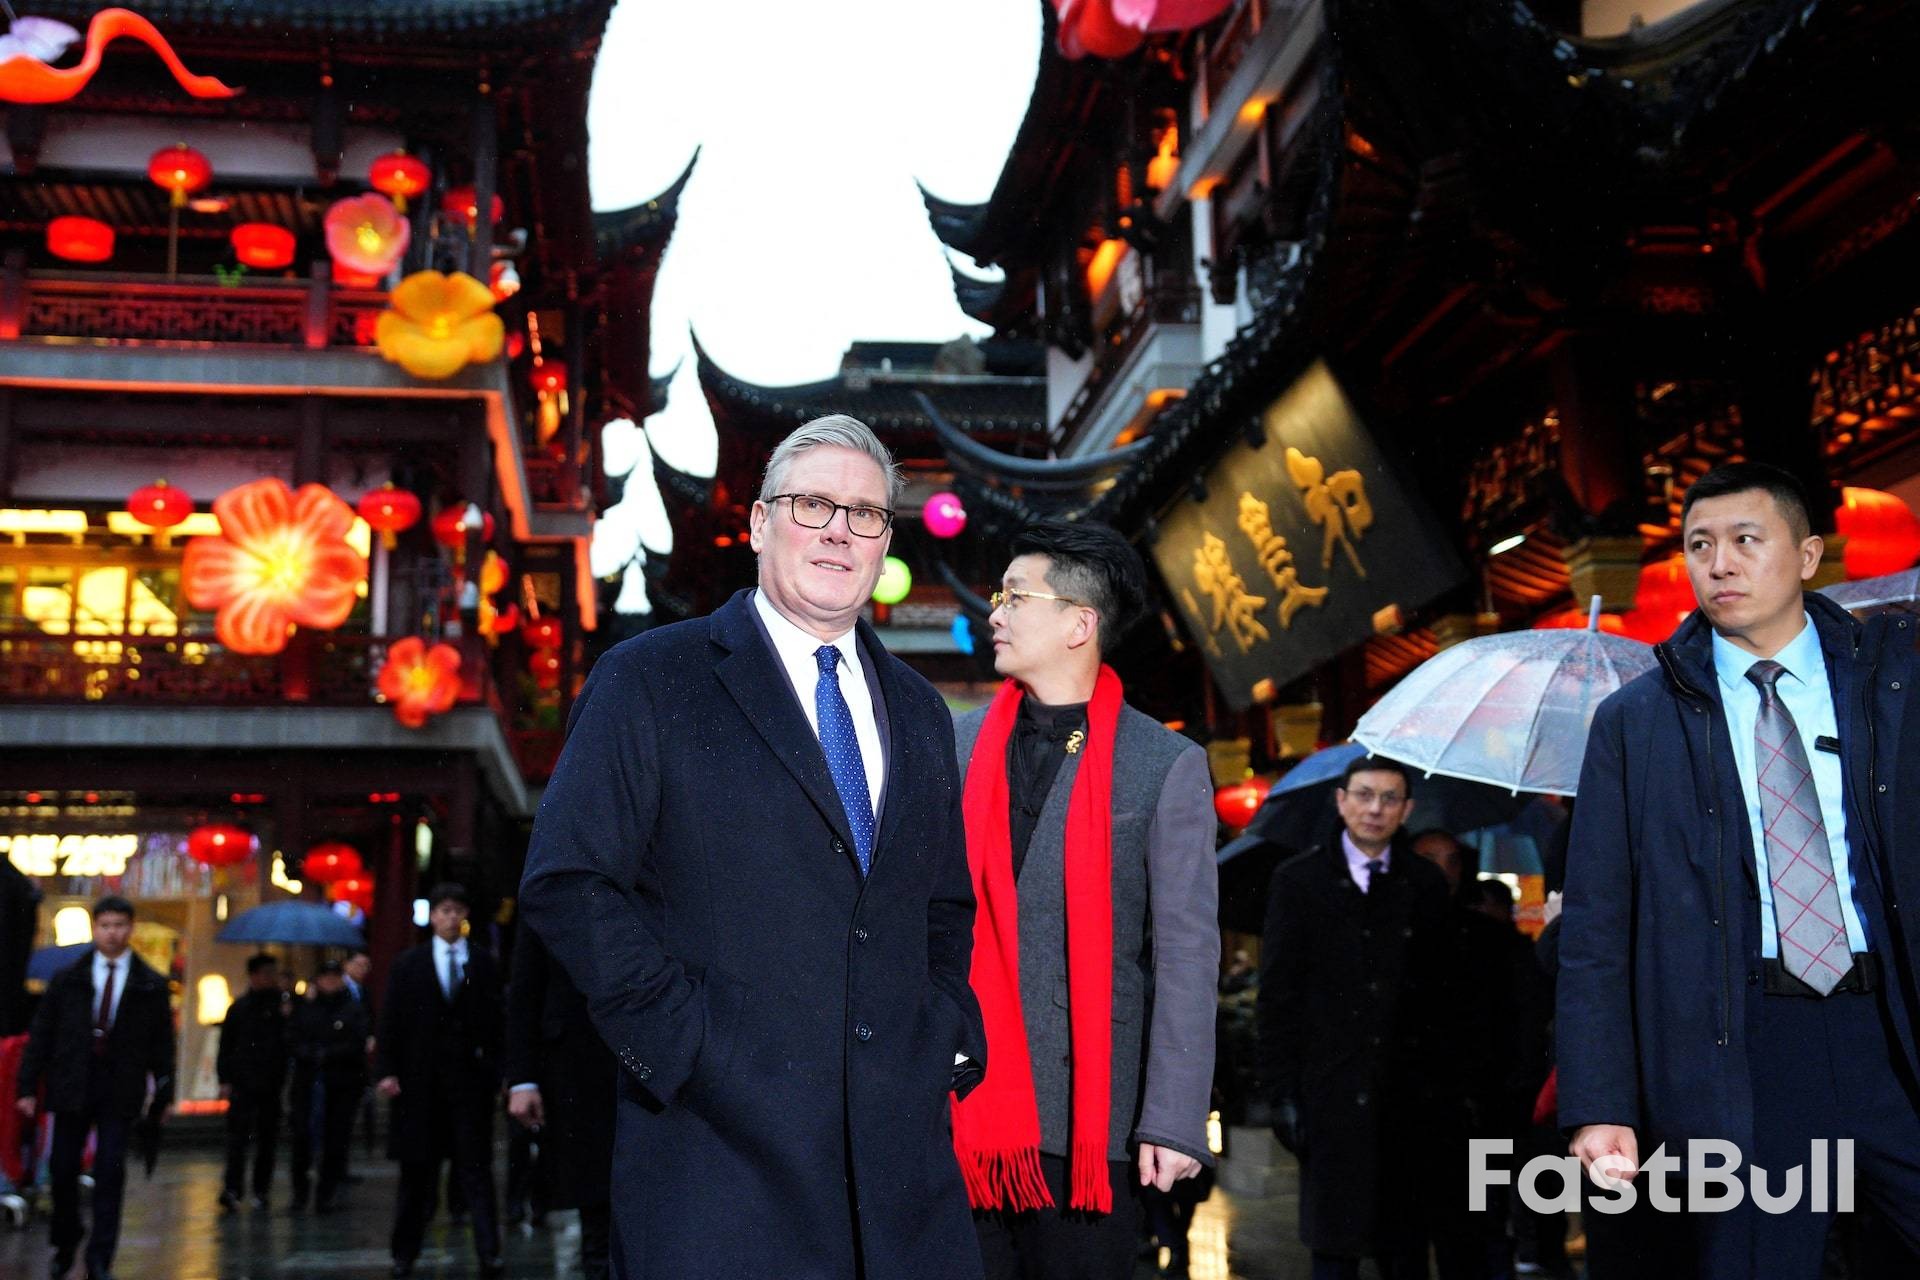
          British Prime Minister Keir Starmer’s high-profile visit to China marks another victory for Beijing in its ongoing rivalry with Washington. But while he returns to London with new deals in hand, the trip also exposes the stark limitations facing middle powers trying to navigate a world fractured by US-China tensions.

          Starmer is the latest Western leader to court Beijing, following Canadian counterpart Mark Carney, who secured a trade deal just weeks earlier. These visits are becoming a pattern as leaders from Europe, India, and beyond seek alternatives to an unpredictable United States under President Donald Trump, who has spent his second term disrupting long-standing alliances.

          UK Prime Minister Keir Starmer in Shanghai on January 30, 2026. His visit highlights a growing trend of Western leaders engaging with Beijing.

          From London's perspective, engaging with China sends a clear message to Trump: if the U.S. continues to apply pressure over issues like Greenland or the USMCA trade pact, its traditional allies have other options. However, some analysts view these moves as "superficial gestures amid stalled global growth."

          "Traditional U.S. allies feel hard done by and are now hedging their bets, but they are far from being able or willing to substitute China for the United States," said John Quelch, an expert in global strategy at Duke Kunshan University.

          What the UK Actually Won

          On his trip, Starmer secured a few tangible benefits for Britain:

          • Visa-Free Travel: Britons gain 30-day visa-free access to China.

          • Lower Whisky Tariffs: A key win for a signature British export.

          • Major Investment: British pharmaceutical giant AstraZeneca unveiled a new $15 billion investment in China.

          However, on more contentious topics, progress was limited to "frank dialogue." Key areas of tension—including China's stance on Taiwan, its close relationship with Russia, and the rights crackdown in Hong Kong—remain unresolved. The visit also drew criticism from politicians in both the UK and US over accusations of espionage and human rights abuses, which Beijing denies.

          A Narrative Victory for Beijing

          While the economic gains for Western nations are modest, the diplomatic visits are a significant boost for China's global standing. Beijing can present itself as a "reliable partner," contrasting its stability with Trump's chaotic tariff policies and frequent demands on allies.

          "President Trump's efforts to decouple the United States from China are also decoupling the United States from the world," Quelch noted.

          This narrative is reinforced with each visit, supporting the idea of a global "pivot to China" as a counterweight to American influence.

          The Economic Reality of China's Trade Imbalance

          The deals Western powers are striking come at the cost of deeper integration with an economy running on overdrive. China’s trade surplus hit a record $1.2 trillion last year—roughly the size of the Dutch economy. This surplus is fueled by a manufacturing sector so powerful that it overwhelms foreign markets, even as domestic consumption remains too weak to support its own producers.

          The trade data tells a clear story of imbalance:

          • European Union: China's exports grew 8.4%, while imports fell 0.4%.

          • United Kingdom: China sold 7.8% more goods while buying 4.7% less.

          • Canada: Chinese sales increased 3.2%, while purchases dropped 10.4%.

          "These visits highlight the severe limits of any 'pivot' to China," said Alicia Garcia-Herrero, chief Asia-Pacific economist at Natixis. "They expose middle powers' vulnerability, chasing scraps while China's export flood overwhelms their industries."

          The Risks of Getting Closer to Beijing

          The flood of Chinese exports poses a direct threat to Western manufacturing. At its current pace, China's trade surplus is on track to match the size of France's $3 trillion economy by 2030 and Germany's $5 trillion economy by 2033.

          "This makes it an especially risky proposition for countries trying to protect or grow their own manufacturing industries to substantially increase trade integration with China," warned Eswar Prasad, former China director at the IMF. "China hardly provides a safe harbour."

          Furthermore, cozying up to Beijing invites backlash from Washington. Before Starmer even left China, Trump warned that it was "very dangerous" for the UK to get into business with Beijing. Similarly, Canada’s deal on canola and lobsters was met with threats of 100% U.S. tariffs and a warning against allowing Chinese EVs into North America.

          A True Pivot or Just Damage Control?

          Despite the risks, some analysts argue that these diplomatic missions are less about securing major trade wins and more about managing complex relationships. For countries like Britain and Canada, simply "reducing tension with Beijing" may be the most realistic goal.

          Noah Barkin of the German Marshall Fund called the visits a "propaganda coup for Beijing" but clarified, "This is not a pivot to China. It is about reducing tension."

          After all, previous deteriorations in relations with China exposed critical supply chain vulnerabilities and only widened trade imbalances. In a world dominated by two superpowers, the ultimate goal for middle powers is survival. As Barkin puts it, "No country wants to be in open conflict with the two superpowers at the same time."

          To stay updated on all economic events of today, please check out our Economic calendar
          Risk Warnings and Disclaimers
          You understand and acknowledge that there is a high degree of risk involved in trading. Following any strategies or investment methods may lead to potential losses. The content on the site is provided by our contributors and analysts for information purposes only. You are solely responsible for determining whether any trading assets, securities, strategy, or any other product is suitable for investing based on your own investment objectives and financial situation.
          Add to Favorites
          Share

          China's LNG Imports Rebound for a Third Consecutive Month

          Edward Lawson

          Economic

          Commodity

          Data Interpretation

          Energy

          China's imports of liquefied natural gas (LNG) are on track for a third straight month of year-over-year growth, signaling a sustained recovery in demand. According to analytics firm Kpler, the country is expected to import 6.94 million tons of LNG in January.

          This projection represents a 15% increase compared to January 2025. The rising import volumes may indicate that more cargoes are now being delivered to China under long-term contracts.

          The Reversal of a Year-Long Decline

          The recent growth marks a significant turnaround. For most of the past year, China's LNG imports saw annual declines, influenced by tariffs and a surge in domestic gas production.

          Domestic output hit an all-time high earlier in the year, causing LNG imports to fall to a six-year low. In the first seven months of 2025, imports dropped by 19% year-over-year. This slowdown was also partly a consequence of a record-setting import year in 2024, when China focused on filling its gas inventories ahead of winter.

          From November 2024 to October 2025, China recorded 12 consecutive months of falling LNG import volumes.

          Seasonal Demand Drives the Current Recovery

          The downward trend finally reversed in November 2025 as seasonal demand for electricity and heating began to climb.

          • November 2025: Imports rose to 6.94 million tons, a 13.6% increase from the previous year.

          • December 2025: Volumes grew further, reaching an estimated 7.17 million tons, according to Kpler data.

          Russian LNG Shipments Hit Record Highs

          Imports from Russia, in particular, reached an all-time high at the end of last year. In November, China imported 1.6 million tons of Russian LNG, a figure that doubled from October. This strong import trend was expected to continue into December and possibly into January.

          To stay updated on all economic events of today, please check out our Economic calendar
          Risk Warnings and Disclaimers
          You understand and acknowledge that there is a high degree of risk involved in trading. Following any strategies or investment methods may lead to potential losses. The content on the site is provided by our contributors and analysts for information purposes only. You are solely responsible for determining whether any trading assets, securities, strategy, or any other product is suitable for investing based on your own investment objectives and financial situation.
          Add to Favorites
          Share

          Bank Of England Mortgage Approvals Fall To Lowest Since June 2024

          Winkelmann

          Economic

          British lenders approved 61,013 mortgages in December, the lowest since June 2024 and down from a revised 64,072 in November, Bank of England data showed on Friday.

          Economists polled by Reuters had a median forecast of 64,800 for December, up marginally from November's original reading of 64,530.

          Britain's housing market slowed in 2025 after the end of a temporary tax break on some house purchases, and there were was some further loss of momentum in the months running up to finance minister Rachel Reeves' annual budget on November 26 due to fears of higher taxes on more expensive homes.

          Mortgage lender Halifax reported that house prices rose just 0.3% in the 12 months to December - well below the rate of consumer price inflation - and rival Nationwide recorded a 0.6% annual increase.

          However, the Royal Institution of Chartered Surveyors said there was the beginning of signs of a turnaround in sentiment in December as sales expectations rose to their highest since October 2024.

          Source: Investing

          To stay updated on all economic events of today, please check out our Economic calendar
          Risk Warnings and Disclaimers
          You understand and acknowledge that there is a high degree of risk involved in trading. Following any strategies or investment methods may lead to potential losses. The content on the site is provided by our contributors and analysts for information purposes only. You are solely responsible for determining whether any trading assets, securities, strategy, or any other product is suitable for investing based on your own investment objectives and financial situation.
          Add to Favorites
          Share

          Hong Kong's Economy Accelerates to 3.8% Growth in Q4 2025

          Michael Ross

          Remarks of Officials

          Economic

          Data Interpretation

          Hong Kong’s economy posted a robust 3.8% year-on-year expansion in the fourth quarter of 2025, according to official advance estimates. This marks the city's 12th consecutive quarter of growth, driven by strong regional trade, a recovery in tourism, and vigorous activity in the financial services sector.

          The fourth-quarter performance represents an acceleration from previous periods. The economy grew by a revised 3.7% in the third quarter, 3.1% in the second, and 3.0% in the first quarter of 2025. On a seasonally adjusted quarterly basis, GDP expanded by 1.0% in the final three months of the year, up from 0.7% in the third quarter.

          Full-Year Growth Surpasses Official Forecasts

          For the entirety of 2025, Hong Kong's real GDP grew by 3.5%. This figure not only surpassed the government's own forecast of 3.2% but also marked a significant increase from the 2.5% growth recorded in 2024.

          The momentum was underpinned by strong performance across several key economic pillars:

          • Private Consumption: Expenditure rose by 2.5% in the fourth quarter, slightly ahead of the 2.4% increase in Q3. For the full year, private consumption grew by 1.6%.

          • Goods Exports: Total exports surged by 15.5% in Q4, a notable jump from the 12% rise in the previous quarter. This brought full-year export growth to 12%.

          • Goods Imports: Imports expanded by 18.4% in Q4, up from 11.7% in Q3, resulting in 12.6% growth for the full year.

          Economic Outlook for 2026 Remains Positive

          Looking ahead, the government anticipates that the Hong Kong economy will maintain its positive trajectory into 2026. A government spokesperson stated that the city is "expected to maintain good momentum."

          Several factors are expected to support this continued growth. A moderate but sustained expansion of the global economy, combined with strong international demand for electronics enabled by artificial intelligence, is projected to bolster Hong Kong's export performance.

          Furthermore, improving sentiment among consumers and businesses, alongside the possibility of interest rate cuts in the United States, is expected to stimulate local consumption and investment.

          Despite the optimistic forecast, officials cautioned that external uncertainties persist, particularly amid escalating geopolitical tensions that could pose risks to the outlook.

          To stay updated on all economic events of today, please check out our Economic calendar
          Risk Warnings and Disclaimers
          You understand and acknowledge that there is a high degree of risk involved in trading. Following any strategies or investment methods may lead to potential losses. The content on the site is provided by our contributors and analysts for information purposes only. You are solely responsible for determining whether any trading assets, securities, strategy, or any other product is suitable for investing based on your own investment objectives and financial situation.
          Add to Favorites
          Share

          Microsoft (MSFT) Shares Post A Record Decline

          FXOpen

          Stocks

          On Wednesday, after the close of the regular trading session, Microsoft (MSFT) released its quarterly earnings report, which exceeded analysts' expectations:

          → Earnings per share: actual $4.14, forecast $3.90;
          → Gross revenue: actual $81.2bn, forecast $80.3bn;
          → Operating profit: up 21%.

          Despite the strong results, MSFT shares suffered a dramatic sell-off of around 10% by the close of yesterday's trading. According to media reports, this was the largest one-day drop in Microsoft's share price on record, with the company losing roughly $360bn in market capitalisation.

          Why MSFT Shares Collapsed

          Market participants were most likely disappointed by the following factors:

          → A sharp rise in capital expenditure: capex surged by 66% to $37.5bn as Microsoft continued to invest heavily in data centres and AI infrastructure, while the timing of meaningful returns on these investments remains uncertain.

          → Slowing growth in the cloud computing segment.

          Technical Analysis of Microsoft (MSFT) Shares

          When analysing the MSFT chart on 15 January, we identified a key ascending channel reflecting the stock's long-term price structure. At that time, we suggested that the market might find a temporary balance ahead of the earnings release.

          Since then, although volatility persisted, the price showed an ability to recover from 22 January onwards, indicating that buyers were attempting to wrest control from sellers.

          Yesterday's record decline significantly altered the picture, but two factors are worth noting:

          1 → The price fell below the 1 May low, entering the area of a broad bullish gap located above the psychological $400 level.
          2 → In 2026, the market has been forming a descending channel (shown in red), with the price now reaching its lower boundary.

          It is reasonable to assume that these two factors could act as support. The structure of yesterday's candle supports this view: the session closed well above the low, and trading volumes were the highest in several years. This suggests active buying interest, with the price rebounding from around $422 to $433.

          As a result, it is possible that the initial emotional reaction may fade and MSFT shares will avoid a further acceleration of the downtrend. However, a meaningful shift back to a bullish market structure would require strong fundamental catalysts.

          Source: FXOpen

          Risk Warnings and Disclaimers
          You understand and acknowledge that there is a high degree of risk involved in trading. Following any strategies or investment methods may lead to potential losses. The content on the site is provided by our contributors and analysts for information purposes only. You are solely responsible for determining whether any trading assets, securities, strategy, or any other product is suitable for investing based on your own investment objectives and financial situation.
          Add to Favorites
          Share

          Metals Flashing Red After Record Runs – Silver (XAG/USD), Gold (XAU/USD) And Copper (XCU/USD) Outlook

          MarketPulse by OANDA Group

          Forex

          Commodity

          · Silver, Gold were reaching new highs every day but saw a sudden top in today's action
          · Post-FOMC rally gets tested, we observe if the trend can continue
          · High timeframe analysis for XAG/USD, XAU/USD and XCU/USD (Copper)

          If 2025 was volatile for metals, 2026 is starting with even greater intensity.

          The global order is fracturing as historic allies clash and new conflicts appear imminent.

          For metal maximalists, this confirms a long-held thesis. Decades of high deficits create predictable capital flows and supply shortages, which are now driving prices to daily records.

          As geopolitical tensions rise, investors are rushing to commodities to hedge against supply shortages and inflation, a classic play.

          Metals performance in 2026 – Source: TradingView

          But today's flows feel different.

          It is almost impossible to predict tops in such extreme, unidirectional trends. Some periods can be more favorable for squeezes. Some others are more favorable for rangebound conditions and selloffs.

          And such periods tend to change at the beginning of the New Year, at the start of Quarters, Months, or even after FOMC meetings.

          As the US President announced he will officially announce his decision on the Fed Chair next week, Markets are looking back at yesterday's Federal Reserve decision.

          Higher rates for longer will be the way to go for the Fed until anything cracks, as the US Labor Market bounced back and the US economy is shining – Can't justify many cuts with that.

          Today marked a brutal stalling in rallies throughout the Metals asset class.

          Gold was trading 6% higher than the day before the FOMC, only to give up those gains in a 10% flash crash.

          Similar flows occurred in Copper, Silver, Palladium, and Platinum, all dropping by 9% to 11%.

          By the way, Copper spiked to new record highs in yesterday's evening session, reaching $6.52 per lb, but still lacking a more fundamental foundation to persistently elevated prices.

          In the meantime, let's dive right into intraday timeframe analysis for Gold (XAU/USD), Silver (XAG/USD) and Copper (XCU/USD) to spot where the session dynamic takes the price action. Is the trend challenged?

          Gold (XAU/USD) 2H Chart and levels

          Gold (XAU/USD) 2H Chart, January 29, 2026 – Source: TradingView

          This morning's action could pose a significant test to the 30% yearly run in the Bullion.

          The current fundamentals are heavily backing the recent rise, particularly as it is far less extreme than the one seen in Silver for example.

          Still, when profit-taking occurs so suddenly, traders can look around, question the current state of the Market and reassess if the trend can still hold.

          Since the flash, prices have rebounded – Hence look at these two levels:

          · Any retest of the all-time high ($5,600) should be followed with further upside. Particularly after a 4H candle close. Next areas of interest could be between $5,800 and $5,900.
          · Any break and close below $5,100 can put the entire 2026 gains in challenge.
          · The 4H 50-period MA can act as a very interesting indicator for short-term momentum

          Higher Timeframe Levels to watch for Gold (XAU/USD):

          Resistance Levels:

          · Current All-time Highs – $5,500 to $5,600
          · Key Fibonacci Projection $5,800 to $5,900
          · $5,400 mini-resistance

          Support Levels:

          · $5,000 to $5,100 Major Psychological Pivot (Morning lows $5,100)
          · $4,788 4H MA 200
          · Pivotal Support $4,400 to $4,500 – Bullish above, Bearish below
          · Minor Support $3,880 to $4,050
          · $3,200 to $3,500 Major Support
          · $2,600 to $2,800 November 2024 Support
          · $1,800 to $2,000 2022 to 2024 Range Support

          Silver (XAG/USD) 2H Chart and levels

          Silver (XAG/USD) Weekly Chart, January 29, 2026 – Source: TradingView

          Evolving in a steep upward channel, Silver is testing its upper bound in high volatility consolidation.

          Prices have maintained within a $107 to $120 range since Monday, hence trades will look for breakouts either to the upside or downside for future action.

          Similarly as in Gold, look for a candle close above or below with high volumes to get confirmation.

          A break lower could go test the Upward channel lower bounds, currently around $92.

          Higher Timeframe Levels to watch for Silver (XAG/USD):

          Resistance Levels:

          · $118 to $120 Current ATH Resistance
          · Current Record $121.67
          · Potential Resistance $125 to $127

          Support Levels:

          · Key Momentum Pivot and Range lows $100 to $104
          · Higher Timeframe Pivotal Support $89 to $92
          · 2025 HighsMini-Support $80 to $84
          · Major 2026 Support $70 to $72
          · December FOMC Major Support $58.00 to $60

          Copper (XCU/USD) 2H Chart and levels

          Copper (XCU/USD) 2H Chart, January 29, 2026 – Source: TradingView

          The recent moves are not particularly indicative of a trend-end but recent up and down action may precede doubts to the sustainability of the recent moves.

          Copper spiked by 10% during overnight trading, corrects by a similar amount and is now holding tight at its January 14 record range ($6.00 to $6.10 Major Pivot).

          · Holding above the Pivot keeps the trend intact and could lead to further highs with the next step between $6.90 to $7.00.
          · Closing below the pivot would hint at a test of the $5.70 to $5.90 pivotal support.
          Any close below the Pivotal support would compromise the uptrend.

          Current ATH Resistance $6.40 to $6.50

          Higher Timeframe Levels to watch for Copper (XCU/USD):

          Resistance Levels:

          · Current ATH Resistance $6.40 to $6.50
          · $6.52 Current Record
          · Potential Resistance $6.90 to $7.00

          Support Levels:

          · $6.00 to $6.10 Early Jan 2026 Record
          · Pivotal Support $5.70 to $5.90 – Bullish above, Bearish Below
          · Minor Support at March 2025 Highs $5.40
          · Major Monthly Support between $4.90 to $5.00 (50-Week MA)

          Watch out for positioning and fast-paced moves!

          January is already coming to an end and it has historically been the best month for Gold, Silver and Platinum. Keep a close eye to see if the rally holds the colder February ahead.

          Safe Trades!

          Source: MarketPulse by OANDA Group

          Risk Warnings and Disclaimers
          You understand and acknowledge that there is a high degree of risk involved in trading. Following any strategies or investment methods may lead to potential losses. The content on the site is provided by our contributors and analysts for information purposes only. You are solely responsible for determining whether any trading assets, securities, strategy, or any other product is suitable for investing based on your own investment objectives and financial situation.
          Add to Favorites
          Share

          China Slashes Whisky Tariffs in Major UK Trade Deal

          Frederick Miles

          Economic

          Remarks of Officials

          Political

          China is set to cut its import tariff on whisky in half, a significant move that provides a major boost to the British whisky industry. The tariff will be lowered from 10% to 5%, with the new rate taking effect on February 2.

          This decision comes directly after high-level talks between British Prime Minister Keir Starmer and Chinese President Xi Jinping, aimed at repairing diplomatic ties and strengthening economic cooperation.

          Economic Impact for UK Distillers

          The reduction is expected to deliver substantial financial benefits for UK-based exporters. According to the British Prime Minister's office, the deal is valued at approximately £250 million ($344.13 million) over the next five years.

          The UK is the dominant player in China's whisky market. Customs data from 2025 shows that China imported $445.5 million worth of whisky, with a staggering 84% of that total originating from the United Kingdom. This market share underscores why the tariff adjustment is a critical win for the Scotch whisky sector.

          Policy Reversal and Diplomatic Context

          The tariff change marks a reversal of a recent effective rate hike. While Beijing had previously set a provisional tariff of 5% on whisky in 2017, this provision was removed for 2025, causing the rate to revert to 10%. The new policy reinstates the lower 5% tariff.

          The agreement was a key outcome of discussions between Starmer and Xi in Beijing. Beyond whisky tariffs, the two leaders also committed to pursuing greater cooperation in the broader fields of trade, investment, and technology.

          To stay updated on all economic events of today, please check out our Economic calendar
          Risk Warnings and Disclaimers
          You understand and acknowledge that there is a high degree of risk involved in trading. Following any strategies or investment methods may lead to potential losses. The content on the site is provided by our contributors and analysts for information purposes only. You are solely responsible for determining whether any trading assets, securities, strategy, or any other product is suitable for investing based on your own investment objectives and financial situation.
          Add to Favorites
          Share
          FastBull
          Copyright © 2026 FastBull Ltd

          728 RM B 7/F GEE LOK IND BLDG NO 34 HUNG TO RD KWUN TONG KLN HONG KONG

          TelegramInstagramTwitterfacebooklinkedin
          App Store Google Play Google Play
          Products
          Charts

          Chats

          Q&A with Experts
          Screeners
          Economic Calendar
          Data
          Tools
          Membership
          Features
          Function
          Markets
          Copy Trading
          Latest Signals
          Contests
          News
          Analysis
          24/7
          Columns
          Education
          Company
          Careers
          About Us
          Contact Us
          Advertising
          Help Center
          Feedback
          User Agreement
          Privacy Policy
          Personal Information Protection Statement
          Business

          White Label

          Data API

          Web Plug-ins

          Poster Maker

          Affiliate Program

          Risk Disclosure

          The risk of loss in trading financial instruments such as stocks, FX, commodities, futures, bonds, ETFs and crypto can be substantial. You may sustain a total loss of the funds that you deposit with your broker. Therefore, you should carefully consider whether such trading is suitable for you in light of your circumstances and financial resources.

          No decision to invest should be made without thoroughly conducting due diligence by yourself or consulting with your financial advisors. Our web content might not suit you since we don't know your financial conditions and investment needs. Our financial information might have latency or contain inaccuracy, so you should be fully responsible for any of your trading and investment decisions. The company will not be responsible for your capital loss.

          Without getting permission from the website, you are not allowed to copy the website's graphics, texts, or trademarks. Intellectual property rights in the content or data incorporated into this website belong to its providers and exchange merchants.

          Not Logged In

          Log in to access more features

          Connect Broker
          Become a signal provider
          Help Center
          Customer Service
          Dark Mode
          Price Up/Down Colors

          Log In

          Sign Up

          Position
          Layout
          Fullscreen
          Default to Chart
          The chart page opens by default when you visit fastbull.com