Markets
News
Analysis
User
24/7
Economic Calendar
Education
Data
- Names
- Latest
- Prev


Signal Accounts for Members
All Signal Accounts
All Contests


OPEC Secretariat Receives Updated Compensation Plans From Iraq, The United Arab Emirates, Kazakhstan, And Oman
Stats Office - Swiss December Retail Sales +2.9% Year-On-Year Versus Revised +1.7% In Previous Month
Iran's Foreign Ministry Spokesperson Baghaei Says Tehran Is Examining Details Of Various Diplomatic Processes, Hopes For Results In Coming Days
FAA Head Says Concerned Other Countries Aren't Putting Enough Resources Into Certifying USA Aircraft
German Dec Retail Sales +1.5 Percent Year-On-Year (Versus Reuters Consensus Forecast For +1.1 Percent)
Russian Security Committee's Vice Chairman Medvedev: Russia Will Not Accept NATO-Member Forces In Ukraine
Russian Security Committee's Vice Chairman Medvedev: Nuclear Arms Control For Past 60 Years Helped Verify Intentions And Build Trust
Russian Security Committee's Vice Chairman Medvedev: The Territorial Issue In Ukraine Talks Is Most Complicated
Russian Security Committee's Vice Chairman Medvedev: If New Start Expires It Does Not Necessarily Mean A Catastrophe But It Should Alarm Everyone
Russian Security Committee's Vice Chairman Medvedev: Our Proposal To USA On Extending The Limits Of New Start Remains On The Table

U.S. Core PPI YoY (Dec)A:--
F: --
U.S. Core PPI MoM (SA) (Dec)A:--
F: --
P: --
U.S. PPI YoY (Dec)A:--
F: --
P: --
U.S. PPI MoM (SA) (Dec)A:--
F: --
P: --
Canada GDP MoM (SA) (Nov)A:--
F: --
P: --
Canada GDP YoY (Nov)A:--
F: --
P: --
U.S. PPI MoM Final (Excl. Food, Energy and Trade) (SA) (Dec)A:--
F: --
P: --
U.S. PPI YoY (Excl. Food, Energy & Trade) (Dec)A:--
F: --
P: --
U.S. Chicago PMI (Jan)A:--
F: --
Canada Federal Government Budget Balance (Nov)A:--
F: --
P: --
U.S. Weekly Total Oil Rig CountA:--
F: --
P: --
U.S. Weekly Total Rig CountA:--
F: --
P: --
China, Mainland NBS Manufacturing PMI (Jan)A:--
F: --
P: --
China, Mainland NBS Non-manufacturing PMI (Jan)A:--
F: --
P: --
China, Mainland Composite PMI (Jan)A:--
F: --
P: --
South Korea Trade Balance Prelim (Jan)A:--
F: --
Japan Manufacturing PMI Final (Jan)A:--
F: --
P: --
South Korea IHS Markit Manufacturing PMI (SA) (Jan)A:--
F: --
P: --
Indonesia IHS Markit Manufacturing PMI (Jan)A:--
F: --
P: --
China, Mainland Caixin Manufacturing PMI (SA) (Jan)A:--
F: --
P: --
Indonesia Trade Balance (Dec)A:--
F: --
P: --
Indonesia Inflation Rate YoY (Jan)A:--
F: --
P: --
Indonesia Core Inflation YoY (Jan)A:--
F: --
P: --
India HSBC Manufacturing PMI Final (Jan)A:--
F: --
P: --
Australia Commodity Price YoY (Jan)A:--
F: --
P: --
Russia IHS Markit Manufacturing PMI (Jan)A:--
F: --
P: --
Turkey Manufacturing PMI (Jan)A:--
F: --
P: --
U.K. Nationwide House Price Index MoM (Jan)A:--
F: --
P: --
U.K. Nationwide House Price Index YoY (Jan)A:--
F: --
P: --
Germany Actual Retail Sales MoM (Dec)A:--
F: --
Italy Manufacturing PMI (SA) (Jan)--
F: --
P: --
South Africa Manufacturing PMI (Jan)--
F: --
P: --
Euro Zone Manufacturing PMI Final (Jan)--
F: --
P: --
U.K. Manufacturing PMI Final (Jan)--
F: --
P: --
Brazil IHS Markit Manufacturing PMI (Jan)--
F: --
P: --
Canada National Economic Confidence Index--
F: --
P: --
Canada Manufacturing PMI (SA) (Jan)--
F: --
P: --
U.S. IHS Markit Manufacturing PMI Final (Jan)--
F: --
P: --
U.S. ISM Output Index (Jan)--
F: --
P: --
U.S. ISM Inventories Index (Jan)--
F: --
P: --
U.S. ISM Manufacturing Employment Index (Jan)--
F: --
P: --
U.S. ISM Manufacturing New Orders Index (Jan)--
F: --
P: --
U.S. ISM Manufacturing PMI (Jan)--
F: --
P: --
South Korea CPI YoY (Jan)--
F: --
P: --
Japan Monetary Base YoY (SA) (Jan)--
F: --
P: --
Australia Building Approval Total YoY (Dec)--
F: --
P: --
Australia Building Permits MoM (SA) (Dec)--
F: --
P: --
Australia Building Permits YoY (SA) (Dec)--
F: --
P: --
Australia Private Building Permits MoM (SA) (Dec)--
F: --
P: --
Australia Overnight (Borrowing) Key Rate--
F: --
P: --
RBA Rate Statement
Japan 10-Year Note Auction Yield--
F: --
P: --
Saudi Arabia IHS Markit Composite PMI (Jan)--
F: --
P: --
RBA Press Conference
Turkey PPI YoY (Jan)--
F: --
P: --
Turkey CPI YoY (Jan)--
F: --
P: --
Turkey CPI YoY (Excl. Energy, Food, Beverage, Tobacco & Gold) (Jan)--
F: --
P: --


No matching data
Latest Views
Latest Views
Trending Topics
Top Columnists
Latest Update
White Label
Data API
Web Plug-ins
Affiliate Program
View All

No data
Crude oil surges 6.78% on geopolitical risk and inventory draws, yet structural surplus of 0.75-3.5 million bpd could cap gains near consensus $60 target.

Nearby WTI futures settled at $65.21 last week, up $4.14 or 6.78%—marking the sixth straight weekly gain. Traders are feeding off escalating U.S.-Iran tensions and tighter U.S. inventories, pushing both WTI and Brent to multi-month highs. But analyst consensus is screaming oversupply.
The biggest catalyst? Geopolitics. President Trump warned Tehran it faces military action unless it accepts a new nuclear deal. The U.S. deployed additional naval assets to the Persian Gulf, and Iran just announced live-fire military drills in the Strait of Hormuz next week. Roughly 20% of global seaborne oil flows through that chokepoint.
Traders are pricing in disruption risk even without actual barrel losses. Stack that with drone strikes on Russian tankers in the Black Sea and tightening U.S. sanctions on Russian fuel exports to Asia, and you've got a risk premium that's hard to ignore.
The latest EIA report showed a 2.3-million-barrel draw in commercial crude stocks. At 423.8 million barrels, U.S. inventories are sitting about 3% below the five-year seasonal average. That shift from earlier January builds is giving buyers confidence that near-term demand is absorbing supply.
Here's where bulls need to be careful. A recent Reuters poll of 31 economists and analysts forecasts Brent averaging just $62.02 per barrel in 2026, with WTI projected at $58.72—both well below current levels. Global oil markets face a structural surplus ranging from 0.75 to 3.5 million barrels per day this year.
OPEC+ paused production hikes for Q1 2026 after raising output targets by 2.9 million barrels daily last year. Analysts expect the group will watch consumption patterns closely before making any big moves.
Geopolitical risk premiums could extend if Iranian tensions escalate or we see actual supply disruptions—potentially pushing prices into the low-to-mid $70s. On the flip side, any clear de-escalation signals or a surprisingly bearish inventory report could trigger profit-taking back toward consensus forecast levels near $60. For now, the war premium is underpinning the rally, but the fundamental backdrop of excess supply capacity says don't get too comfortable chasing this move.
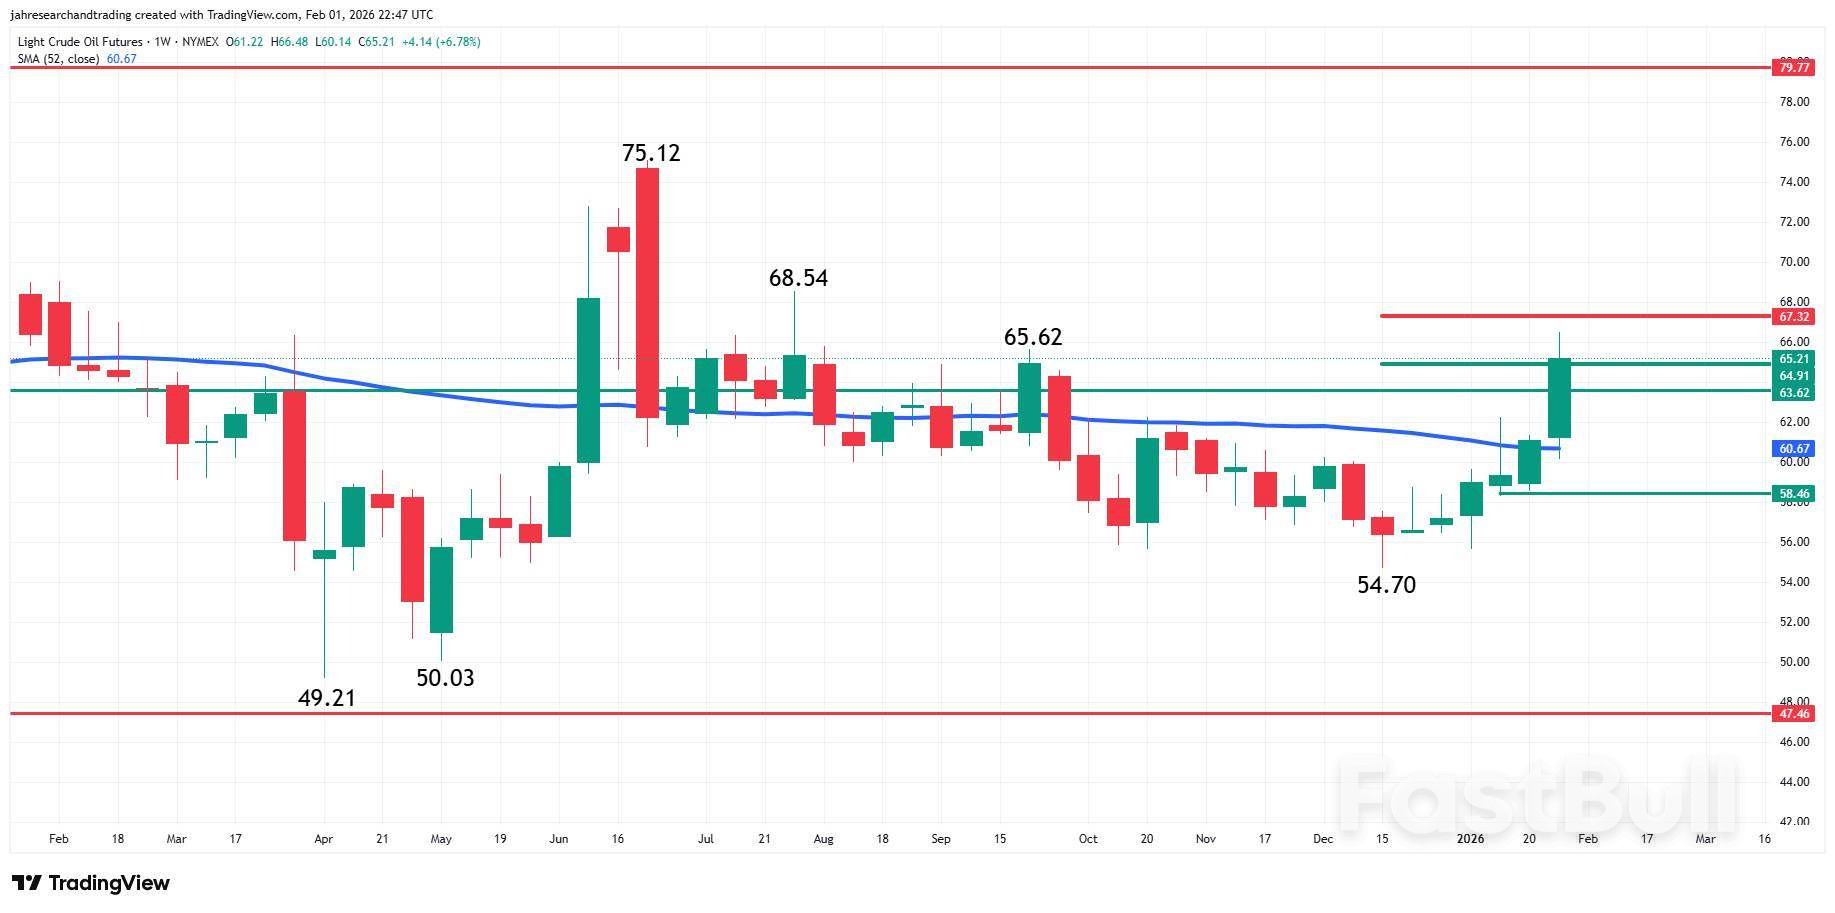
Weekly Light Crude Oil FuturesTechnically, both the weekly swing chart and the 52-week moving average are signaling an uptrend, but the market is facing headwinds inside a key retracement zone. Traders will also be monitoring a long-term pivot for direction.
The breakout over the 52-week moving average at $60.64 triggered the huge rally. This is understandable since it had been capping gains since late September. This is the support.
The next surge was fueled by a recovery of the long-term pivot at $63.62. This indicator will determine the strength of the trend.
The intermediate range is $75.12 to $54.70. Its retracement zone at $64.91 to $67.31 is potential resistance. Buyers tested this zone last week before stopping at $66.48.
For longer-term traders, the 52-week moving average has to continue to hold as support. Short-term traders need to see a support base built over the pivot at $63.62. Enough momentum then has to build to trigger a breakout over the top of the retracement zone at $67.32.
If enough buyers don't show up to overcome the retracement zone then we're likely to become rangebound with the 52-week moving average the floor and the zone the ceiling.
Geopolitical uncertainty is rattling global energy markets as the US administration's unpredictable stance on Iran leaves both Tehran and traders guessing. With a US armada positioned off the Iranian coast, the lack of a clear strategy has injected significant volatility into oil and gas prices.
Oil prices climbed above $70 per barrel on Thursday, reaching a high not seen since last July. While this surge is partly fueled by fears of a US-Iran conflict, it's also propped up by temporary supply disruptions. Recent winter storms have interrupted US output, and fires at Kazakhstan's key Tengiz field have caused a sharp drop in its supply.
This tension extends to the natural gas market. European prices rose sharply last month due to a prolonged cold spell that depleted storage reserves. The freeze in the US has further complicated the situation, forcing Europe to confront its potential over-reliance on American liquefied natural gas (LNG) just as it sought to reduce its dependence on Russian pipelines.
The war of words has escalated, amplifying market jitters. President Donald Trump issued a warning, posting, "The next attack will be far worse! Don't make that happen again," as the USS Abraham Lincoln carrier group remains near Iran.
In response, Ali Larijani, secretary of Iran's national security council, stated from Moscow that "structural arrangements for negotiations are progressing," dismissing the tension as a "contrived media war." Simultaneously, Tehran announced plans for a live-fire military exercise in the Strait of Hormuz, while attributing several domestic explosions to gas leaks.
Meanwhile, regional powers including the UAE, Saudi Arabia, and Qatar have consistently advocated for a diplomatic solution over military conflict.
The current standoff could unfold in several ways, ranging from a quiet de-escalation to a major regional conflict.
• Limited Strikes: The confrontation could end with minor US military strikes on Iranian missile or nuclear facilities, leaving the country's energy sector untouched, similar to the brief conflict last June.
• Targeting Energy Infrastructure: The US and/or Israel could attack Iran's domestic energy grid, focusing on gas, electricity, and fuel distribution systems.
• Regime-Change Campaign: Following Iran's suppression of recent protests, Washington might launch a prolonged military campaign or an oil export blockade designed to destabilize or topple the regime.
• Iranian Retaliation: Tehran could strike back by targeting regional energy assets, as it did last year when it damaged a refinery in Haifa, Israel. Other potential targets include Israeli offshore gas platforms that supply Egypt and Jordan.
• A Negotiated Deal: In the face of an attack, Iran might be pushed to the negotiating table, possibly after a change in leadership.
This wide spectrum of outcomes makes it difficult for energy markets to price in the risk accurately. The situation is far more complex than the one-way bet on Venezuelan oil at the start of the year, where exports had little direction to go but up.
Iran's role in the global oil market means any disruption would have a significant impact. The country currently exports between 1.5 million and 1.7 million barrels per day (bpd) of crude oil and condensate, along with 0.5 million bpd of refined products. A sudden halt to these exports could drive oil prices higher by about $15 per barrel.
However, several factors could cushion the blow. OPEC's spare capacity, held primarily by Saudi Arabia and the UAE, is more than sufficient to cover the shortfall. Furthermore, China—Iran's largest customer—could slow the filling of its strategic petroleum reserves or purchase more discounted Russian oil.
While Iran is the world's third-largest natural gas producer, it is not a major exporter. Its main customer, Turkey, has other options, including increasing LNG purchases or buying more gas from Russia.
The most severe risk—though one with low probability—is an interruption of energy transit through the Gulf. The often-repeated threat from Tehran to "close Hormuz" is largely seen as a last resort, as such an act would be almost suicidal for the regime.
A more plausible scenario involves asymmetric warfare. Houthi forces in Yemen have demonstrated how a campaign of missile, drone, and mine attacks can effectively disrupt shipping in a critical waterway. A similar strategy in the Gulf would not stop oil and LNG transit entirely, but it would severely limit it and cause shipping and insurance premiums to skyrocket.
If diplomacy prevails, the market dynamics would shift dramatically. The geopolitical risk premium would evaporate from oil prices. An easing or suspension of sanctions could allow Iran to boost its exports by 300,000 to 500,000 bpd, bringing its total output to around 3.8 million bpd.
A deal would also be a financial windfall for Tehran. By gaining access to customers beyond China, Iran could end its reliance on a "shadow fleet" of tankers and stop offering deep discounts, saving an estimated $8 to $10 per barrel.
Even if a political agreement is reached, a surge in Iranian oil production is unlikely. International oil companies have historically found Tehran a difficult place to operate, and the country's aging fields require massive investment just to offset natural decline rates.
Iran also lacks sufficient natural gas to inject into its fields for crucial enhanced oil recovery projects. Under the most favorable conditions, a realistic production target is 4.5 million bpd by 2030—a moderate increase, but not a game-changer for global supply.
For now, the balance of risk points toward higher oil and gas prices. While a peaceful resolution would loosen the market, it wouldn't fundamentally reshape it. The key players have yet to reveal their next move, leaving the world's energy markets waiting in suspense.
India and the European Union have finalized a long-awaited free trade agreement (FTA), a landmark deal that arrives at a critical moment for global commerce. As economies across Asia seek to diversify their export markets beyond the United States, this agreement provides significant momentum. The pact is being hailed as the "mother of all deals" for its sheer scale and its potential to reshape global trade alignments.

The deal underscores the EU's pragmatic approach to accommodating India's economic sensitivities—a flexibility that some argue has been missing in negotiations with the US. For India, this agreement is a milestone in its trade diversification strategy. Here’s a breakdown of what the FTA means for the country's economy.
Under the terms of the new agreement, India will gain preferential access to 97% of EU tariff lines, which covers an estimated 99.5% of its trade value. A significant portion of these goods will be eligible for immediate duty elimination, particularly benefiting labor-intensive sectors that contribute nearly 2% of India's GDP in exports.
The economic relationship is already robust. India maintains a net exporter status with the EU in both goods and services. Bilateral merchandise trade reached approximately $137 billion in fiscal year 2024–25, with India’s exports to the EU totaling $76 billion. The services trade is equally strong, hitting $83 billion in 2024.
The FTA offers India several clear advantages, from tariff elimination on goods to a major boost for its world-class services sector.
1. Pivoting Beyond the US Market
The EU is already India's second-largest export destination, accounting for 17% of its total exports, just behind the United States at 21%. The EU's share has grown by three percentage points since the pandemic. Since India's export mix to both markets is similar (with the exception of petroleum products having a larger share in EU exports), the new FTA allows India to strategically pivot toward the European market if high US tariffs persist. This move can effectively reduce its reliance on a single major trading partner without requiring a major overhaul of its export industries.
2. Boosting Jobs in Labor-Intensive Industries
The agreement will eliminate EU tariffs on a wide range of Indian products, including:
• Marine products (especially shrimp)
• Leather and footwear
• Textiles and garments
• Handicrafts
• Gems and jewellery
• Plastics and toys
These sectors are highly labor-intensive and represent areas where India competes directly with China, Bangladesh, and Vietnam. Having faced pressure from US tariffs in recent years, these industries now gain a meaningful advantage in the EU market, which can spur job creation in some of India’s largest employment sectors.
3. Strategic Access in Protected Sectors
While securing broad market access, India successfully protected its most sensitive domestic sectors, such as agriculture and dairy. At the same time, it agreed to reduce tariffs on other key goods like food, beverages, and automobiles. This balanced approach allows India to expand its export opportunities without compromising its core domestic industries.
4. Attracting More Foreign Direct Investment (FDI)
Deeper economic integration with the EU is expected to drive stronger foreign investment into India. The EU already accounts for about 15% of India's FDI inflows, led by the Netherlands, Germany, Belgium, and France. Historically, EU investment has concentrated in the services sector, particularly IT and software.
With India’s net FDI inflows softening recently, the FTA could revive investment momentum. This is especially true for manufacturing industries like automobiles, chemicals, and construction, which have previously lagged. Over time, increased FDI can fortify India's supply chains and strengthen its external financial balances.
5. Expanding India's Dominant Services Sector
The benefits of the FTA extend well beyond goods. India already exports services equivalent to about 1% of its GDP to the EU and maintains a surplus of around 0.2% of GDP. The new agreement includes "broader and deeper" commitments from the EU across 144 services subsectors.
This covers key areas where India is globally competitive, including:
• IT and Information Technology Enabled Services (ITeS)
• Professional services
• Education
• A wide range of business services
The deal creates a more stable and predictable policy environment for Indian service providers, while giving EU businesses and consumers better access to India's high-quality, cost-efficient service offerings.
Although the agreement marks a significant step, its formal signing is still several months away pending legal vetting. Its long-term success will ultimately depend on two critical factors.
First, India's manufacturing sector must meet the EU's stringent health, safety, and product standards. This may require substantial upgrades, especially for smaller manufacturers who may not be fully prepared to comply with these requirements.
Second, the ease of doing business remains a crucial factor. While India has made progress in liberalizing FDI, it continues to rank relatively high on the FDI Regulatory Restrictiveness Index. Further reforms to streamline approvals and regulatory processes will be necessary to fully unlock the potential benefits of this historic trade agreement.
White Label
Data API
Web Plug-ins
Poster Maker
Affiliate Program
The risk of loss in trading financial instruments such as stocks, FX, commodities, futures, bonds, ETFs and crypto can be substantial. You may sustain a total loss of the funds that you deposit with your broker. Therefore, you should carefully consider whether such trading is suitable for you in light of your circumstances and financial resources.
No decision to invest should be made without thoroughly conducting due diligence by yourself or consulting with your financial advisors. Our web content might not suit you since we don't know your financial conditions and investment needs. Our financial information might have latency or contain inaccuracy, so you should be fully responsible for any of your trading and investment decisions. The company will not be responsible for your capital loss.
Without getting permission from the website, you are not allowed to copy the website's graphics, texts, or trademarks. Intellectual property rights in the content or data incorporated into this website belong to its providers and exchange merchants.
Not Logged In
Log in to access more features
Log In
Sign Up