Markets
News
Analysis
User
24/7
Economic Calendar
Education
Data
- Names
- Latest
- Prev


Signal Accounts for Members
All Signal Accounts
All Contests
 Italy Retail Sales MoM (SA) (Oct)
A:--
F: --
P: --
 Euro Zone Employment YoY (SA) (Q3)
A:--
F: --
P: --
Euro Zone GDP Final YoY (Q3)A:--
F: --
P: --
Euro Zone GDP Final QoQ (Q3)A:--
F: --
P: --
Euro Zone Employment Final QoQ (SA) (Q3)A:--
F: --
P: --
Euro Zone Employment Final (SA) (Q3)A:--
F: --
 Brazil PPI MoM (Oct)
A:--
F: --
P: --
 Mexico Consumer Confidence Index (Nov)
A:--
F: --
P: --
 Canada Unemployment Rate (SA) (Nov)
A:--
F: --
P: --
Canada Labor Force Participation Rate (SA) (Nov)A:--
F: --
P: --
Canada Employment (SA) (Nov)A:--
F: --
P: --
Canada Part-Time Employment (SA) (Nov)A:--
F: --
P: --
Canada Full-time Employment (SA) (Nov)A:--
F: --
P: --
 U.S. Personal Income MoM (Sept)
A:--
F: --
P: --
U.S. PCE Price Index YoY (SA) (Sept)A:--
F: --
P: --
U.S. PCE Price Index MoM (Sept)A:--
F: --
P: --
U.S. Personal Outlays MoM (SA) (Sept)A:--
F: --
P: --
U.S. Core PCE Price Index MoM (Sept)A:--
F: --
P: --
U.S. Core PCE Price Index YoY (Sept)A:--
F: --
P: --
U.S. UMich 5-Year-Ahead Inflation Expectations Prelim YoY (Dec)A:--
F: --
P: --
U.S. Real Personal Consumption Expenditures MoM (Sept)A:--
F: --
P: --
U.S. 5-10 Year-Ahead Inflation Expectations (Dec)A:--
F: --
P: --
U.S. UMich Current Economic Conditions Index Prelim (Dec)A:--
F: --
P: --
U.S. UMich Consumer Sentiment Index Prelim (Dec)A:--
F: --
P: --
U.S. UMich 1-Year-Ahead Inflation Expectations Prelim (Dec)A:--
F: --
P: --
U.S. UMich Consumer Expectations Index Prelim (Dec)A:--
F: --
P: --
U.S. Weekly Total Rig CountA:--
F: --
P: --
U.S. Weekly Total Oil Rig CountA:--
F: --
P: --
U.S. Unit Labor Cost Prelim (SA) (Q3)--
F: --
P: --
U.S. Consumer Credit (SA) (Oct)A:--
F: --
P: --
 China, Mainland Foreign Exchange Reserves (Nov)
--
F: --
P: --
China, Mainland Exports YoY (USD) (Nov)--
F: --
P: --
China, Mainland Imports YoY (CNH) (Nov)--
F: --
P: --
China, Mainland Imports YoY (USD) (Nov)--
F: --
P: --
China, Mainland Imports (CNH) (Nov)--
F: --
P: --
China, Mainland Trade Balance (CNH) (Nov)--
F: --
P: --
China, Mainland Exports (Nov)--
F: --
P: --
 Japan Wages MoM (Oct)
--
F: --
P: --
Japan Trade Balance (Oct)--
F: --
P: --
Japan Nominal GDP Revised QoQ (Q3)--
F: --
P: --
Japan Trade Balance (Customs Data) (SA) (Oct)--
F: --
P: --
Japan GDP Annualized QoQ Revised (Q3)--
F: --
China, Mainland Exports YoY (CNH) (Nov)--
F: --
P: --
China, Mainland Trade Balance (USD) (Nov)--
F: --
P: --
 Germany Industrial Output MoM (SA) (Oct)
--
F: --
P: --
Euro Zone Sentix Investor Confidence Index (Dec)--
F: --
P: --
Canada Leading Index MoM (Nov)--
F: --
P: --
Canada National Economic Confidence Index--
F: --
P: --
U.S. Dallas Fed PCE Price Index YoY (Sept)--
F: --
P: --
U.S. 3-Year Note Auction Yield--
F: --
P: --
 U.K. BRC Overall Retail Sales YoY (Nov)
--
F: --
P: --
U.K. BRC Like-For-Like Retail Sales YoY (Nov)--
F: --
P: --
 Australia Overnight (Borrowing) Key Rate
--
F: --
P: --
RBA Rate Statement RBA Press Conference Germany Exports MoM (SA) (Oct)--
F: --
P: --
U.S. NFIB Small Business Optimism Index (SA) (Nov)--
F: --
P: --
Mexico Core CPI YoY (Nov)--
F: --
P: --
Mexico 12-Month Inflation (CPI) (Nov)--
F: --
P: --
Mexico PPI YoY (Nov)--
F: --
P: --

No matching data
Latest Views
Latest Views
Trending Topics
Top Columnists
Latest Update
White Label
Data API
Web Plug-ins
Affiliate Program
View All
No data
Oil declined at the start of the week as expectations that OPEC+ will hike production again in November exacerbated concerns about a glut.
Oil declined at the start of the week as expectations that OPEC+ will hike production again in November exacerbated concerns about a glut.
Brent dipped below $70 a barrel on Monday after rising 5.2% last week, while West Texas Intermediate traded around $65. The alliance led by Saudi Arabia is considering increasing output by at least as much as the 137,000 barrel-a-day hike scheduled for next month, according to people familiar with the plans.
The Organization of the Petroleum Exporting Countries and its allies are pursuing a strategy to reclaim market share rather than their typical role of managing prices, bringing back an additional layer of idled output. Still, oil prices have held up reasonably well, underpinned by robust buying from China.
However, the International Energy Agency is projecting a record glut in 2026 as OPEC+ continues to revive production and supply from the group’s rivals climbs. Goldman Sachs Group Inc. sees Brent falling to the mid-$50s a barrel next year, despite crude stockpiling from China.
New Zealand’s central bank has learned lessons from the post-pandemic bout of fast inflation and is now better placed to respond to future shocks, chief economist Paul Conway said.
The Reserve Bank’s Monetary Policy Committee has gained valuable insights into how economic activity, price setting by businesses and inflation expectations evolve during periods of high inflation and economic volatility, Conway said Monday in Wellington after releasing a review of monetary policy in recent years.
“We now have a deeper understanding of supply shocks and structural drivers of inflation and have expanded our use of high-frequency data for more timely and granular monitoring,” he said. “We have developed new tools to estimate neutral interest rates and run scenario analysis. These improvements ensure the MPC is well equipped to navigate future shocks while maintaining price stability.”
The RBNZ faced criticism for keeping policy too loose in the wake of the pandemic, which fueled price pressures and required higher interest rates to return inflation to its 1-3% target band. The bank today laid some of the blame on its dual mandate at the time — since removed — which required it to protect the labor market as well as contain inflation.
“In hindsight, an earlier or more aggressive tightening might have reduced inflation sooner,” Conway said. “But this would have been difficult given the data available at the time and could have conflicted with the MPC’s mandate back then, which included maintaining maximum sustainable employment.”
The RBNZ’s forecast errors increased significantly during the Covid-19 period between February 2020 and August 2022, primarily due to large and unusual shocks, today’s research said.
However, large forecast errors were also experienced by private forecasters and other central banks during that period, and since November 2022 “our forecasting performance has improved to near pre-Covid-19 levels,” it said.
The RBNZ said the economic effects of the government’s large, rapid fiscal easing during the pandemic were underestimated and it has taken steps to improve its understanding of the impact of fiscal policy and to enhance its relationship with the Treasury Department.
It has also taken steps to maintain and strengthen its operational readiness for alternative policy tools when needed, including large-scale asset purchases and a negative cash rate.
“Over the past two decades, neutral interest rates have declined significantly, both in New Zealand and globally,” the RBNZ said. “This structural shift increases the likelihood that the OCR could reach its effective lower bound in future downturns; a situation where conventional monetary policy alone may be insufficient to stabilize inflation.”
As of late 2021, all major banks in New Zealand are technically and operationally ready to support a negative OCR if required, the RBNZ said.
The economy and risk assets seem to be telling a conflicting story. In this environment, we believe there’s no better time to be taking a multi-asset approach to investing.In recent weeks U.S. and global equities have routinely hit record highs, credit spreads continue to trade at historic tights, and the VIX index of volatility is near its lows for the year so far.Few would have taken the bet six months ago that risk assets would be performing this way after markets plummeted at the beginning of April; even fewer would have done so had they had full visibility of the macroeconomic weak spots and current levels of fiscal and tariff impact uncertainty and geopolitical risk.
What this points to is the paradox seemingly playing out between a challenged economy and roaring risk markets; a conflict that, as we enter the final quarter of the year, looks unlikely to fade anytime soon.The questions then are how to explain it, and what might investors do about it?
We don’t have to look hard to see where some of the weak spots and risks are in the economic picture.There has been a clear deterioration in most of the U.S. employment and inflation data in the last several weeks, so much so that the Federal Reserve has re-engaged its rate-cutting cycle with the market pricing in 120 basis points of cuts in the next 12 months. Last week we saw core PCE inflation for July come in at 2.9% (annualized)—still well above the Fed’s 2% inflation target—and this week attention will focus on nonfarm payrolls and the unemployment data, two areas that have been a cause of some concern.
Together with this, the independence of the Fed is in focus and uncertainty persists around the economic impact of tariffs as well as on fiscal policy and sustainability.Concerns around these macro issues are similarly elevated among other major economies, particularly France, the U.K. and Japan, all of which have also seen related volatility at the long-end of their yield curves due to worries over their fiscal challenges. Growth in these economies is also sluggish.
To add to the mix, geopolitical risk remains at historic highs, with fresh spikes this month from Russia violating Polish, Estonian and Romanian airspace, and Israel carrying out a strike in Qatar against Hamas’ leadership.Although these acts have not had a sustained negative market impact, such as higher oil prices or a sharp fall in equities, the risk of broader escalation remains high.Importantly, these fears aren’t abstract. Most notably, gold prices recently hit an all-time high in real terms, exceeding the ‘safe-haven’ asset’s previous inflation-adjusted peak from 1980.
Remarkably, despite this pessimistic background, risk markets have ripped higher.
In our view, there are several reasons that may help explain why.
First, the continued resilience of the U.S. economy has been impressive, and while there are clear signs of weakness in employment and threats of higher inflation, these signs and others are not strong or numerous enough to indicate a recession, which would provoke an aggressive risk-off move in markets. Growth has, of course, moderated, but markets have rationalized the primary causes and effects and seem to have concluded that the U.S. economy, once again supported by monetary easing, is in decent shape and poised to slowly re-accelerate.
This optimistic view appears, for now, to override any developing concerns around the independence of the Fed and the U.S.’ fiscal challenges.Second, in the event of a serious downturn, major central banks have more space to step in and cut rates than they have had in more than a decade, which is surely giving markets some comfort. Such action is more credible today because rates are higher than where they have been, and with inflation broadly slowing and back under control, there is more scope for deeper cuts should they be needed.
Third, the continued power and earnings growth of the mega-cap U.S. technology companies—ultimately the ‘Magnificent 7’—and parallel improvement in earnings across a broader universe of companies, industries and geographies has been a surprise to the upside. Coming into the year there was some expectation U.S. mega-cap tech company earnings would decelerate. Clearly this hasn’t happened, and the broadening-out story has gained momentum, buttressing U.S. and international equity markets.
Importantly, monetary easing and a weak U.S. dollar have also been key factors supporting, if not catalyzing, global equities. U.S. and non-U.S. fixed income have benefited from this too.Fourth, corporate credit quality across investment grade and sub-investment grade markets is generally robust despite relatively high rates, particularly in the U.S., and persistence of economic and policy uncertainty. The current historically tight credit spread levels reflect this dynamic and the healthy depth of demand from investors, drawn in by the attractive all-in yields of corporate and high-yield bonds. Providing additional support to this is that corporate default rates globally remain relatively low.
Finally, while geopolitical risk remains elevated and may reasonably be expected to spike again in the near-term, markets seem inured to it and are only unnerved by a full-scale war or other humanitarian disaster that affects economic forecasts or asset prices, particularly currencies and oil.
Without doubt, we are in an unusual environment right now; one that feels as complex as it is unpredictable. As such, investors should rightly be cautious about where we go from here.However, while conscious of the economic weaknesses and the risks, we remain optimistic in our outlook for growth and risk assets over the medium term, a view that has been consistent throughout the year.
In equities, in particular, optimism is clearly being priced in. But we don’t believe there is an irrational exuberance and overextension in allocations, not least because absolute yields in fixed income remain attractive.What’s important, especially now, is that investors ensure portfolios are as diversified as they can be across multiple asset classes, providing a balance of exposures across public and private markets that blend attractive sources of risk-adjusted returns with sufficient downside protection.Multi-asset investing works through the cycles. It’s during times like these that it comes to the fore.
The central bank kept rates steady at 0.5% earlier this month, as expected, but dissenting calls by two board members for a quarter point hike stunned markets and were read as a sign the BOJ was less worried about economic headwinds than first thought.
While it is uncertain whether the move was designed as an intentional signal to markets a rate hike was imminent, veteran BOJ watcher Mari Iwashita said it represented a growing board view that conditions for the next rise were falling into place.
"The dissenters probably wanted to nudge Ueda to move faster and get a rate hike done, given it was something that would happen sooner or later," Iwashita said.
Since taking the helm at the BOJ in 2023, Ueda has delivered the bank's first rate hike in 17 years but has in the past six months grown more cautious about the outlook.
Ueda's dovishness contrasts with a shift in views among others in the BOJ's nine-member board in recent months, who are calling for more rate hikes.
Board members Naoki Tamura and Hajime Takata surprised markets by proposing a rate hike at the BOJ's decision in September.
The exact timing of the next hike rests on whether upcoming data convince BOJ policymakers the U.S. will avert a recession, and U.S. levies won't derail Japan's fragile economic recovery, said sources familiar with the central bank's thinking.
At the same time, mounting price pressure has been worrying the board since as early as July. While some members expected food inflation to dissipate, others warned that steady price rises of daily necessities could unleash broad-based, persistent inflation, minutes of the July 30-31 meeting showed.
For the most part, policymakers seem to be looking through recent economic weakness.
Of the six opinions on the monetary policy outlook, all but one called for raising rates in a timely fashion with one seeing the chance of doing so by year-end, the July minutes showed.
Since then, data has shown limited economic damage from U.S. tariffs with some policymakers viewing an August drop in exports as largely a reaction to pent-up demand in prior months.
While dismal jobs data stoked fears of U.S. recession, such concern has eased as the economy shows resilience and prospects that rate cuts by the Federal Reserve would underpin growth.
The dissenters may find more allies in the nine-member board if upcoming data further ease concern of a steep U.S. downturn, and show Japan's manufacturers can weather the hit from U.S. levies, said one of the sources.
"It's crucial that there were two, not one, dissenters," said the source, who spoke on condition of anonymity as he was not authorised to speak publicly. "This could sway other members more in favour of a near-term rate hike."
While BOJ policymakers have been mum on the pace and timing of future rate hikes, there is broad consensus it will come at one of the three meetings by January next year, the sources say.
Markets have priced in roughly a 50% chance of a rate hike in October. A Reuters poll showed a majority of economists expect another 25-basis-point hike by year-end, although there was less conviction about the timing with bets centering on October and January.
A former commercial banker, Tamura is a well-known hawk who made a solo, unsuccessful proposal in December to hike rates to 0.5% - only to see the BOJ do just that a month later.
The significance of the split vote was heightened by the dissent of Takata, who has always voted in favour of Ueda's proposal and was seen holding views close to those of the governor, analysts say.
"Though it's hard to tell, the dissents could have been an intentional signal to markets that a rate hike is approaching," former BOJ board member Makoto Sakurai told Reuters.
The board's hawkish bias contrasts with a generation of dovish policymakers who dominated during the era of Ueda's predecessor Haruhiko Kuroda, but have since bowed out.
Newcomer Junko Koeda, who succeeded Adachi, has expressed concerns about rising food prices.
Another newcomer, Kazuyuki Masu, is seen as neutral on policy and replaced Toyoaki Nakamura, a dove who repeatedly dissented from the BOJ's decision to phase out stimulus.
That has left Ueda as the most cautious board member.
Some analysts doubt whether enough data would come out by the October 29-30 meeting to convince Ueda, who has huge sway on the rate decision, to pull the trigger.
"Judging from his recent remarks, I don't think he's convinced that conditions for a hike are in place," said former BOJ board member Seiji Adachi, who sat on the board until March.
Among key data coming out is the BOJ's "tankan" business survey, due on October 1, which will show how U.S. tariffs are affecting businesses. A report by the BOJ's regional branch managers, due on October 6, will give an overview of how smaller firms are weathering tariffs.
In the end, politics and exchange-rate moves could be a key factor swaying the rate-hike timing, especially as Prime Minister Shigeru Ishiba steps down.
Concerns his replacement could meddle in monetary policy have receded with none of the candidates, including advocate of monetary easing Sanae Takaichi, opposing rate hikes. One even backed moderate increases in borrowing costs.
A renewed fall in the yen, which has weakened to near the critical 150 line to the dollar, may pressure the BOJ to hike rates as it accelerates inflation by lifting import costs, analysts say.
"Given how much Ueda stressed downside economic risks, it's logically hard to justify a rate hike in October," Adachi said. "But sometimes, it's not just about logic."
A man who crashed his vehicle through the front doors of a Mormon church in Michigan opened fire with an assault rifle and set the church ablaze, killing at least four people and wounding at least eight others before dying in a shootout with police, officials said.Police said the perpetrator, identified as Thomas Jacob Sanford, 40, a former U.S. Marine from the nearby town of Burton, deliberately set fire to the church, which was engulfed in flames and billowing smoke.Two of the shooting victims died and eight others were hospitalized, officials said. Several hours after the shooting, police reported finding at least two more bodies in the charred remains of the church, which had not yet been cleared and may contain other victims.
"There are some that are unaccounted for," Grand Blanc Township Police Chief William Renye told a press conference.Hundreds of people were in the church when Sanford drove into the building, Renye said.Two law enforcement officers, one from the state Department of Natural Resources and another from Grand Blanc Township, rushed to the scene within 30 seconds of receiving calls and engaged the suspect in an exchange of gunfire, shooting him dead in the parking lot about eight minutes after the incident began, Renye said.
Investigators will search the shooter's home and phone records in search of a motive, Renye said.U.S. military records show Sanford was a U.S. Marine from 2004 to 2008 and an Iraq war veteran.Coincidentally, another 40-year-old Marine veteran who served in Iraq is a suspect in a North Carolina shooting that killed three people and wounded five others less than 14 hours before the Michigan incident.Police in Southport, North Carolina, accused Nigel Max Edge of firing on a waterfront bar from a boat on Saturday night. Edge has been charged with three counts of first-degree murder and five counts of attempted murder, police said.


According to court records, a federal lawsuit that Edge had filed against the U.S. government, and others, describes him as a decorated Marine who suffered severe wounds including traumatic brain injury in Iraq. The lawsuit, which was dismissed, showed Edge was previously known as Sean William DeBevoise before changing his name.
In Michigan, a woman who gave her name as Paula described her escape as “surreal” in an interview with WXYZ television.“We heard a big bang and the doors blew. And then everybody rushed out,” she said, adding that there was no security and the shooter opened fire on parishioners as they fled.“I lost friends in there and some of my little primary children that I teach on Sundays were hurt. It’s very devastating for me," she said.The Mormons, formally known as the Church of Jesus Christ of Latter-day Saints, follow the teachings of Jesus but also the prophecies of Joseph Smith, a 19th century American.
Grand Blanc, a town of 7,700 people, is about 60 miles (100 km) northwest of Detroit.“My heart is breaking for the Grand Blanc community," Michigan Governor Gretchen Whitmer said in a statement posted to social media. "Violence anywhere especially in a place of worship, is unacceptable."President Donald Trump in a statement on Truth Social said that the shooting "appears to be yet another targeted attack on Christians in the United States of America" and said the FBI was on the scene. "THIS EPIDEMIC OF VIOLENCE IN OUR COUNTRY MUST END, IMMEDIATELY!"
The Michigan rampage marked the 324th mass shooting in the U.S. in 2025, according to the Gun Violence Archive, which tracks such incidents and describes a mass shooting as one in which four or more people are shot or killed, not including the shooter.It was also the third U.S. mass shooting in less than 24 hours, including the North Carolina incident and a shooting a few hours later at a casino in Eagle Pass, Texas, that killed at least two people and injured several others.
A hawkish board split at the Bank of Japan's policy meeting this month has increased pressure on its dovish governor Kazuo Ueda to move faster on interest rate hikes, raising the prospect the next tightening could come as soon as October.The central bank kept rates steady at 0.5% earlier this month, as expected, but dissenting calls by two board members for a quarter point hike stunned markets and were read as a sign the BOJ was less worried about economic headwinds than first thought.
While it is uncertain whether the move was designed as an intentional signal to markets a rate hike was imminent, veteran BOJ watcher Mari Iwashita said it represented a growing board view that conditions for the next rise were falling into place."The dissenters probably wanted to nudge Ueda to move faster and get a rate hike done, given it was something that would happen sooner or later," Iwashita said.Since taking the helm at the BOJ in 2023, Ueda has delivered the bank's first rate hike in 17 years but has in the past six months grown more cautious about the outlook.
Ueda's dovishness contrasts with a shift in views among others in the BOJ's nine-member board in recent months, who are calling for more rate hikes.Board members Naoki Tamura and Hajime Takata surprised markets by proposing a rate hike at the BOJ's decision in September.The exact timing of the next hike rests on whether upcoming data convince BOJ policymakers the U.S. will avert a recession, and U.S. levies won't derail Japan's fragile economic recovery, said sources familiar with the central bank's thinking.
At the same time, mounting price pressure has been worrying the board since as early as July. While some members expected food inflation to dissipate, others warned that steady price rises of daily necessities could unleash broad-based, persistent inflation, minutes of the July 30-31 meeting showed.For the most part, policymakers seem to be looking through recent economic weakness.Of the six opinions on the monetary policy outlook, all but one called for raising rates in a timely fashion with one seeing the chance of doing so by year-end, the July minutes showed.
Since then, data has shown limited economic damage from U.S. tariffs with some policymakers viewing an August drop in exports as largely a reaction to pent-up demand in prior months.While dismal jobs data stoked fears of U.S. recession, such concern has eased as the economy shows resilience and prospects that rate cuts by the Federal Reserve would underpin growth.The dissenters may find more allies in the nine-member board if upcoming data further ease concern of a steep U.S. downturn, and show Japan's manufacturers can weather the hit from U.S. levies, said one of the sources.
"It's crucial that there were two, not one, dissenters," said the source, who spoke on condition of anonymity as he was not authorised to speak publicly. "This could sway other members more in favour of a near-term rate hike."While BOJ policymakers have been mum on the pace and timing of future rate hikes, there is broad consensus it will come at one of the three meetings by January next year, the sources say.
Markets have priced in roughly a 50% chance of a rate hike in October. A Reuters poll showed a majority of economists expect another 25-basis-point hike by year-end, although there was less conviction about the timing with bets centering on October and January.
A former commercial banker, Tamura is a well-known hawk who made a solo, unsuccessful proposal in December to hike rates to 0.5% - only to see the BOJ do just that a month later.The significance of the split vote was heightened by the dissent of Takata, who has always voted in favour of Ueda's proposal and was seen holding views close to those of the governor, analysts say."Though it's hard to tell, the dissents could have been an intentional signal to markets that a rate hike is approaching," former BOJ board member Makoto Sakurai told Reuters.
The board's hawkish bias contrasts with a generation of dovish policymakers who dominated during the era of Ueda's predecessor Haruhiko Kuroda, but have since bowed out.Newcomer Junko Koeda, who succeeded Adachi, has expressed concerns about rising food prices.Another newcomer, Kazuyuki Masu, is seen as neutral on policy and replaced Toyoaki Nakamura, a dove who repeatedly dissented from the BOJ's decision to phase out stimulus.
Some analysts doubt whether enough data would come out by the October 29-30 meeting to convince Ueda, who has huge sway on the rate decision, to pull the trigger."Judging from his recent remarks, I don't think he's convinced that conditions for a hike are in place," said former BOJ board member Seiji Adachi, who sat on the board until March.Among key data coming out is the BOJ's "tankan" business survey, due on October 1, which will show how U.S. tariffs are affecting businesses. A report by the BOJ's regional branch managers, due on October 6, will give an overview of how smaller firms are weathering tariffs.
In the end, politics and exchange-rate moves could be a key factor swaying the rate-hike timing, especially as Prime Minister Shigeru Ishiba steps down.Concerns his replacement could meddle in monetary policy have receded with none of the candidates, including advocate of monetary easing Sanae Takaichi, opposing rate hikes. One even backed moderate increases in borrowing costs.A renewed fall in the yen, which has weakened to near the critical 150 line to the dollar, may pressure the BOJ to hike rates as it accelerates inflation by lifting import costs, analysts say.
"Given how much Ueda stressed downside economic risks, it's logically hard to justify a rate hike in October," Adachi said. "But sometimes, it's not just about logic."
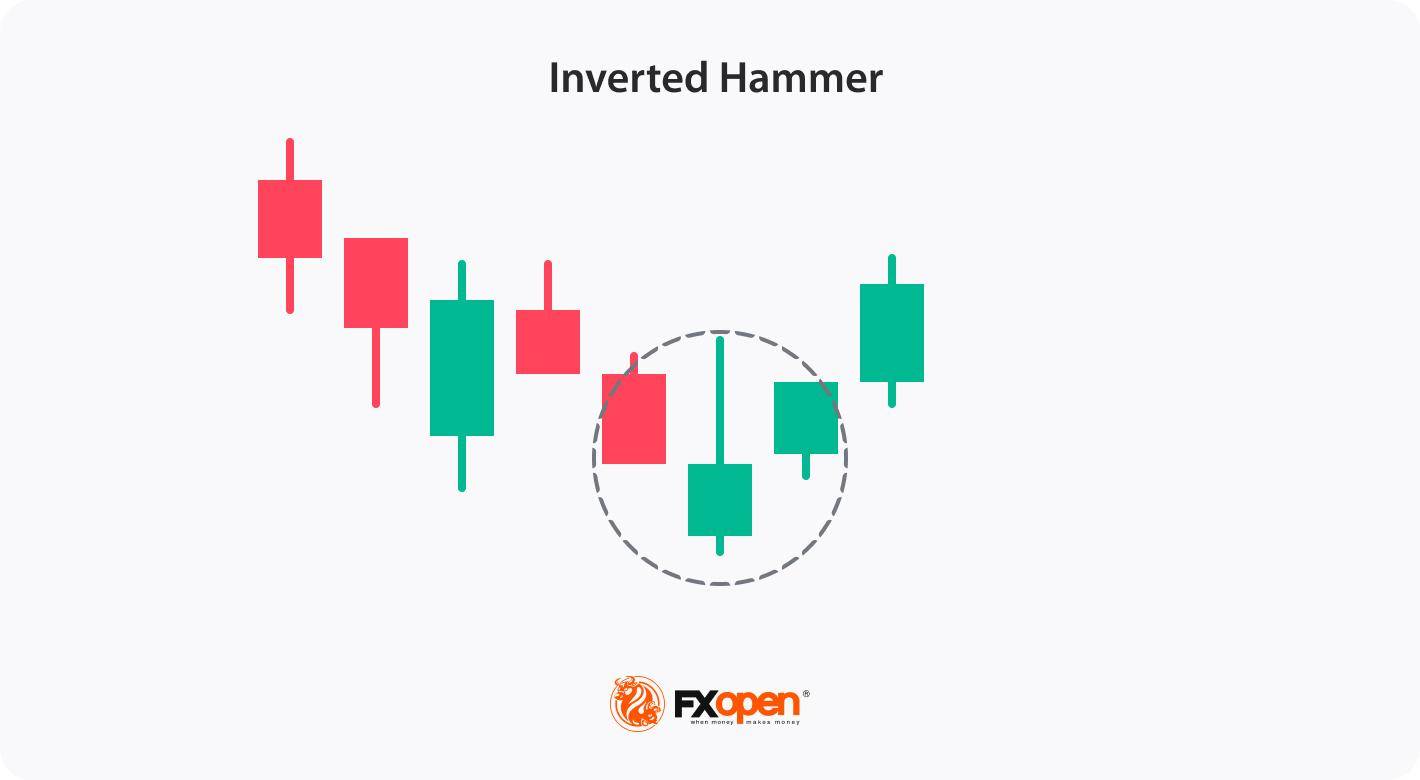
In trading, patterns are powerful tools, allowing traders to anticipate changes in trend direction. One such pattern is the inverted hammer, a formation often seen as a bullish signal following a downtrend. Recognising this pattern and understanding its implications can be crucial for traders looking to spot reversal opportunities. In this article, we will explore the meaning of inverted hammer candlestick, how to identify it on a price chart, and how traders can incorporate it into their trading strategies.
An inverted hammer is a candlestick pattern that appears at the end of a downtrend, typically signalling a potential bullish reversal. It has a distinct shape, with a small body at the lower end of the candle and a long upper wick that is at least twice the size of the body. This structure suggests that although sellers initially dominated, buyers stepped in, pushing prices higher before closing near the opening level. While the inverted hammer alone does not confirm a reversal, it’s often considered a sign of a possible trend change when followed by a bullish move on subsequent candles.
The pattern can have any colour so that you can find a red inverted hammer candlestick or upside down green hammer. Although both will signal a bullish reversal, an inverted green hammer candle is believed to provide a stronger signal, reflecting the strength of bulls.
One of the unique features of this pattern is that traders can apply it to various financial instruments, such as stocks, cryptocurrencies*, ETFs, indices, and forex, across different timeframes.
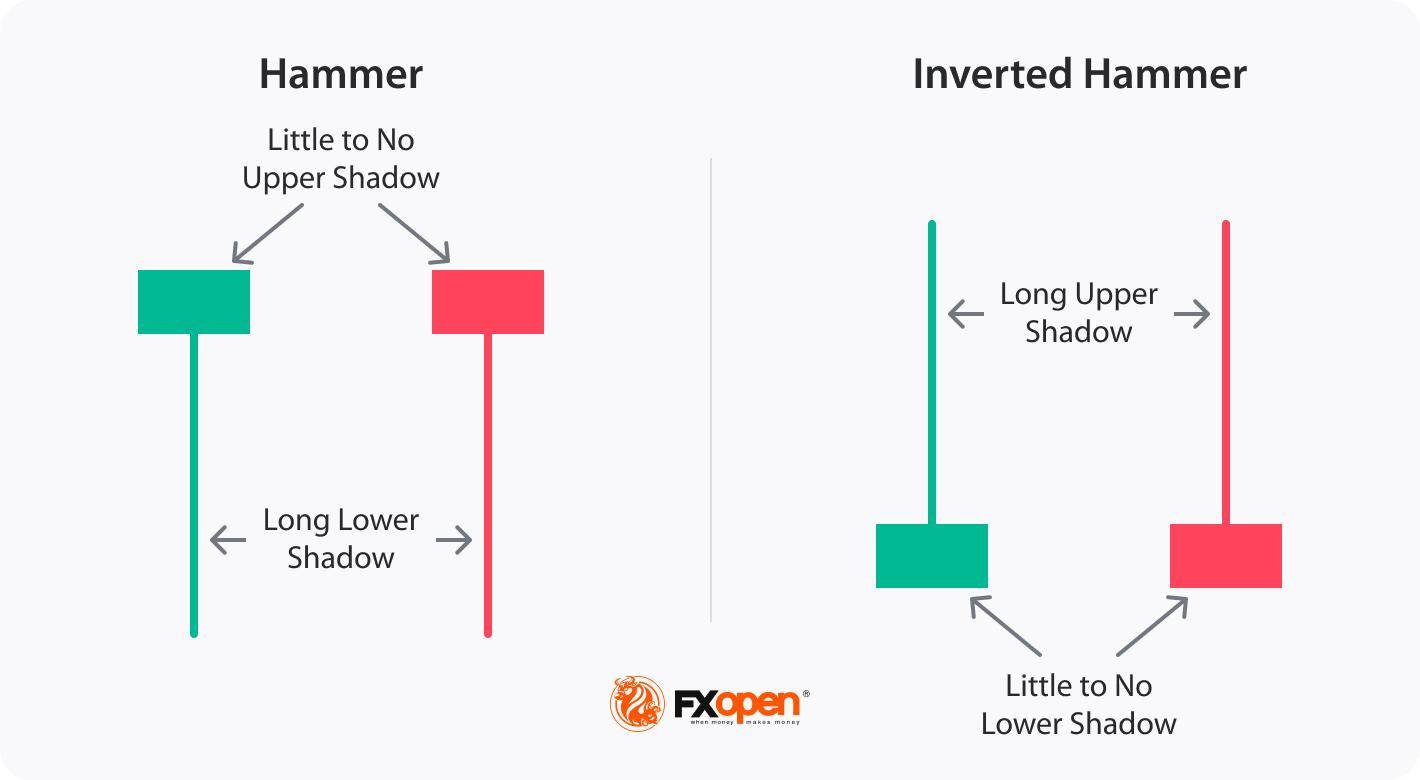
The hammer and inverted hammer are both single-candle patterns that appear in downtrends and signal potential bullish reversals, but they have distinct formations and implications:
Both patterns signal possible bullish sentiment, but while the green or red hammer candlestick focuses on buyer strength after selling, the inverted hammer suggests buyer interest in an overall bearish context, needing further confirmation for a trend shift.
Although the inverted hammer is easy to recognise, there are some rules traders follow to increase the reliability of the reversal signal it provides.
Step 1: Identify the Pattern in a Downtrend
Step 2: Choose Appropriate Timeframes
Step 3: Use Indicators to Strengthen Identification
Step 4: Look for Confirmation Signals
By following these steps and waiting for confirmation signals, traders can increase the reliability of the inverted hammer’s signals.
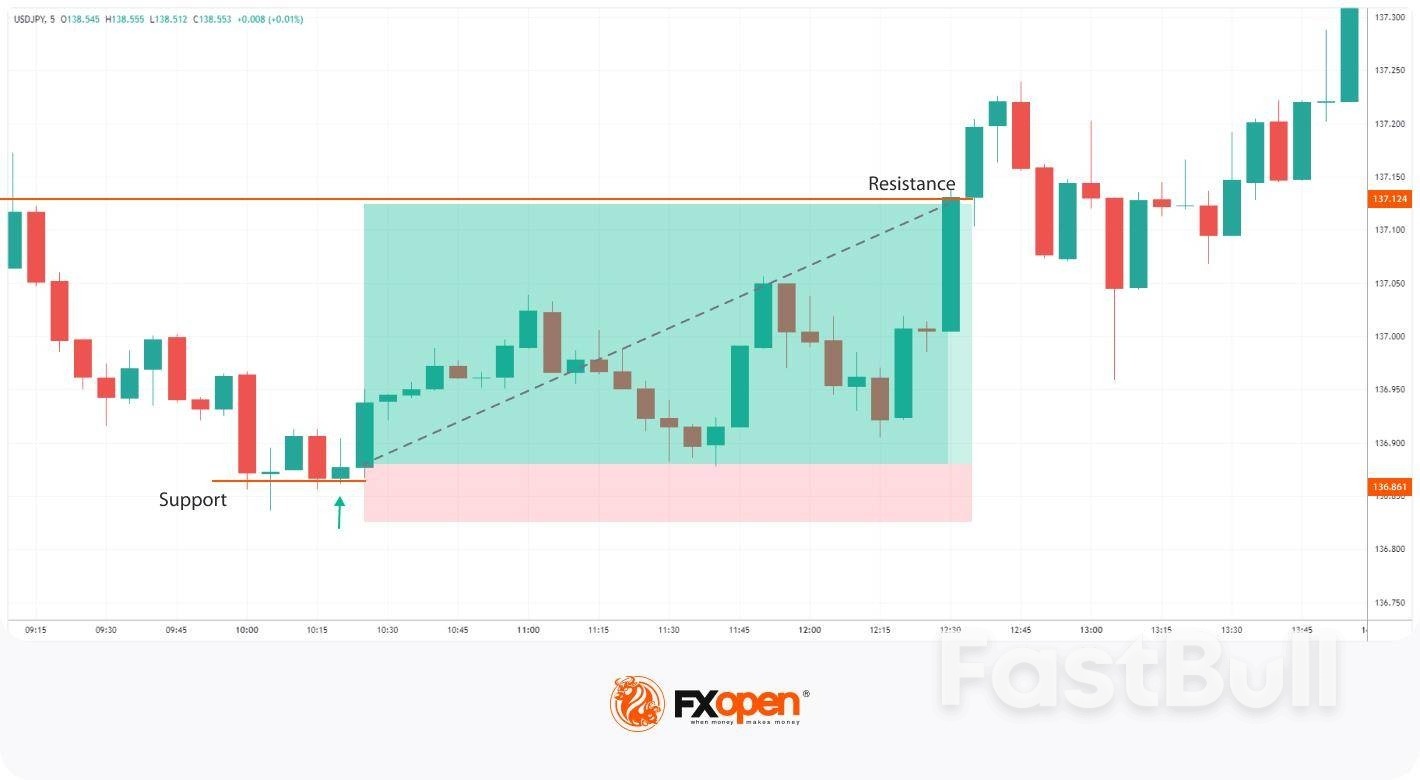
Trading the inverted hammer involves implementing a systematic approach to capitalise on potential bullish reversals. Here are some steps traders may consider when trading:
The trader looks for a bullish inverted hammer on the USDJPY chart. After a subsequent downtrend, the inverted hammer provides a buying opportunity that aligns with the support level. They enter the market at the close of the inverted hammer candle and place a stop loss below the support level. Their take-profit target is at the next resistance level.A trader could implement a more conservative approach and wait for at least a few candles to form in the uptrend direction. However, as the pattern was formed at the 5-minute chart, a trader could lose a trading opportunity or enter the market with a poor risk-reward ratio.
The inverted hammer has its strengths and limitations. Here’s a closer look:
Advantages
Limitations
While the inverted hammer can provide valuable insights into potential trend reversals, it should not be the sole basis for trading decisions. It is important to supplement analysis with other technical indicators and tools to strengthen the overall trading strategy. Furthermore, effective risk management strategies are crucial while trading the setup. Setting appropriate stop-loss orders to limit potential losses and implementing proper position sizing techniques can help potentially mitigate risks and protect trading capital.
FAQ
Is an Inverted Hammer Bullish?
Yes, it is considered a bullish reversal pattern. It indicates a potential shift from a downtrend to an uptrend in the market. While it may seem counterintuitive due to its name, the setup suggests that buying pressure has overcome selling pressure and that bulls are gaining strength.
How Do You Trade an Inverted Hammer?
To trade an inverted hammer, traders wait for confirmation in the next session, such as a gap-up or strong bullish candle. They usually enter a buy position with a stop-loss below the low of the pattern to potentially manage risk and a take-profit level at the closest resistance level.
Is the Inverted Hammer a Trend Reversal Signal?
It is generally considered a potential trend reversal signal. An inverted hammer in a downtrend suggests a shift in market sentiment from bearish to bullish. An inverted hammer in an uptrend does not signify anything.
What Happens After a Reverse Hammer Candlestick?
After a reverse (or inverted) hammer candle, there may be a potential bullish reversal if confirmed by a strong bullish candle in the next session. However, without confirmation, the pattern alone does not guarantee a trend change.
How Do You Trade an Inverted Hammer Candlestick in an Uptrend?
In an uptrend, an inverted hammer isn’t generally considered significant because it’s primarily a reversal signal in a downtrend.
Are Inverted Hammer and Shooting Star the Same?
No, the inverted hammer and shooting star look similar but occur in opposite trends; the former appears in a downtrend as a bullish reversal signal, while the latter appears in an uptrend as a bearish reversal signal.
What Is the Difference Between a Hanging Man and an Inverted Hammer?
The hanging man and inverted hammer differ in both appearance and context. The former appears at the end of an uptrend as a bearish signal and has a small body and a long lower shadow, while the latter appears at the end of a downtrend as a bullish signal and has a small body and a long upper shadow.
What Is the Difference Between a Red and Green Inverted Hammer?
A green (bullish) inverted hammer candlestick closes higher than its opening price, indicating a stronger bullish sentiment. A red (bearish) inverted hammer candlestick closes lower than its opening, which might indicate less buying strength, but both colours can signal a reversal if followed by confirmation.
728 RM B 7/F GEE LOK IND BLDG NO 34 HUNG TO RD KWUN TONG KLN HONG KONG


White Label
Data API
Web Plug-ins
Poster Maker
Affiliate Program
The risk of loss in trading financial instruments such as stocks, FX, commodities, futures, bonds, ETFs and crypto can be substantial. You may sustain a total loss of the funds that you deposit with your broker. Therefore, you should carefully consider whether such trading is suitable for you in light of your circumstances and financial resources.
No decision to invest should be made without thoroughly conducting due diligence by yourself or consulting with your financial advisors. Our web content might not suit you since we don't know your financial conditions and investment needs. Our financial information might have latency or contain inaccuracy, so you should be fully responsible for any of your trading and investment decisions. The company will not be responsible for your capital loss.
Without getting permission from the website, you are not allowed to copy the website's graphics, texts, or trademarks. Intellectual property rights in the content or data incorporated into this website belong to its providers and exchange merchants.
Not Logged In
Log in to access more features

FastBull Membership
Not yet
Purchase


Log In
Sign Up