


- GBPUSD
- XAUUSD
- XAGUSD
- WTI
- USDX


Markets
Analysis
User
24/7
Economic Calendar
Education
Data
- Names
- Latest
- Prev


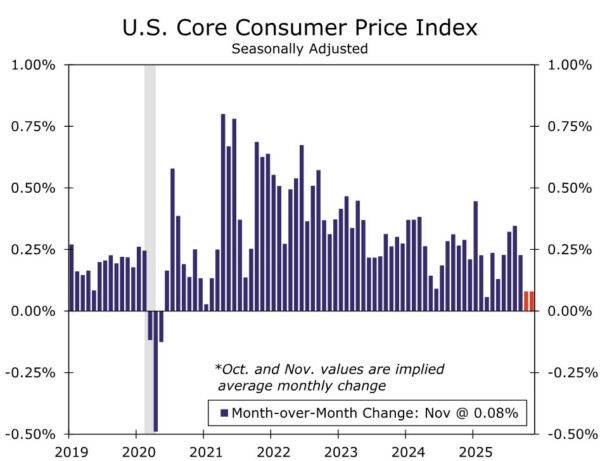
The November CPI report creates more questions than answers about the recent pace of price growth. Consumer prices rose 2.7% in the 12 months ending in November, materially below our expectations for a 3.0% gain.
The November CPI report creates more questions than answers about the recent pace of price growth. Consumer prices rose 2.7% in the 12 months ending in November, materially below our expectations for a 3.0% gain. The core index similarly fell short of expectations, advancing 2.6% over the past 12 months versus our forecast for a 2.9% increase. The stark miss comes on the heels of the longest-ever government shutdown that led the BLS to skip October data collection and not begin the November collection process until the middle of the month.
As such, we caution against reading too much into today's report. The November data suggest core prices rose 0.16% over the past two months, or an average of 0.08% per month. For comparison, the core index has increased at an average monthly pace of 0.25% this year. CPI data are not revised, and as a result we believe the data will be noisy for at least another month or two. A bounce back in prices in the December CPI report to be released on January 13 is probably coming. Through the noise, we believe inflation is slowing on trend, even if today's reading overstates the magnitude of the slowdown. We remain comfortable with our current projection of rate cuts from the FOMC in March and June of next year.
The government shutdown appears to have caused issues in the consumer price inflation data collection process. The two-month percent change in headline and core CPI were 0.20% and 0.16%, respectively, meaningfully below our forecasts of 0.45% and 0.48%. For context, the two-month change in headline and core CPI from July to September was 0.69% and 0.57%, respectively. This pushed the year-ago pace of headline and core CPI inflation down to 2.7% and 2.6%, a steep decline from 3.0% and 3.1% in September. The slowdown was broad-based across nearly all categories, adding to our suspicions that the shutdown's disruptions caused issues in the data. Data collection didn't begin until the second half of November, which may have skewed the sample more than we anticipated.
Food prices rose 0.06% over the past two months, a significantly slower pace than the 0.25% average monthly rise this year. Taking a step back from this report's noise, forward-looking measures of food-related commodities have slipped into deflation territory, which, when coupled with recent rollbacks on select food tariffs, point to a disinflationary trend in food inflation even if not to the extent implied in today's report. Energy was the lone category that came in reasonably near expectations, rising 1.08% over the past two months and up 4.1% year-over-year in November. This is likely due to gasoline prices being collected from a non survey source and thus being one of the few sub-categories the BLS was able to publish price data for in October. New and used autos prices were also produced under their usual methodology and came in a touch stronger than we expected.
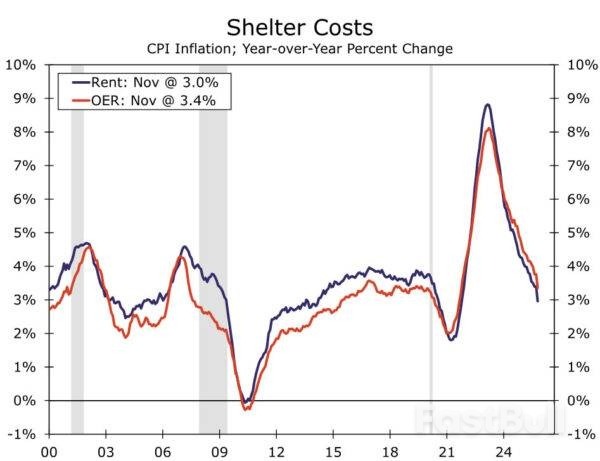
Core goods prices rose only 0.06% between September and November, compared to a 0.15% average monthly rise headed into this report. Similarly, core services rose only 0.16% over the past two months. Shelter inflation was a prime example of the puzzlingly weak inflation data in core. Owners' equivalent rent rose 0.27% over two months, while rents rose just 0.13%. The weak outturn lead these categories down to 3.4% and 3.0%, respectively, on a year-over-year basis, breaking away from their recent trends (chart). In short, we are not putting much weight on the details of this report, and we anticipate a bounce back in the December reading to be released on January 13.
While materially softer than expected, we think the collection issues around this particular report means it will do little to change Fed officials' current views on inflation. Inflation pressures are softening, but not to this degree. With the Fed waiting for (reliable) inflation data before cutting rates again, today's data add to our conviction that the FOMC will be on hold at the January meeting. That said, data issues aside, our belief is that inflation is slowing on trend, even if today's print overstates the slowdown. When paired with the softening in the labor market, we remain comfortable with rate cuts in March and June of next year. At that point, we believe cleaner data will give the Committee more confidence that inflation is leveling off and will soon be moving back toward 2%.
728 RM B 7/F GEE LOK IND BLDG NO 34 HUNG TO RD KWUN TONG KLN HONG KONG


The risk of loss in trading financial instruments such as stocks, FX, commodities, futures, bonds, ETFs and crypto can be substantial. You may sustain a total loss of the funds that you deposit with your broker. Therefore, you should carefully consider whether such trading is suitable for you in light of your circumstances and financial resources.
No decision to invest should be made without thoroughly conducting due diligence by yourself or consulting with your financial advisors. Our web content might not suit you since we don't know your financial conditions and investment needs. Our financial information might have latency or contain inaccuracy, so you should be fully responsible for any of your trading and investment decisions. The company will not be responsible for your capital loss.
Without getting permission from the website, you are not allowed to copy the website's graphics, texts, or trademarks. Intellectual property rights in the content or data incorporated into this website belong to its providers and exchange merchants.
Not Logged In
Log in to access more features


Log In
Sign Up


